
A strong nor’easter is expected to form on Saturday then track up the east coast. Present waves in the range of 2-4 feet are expected to build through Sunday along with the storm as gale warnings pop up. Good surf expected Monday and Tuesday following the storm.
All posts tagged nature
OBX Wave Report February 10 — Nor’Easter Expected to Form Saturday Night

Posted by robertscribbler on February 10, 2023
https://robertscribbler.wordpress.com/2023/02/10/obx-wave-report-february-10-noreaster-expected-to-form-saturday-night/
Waves Emerge From the Mists
Fog envelops the break at Jennette’s Pier.
Share this:
Posted by robertscribbler on January 31, 2023
https://robertscribbler.wordpress.com/2023/01/31/waves-emerge-from-the-mists/
Grackles and Grovelers
Grackles congregate above the break at Jennette’s Pier.
Share this:
Posted by robertscribbler on January 24, 2023
https://robertscribbler.wordpress.com/2023/01/24/grackles-and-grovelers/
Surfers and Bodyboarders Shredding it at Jennette’s Pier
Beautiful blue-green barrels at Jennette’s Pier on Jan 23rd.
Share this:
Posted by robertscribbler on January 24, 2023
https://robertscribbler.wordpress.com/2023/01/24/surfers-and-bodyboarders-shredding-it-at-jennettes-pier/
Sound of Wave and Wind, Sight of Surf and Spray
Ten minutes of the relaxing sounds and sights of the Outer Banks filmed from Nag’s Head.
Share this:
Posted by robertscribbler on January 20, 2023
https://robertscribbler.wordpress.com/2023/01/20/sound-of-wave-and-wind-sight-of-surf-and-spray/
An Outer Banks Man and His Grackle Friends
Every day, during Fall, Winter, and Spring this OBX man comes to feed his grackle friends at a Nags Head beach.
Share this:
Posted by robertscribbler on January 10, 2023
https://robertscribbler.wordpress.com/2023/01/10/an-outer-banks-man-and-his-grackle-friends/
OBX Pre-Storm Sea and Skies
A change in the weather is afoot as gentle waves roll onto OBX shores beneath beautiful skies.
Share this:
Posted by robertscribbler on December 22, 2022
https://robertscribbler.wordpress.com/2022/12/22/obx-pre-storm-sea-and-skies/
God Rays and Storm Waves
Robert films a majestic storm-tossed ocean with god rays streaming down.
Editorial note — the word ‘god-ray’ is a descriptor from modern fantasy that describes sun or moon rays streaming down. These natural god rays are just majestic. And you can often find them visible in coastal communities.
Share this:
Posted by robertscribbler on December 9, 2022
https://robertscribbler.wordpress.com/2022/12/09/god-rays-and-storm-waves/
Surfers Catch Some Glassy Waves at Jennette’s Pier on the Beautiful Evening of December 6
Jennette’s Pier features a gorgeous evening break.
Share this:
Posted by robertscribbler on December 6, 2022
https://robertscribbler.wordpress.com/2022/12/06/surfers-catch-some-glassy-waves-at-jennettes-pier-on-the-beautiful-evening-of-december-6/
Avalon Pier — Surreal December 6 Ocean
Surreal, smooth ocean waters churn across the beaches south of Avalon Pier on December 6.
Share this:
Posted by robertscribbler on December 6, 2022
https://robertscribbler.wordpress.com/2022/12/06/avalon-pier-surreal-december-6-ocean/
Polar Warming Spawns More Severe Winter Storms
So there’s a lot of groundbreaking work going on in the climate sciences right now. And a major focus is evidence that winter polar warming events are increasingly connected to blizzards and storms in places like Europe and North America. Storms that are both historically powerful and that occur with greater frequency.

(A historic nor’easter produces major flooding on the U.S. East Coast even as a blizzard pounds the UK in early March. Were these extreme storms linked to human-caused climate change and related rapid polar warming? A new scientific study says — yes. Image source: NASA Worldview.)
A new study led by pioneers in the emerging field of climate change attribution for extreme weather events (including the notable Dr. Jennifer Francis), finds:
Recent boreal winters have exhibited a large-scale seesaw temperature pattern characterized by an unusually warm Arctic and cold continents… Using a recently developed index of severe winter weather, we show that the occurrence of severe winter weather in the United States is significantly related to anomalies in pan-Arctic geopotential heights and temperatures.
In particular, the authors discovered that “winter storms were two to four times more likely when the Arctic is abnormally warm, compared to when it was abnormally cold (emphasis added).”
Stronger, More Frequent Storms
This is a rather big deal for a number of reasons. First, it’s an observational confirmation of earlier scientific work predicting just these kinds of extreme weather instances due to polar warming and related climate change. Second, it’s another indicator that human-caused climate change is pushing us into a period of much stormier weather for the North Atlantic region during fall and winter.

(A new study in the journal Nature finds that winter storms in the U.S. are two to four times more likely when the Arctic is abnormally warm than when it is abnormally cold. Due to human-caused climate change, the Arctic is now warming up at a rate two times faster than the rest of the globe (emphasis added). Image source: Atmospheric and Environmental Research.)
With the new NASA global temperature data set out, I thought we’d take this opportunity to apply a bit of context to apparent stormy changes we see at present in winter weather patterns.
The first bit that I’d like to be crystal clear about is that the Arctic, overall, has become much, much warmer than usual during winter. That this warming spike occurs in the context overall global warming. And that this polar warming is increasingly associated with severe weather events in the middle latitudes and especially over the land and North Atlantic mid latitude zones.
The above graph shows polar temperature anomalies from the surface (1000 mb/2 meter) of the Earth to the top regions of the atmosphere (10 mb/25 kilometers). Along the bottom of the graph, we have a list of extreme weather events. Analyzing the graph we find that major polar warming associated with extreme temperature increases at the bottom of the atmosphere all the way through to the stratosphere correlate with recently more frequent historic blizzards and nor’easters in the regions mentioned.
Polar Warming Flushing Cooler Air into the Middle Latitudes
In previous posts, I used the ground-breaking scientific research of Dr. Jennifer Francis and others as a basis to analyze how energy transfer into the polar zone in the form of heat build-up has generated these extraordinary temperature extremes. How this ramping heat is associated with polar amplification — an aspect of human-caused climate change. And how these warming events can have upstream (Jet Stream) impacts that increase storminess in the middle latitudes.


(From January [top] to February [bottom] the pole heats up and extreme weather events ensue. Image source: NASA.)
But let’s take this analysis a step further to look at, as January progressed into February, where it got warmer, where it got colder, and where the big storms fired off.
The maps above show global temperature anomalies (NASA) for January (top) and February (bottom). And looking at those maps we find that the polar region heated up significantly from already warm ranges of 4 to 6.9 degrees Celsius above average during January to an amazing 4 to 12.3 C above average during February.
As this relative polar warming increased during February, the NASA maps show that colder than normal temperatures expanded over North America through Canada and parts of the Northern U.S. even as a cold spell began to blossom in Europe. Cold pools that were fed by Arctic air shunting southward as the Polar Vortex collapsed and remnant continental troughs emerged.
NASA’s zonal anomaly measures provide further evidence for this trend.


(Major northern polar warming from January [top] to February [bottom] is clearly visible in NASA’s zonal anomalies maps. Note that despite cold air excursions into North America and Europe, most zonal regions are warmer to much warmer than average.)
For here we find that as temperatures spiked from 4.5 degrees Celsius above average in the polar region of 80 to 90 degrees north latitude during January to an amazing 11 degrees above average during February, the region of 45 to 70 N dipped from 1 to 3 C warmer than average to 0.8 to 2.5 C warmer than average.
Note that the zonal middle latitude continental cooling is moderated by both the relatively warmer oceans and by very strong ridge zones running through these regions. But that the trough regions over both Europe and North America produced locally frigid temperatures and related instances of extreme weather.
Putting all these maps together from top to bottom we find that the polar warming events coincided both with mid latitude cooling even as we saw extreme snowfall in Canada and Montana, historic cold and snowfall in Europe and the UK, record flooding in the Central U.S., and record heat along the U.S. East Coast. We also find that the developing deep trough over Canada due to the expulsion of polar air southward in turn produced the succession of instabilities that would later spawn 3 very severe nor’easters off the U.S. East Coast during March.
Of course, all of these severe weather events are happening in the context of months that are around 1 degree Celsius warmer than 1880s averages globally. That January was the fifth hottest on record and that February was the sixth hottest on record during a La Nina that, all things being equal, should cause the world to be cooler than average.
But as we can see clearly here, all things are not equal — human-caused climate change is a big spoiler.
Share this:

Posted by robertscribbler on March 15, 2018
https://robertscribbler.wordpress.com/2018/03/15/polar-warming-spawns-more-severe-winter-storms/
Major Environmental Groups Aim for 100 Percent Renewable Energy; Nature Study Shows Solar Alone is on Track Toward 50 Percent
Here we explore how models have consistently underestimated PV deployment and identify the reasons for underlying bias in models… We propose that with coordinated advances in multiple components of the energy system, PV could supply 30–50% of electricity in competitive markets. — Nature
It’s the call for the rapid conversion of energy systems around the country to 100% renewable power — a call for running the United States (and the world) on sun, wind and water. What Medicare for All is to the healthcare debate, or Fight for $15 is to the battle against inequality, 100% Renewable is to the struggle for the planet’s future. — Bill McKibben
*****
Let’s be very clear. The big first step in saving cities like Houston and regions like South Asia from this global warming nightmare we’re creating is to replace the chief cause of the problem with something else. And when the central driver of global warming is fossil fuel burning, then you can’t solve that problem by continuing to dig up fossil carbon and combust it. Full stop.
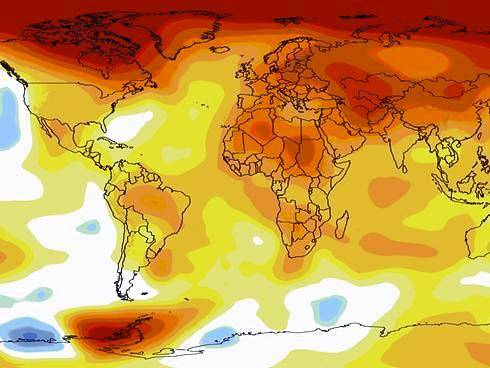
(The world is heating up, primarily due to fossil fuel burning. Rapidly replacing those fuels with renewables is crucial going forward. Image source: NASA.)
That’s why visionaries like Bill McKibben and agencies like 350.org and the Sierra Club are now engaged in a campaign to promote 100 percent renewable energy policies at every level of government. Under such policies, an increasing number of these governments and institutions commit to using only renewable energy. And they do so within a prescribed timeframe.
It’s a policy aimed at solving the climate crisis while saving the stakeholders themselves. At not continuing along a path toward worse disasters than Harvey and ultimately lethal climates like those of the Permian. At not putting stakeholder cities, states and industries at ever increasing risk. Ultimately, it’s aimed at combating the central cause of global warming — fossil fuels — by leveraging the superior economics of wind and solar to crowd them out. A goal that’s enabled by the fundamental economic superiority of renewables. And the timing couldn’t be better.
For renewable energy, in the form of wind and solar, is now less expensive in most applications than gas and coal. And the price is continuing to drop. This means that the economic argument for fossil fuels has fewer and fewer legs to stand on. Arguments attacking renewables increasingly rely on either baseless and false inflations of environmental damage, or on a downplaying of renewable energy’s economic strength and potential future capacity — attempting to divide and conquer environmentalists by creating inaccurate impressions or to tamp down enthusiasm among renewable energy supporters. Such anti-factual messaging, however, reveals the present economic, political and social vulnerabilities of fossil fuel interests as they are forced more and more to rely on outright deception.
Now, as with climate change, the fossil fuel special interests are facing off against a rising tide of scientific evidence. This time, the science isn’t just revealing the causes of environmental harm in the form of fossil fuel burning — it is showing why renewable energy’s growth rate will be faster and more transformative than expected.
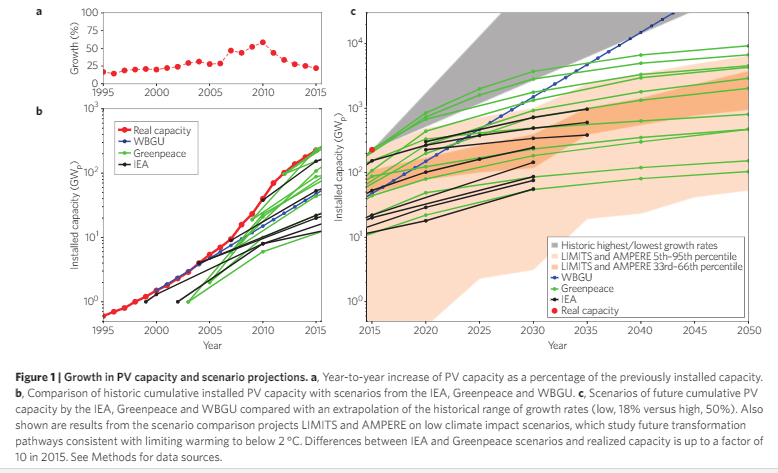
(Environmental organizations like Greenpeace have provided the most optimistic and accurate assessments of solar growth rates — flummoxing most energy industry experts. Image source: Nature.)
A new study in Nature this week found that solar energy alone would represent up to 50 percent of global electricity generation capacity by 2050 on the basis of its economic strength alone. Solar benefits from a simplicity of design, use of common materials, easy scalability, a proven track record of increasing efficiency over time, and the ability to easily loop in technological design breakthroughs. These advantages have allowed solar to reduce its price by 22 percent for each doubling of installed capacity.
Wind benefits from similar economies of scale. And a new study out from the National Renewable Energy Lab found that the price of wind would fall by another 50 percent through 2030. Estimates that are up from 30 percent even earlier this year. A pretty amazing ability considering the fact that wind is already the lowest cost energy source in many applications.
This economic strength really gives environmental advocacy groups an effective tool for achieving goals going forward. Now, a zero emitting technology that produces orders of magnitude less harm than present energy systems is within reach. Now cities, states and nations can change the world for the better. And now they can do it on the cheap. But not only does this thrust jibe with traditional environmental goals — it appeals to the 72 percent of republicans who support renewable energy, regardless of their views on climate change. In this way, the 100 percent renewable campaign is one that appeals to all Americans and can therefore gain ground in pretty much every state and region.
RELATED STATEMENTS AND INFORMATION:
Links:
The Underestimated Potential of Solar Energy to Mitigate Climate Change
Wind Power Costs Could Drop 50 Percent. Solar PV Could Provide up to 50 Percent Global Power. Damn.
Innovation Can Reduce Wind Energy Costs by Another 50 Percent Through 2030
Bill McKibben Kicks Off Keep it 100 Campaign
Share this:

Posted by robertscribbler on September 1, 2017
https://robertscribbler.wordpress.com/2017/09/01/major-environmental-groups-aim-for-100-percent-renewable-energy-nature-study-shows-solar-alone-is-on-track-toward-50-percent/
Beyond the Point of No Return — Imminent Carbon Feedbacks Just Made the Stakes for Global Warming a Hell of a Lot Higher
“It’s fair to say we have passed the point of no return on global warming and we can’t reverse the effects, but certainly we can dampen them,” said biodiversity expert Dr. Thomas Crowther.
“I’m an optimist and still believe that it is not too late, but we urgently need to develop a global economy driven by sustainable energy sources and start using CO2, as a substrate, instead of a waste product.” — Prof Ivan Janssens, recognized as a godfather of the global ecology field.
“…we are at the most dangerous moment in the development of humanity. We now have the technology to destroy the planet on which we live, but have not yet developed the ability to escape it… we only have one planet, and we need to work together to protect it.” — Professor Stephen Hawking yesterday in The Guardian.
*****
The pathway for preventing catastrophic climate change just got a whole hell of a lot narrower.
For according to new, conservative estimates in a scientific study led by Dr. Thomas Crowther, increasing soil respiration alone is about to add between 0.45 and 0.71 parts per million of CO2 to the atmosphere every year between now and 2050.
(Thomas Crowther explains why rapidly reducing human greenhouse gas emissions is so important. Namely, you want to do everything you can to avoid a runaway into a hothouse environment that essentially occurs over just one Century. Video source: Netherlands Institute of Ecology.)
What this means is that even if all of human fossil fuel emissions stop, the Earth environment, from this single source, will generate about the same carbon emission as all of the world’s fossil fuel industry did during the middle of the 20th Century. And that, if human emissions do not stop, then the pace of global warming of the oceans, ice sheets, and atmosphere is set to accelerate in a runaway warming event over the next 85 years.
Global Warming Activates Soil Respiration Which Produces More CO2
This happens because as the world warms, carbon is baked out of previously inactive soils through a process known as respiration. As a basic explanation, micro-organisms called heterotrophs consume carbon in the soil and produce carbon dioxide as a bi-product. Warmth is required to fuel this process. And large sections of the world that were previously too cold to support large scale respiration and CO2 production by heterotrophs and other organisms are now warming up. The result is that places like Siberian Russia, Northern Europe, Canada, and Alaska are about to contribute a whole hell of a lot more CO2 (and methane) to the atmosphere than they did during the 20th Century.
When initial warming caused by fossil fuel burning pumps more carbon out of the global environment, we call this an amplifying feedback. It’s a critical climate tipping point when the global carbon system in the natural environment starts to run away from us.
Sadly, soil respiration is just one potential feedback mechanism that can produce added greenhouse gasses as the Earth warms. Warming oceans take in less carbon and are capable of producing their own carbon sources as they acidify and as methane seeps proliferate. Forests that burn due to heat and drought produce their own carbon sources. But increasing soil respiration, which has also been called the compost bomb, represents what is probably one of the most immediate and likely large sources of carbon feedback.

(A new study finds that warming of 1 to 2 C by 2050 will increase soil respiration. The result is that between 30 and 55 billion tons of additional CO2 is likely to hit the Earth’s atmosphere over the next 35 years. Image source: Nature.)
And it is also worth noting that the study categorizes its own findings as conservative estimates. That the world could, as an outside risk, see as much as four times the amount of carbon feedback (or as much as 2.7 ppm of CO2 per year) coming from soil if respiration is more efficient and wide-ranging than expected. If a larger portion of the surface soil carbon in newly warmed regions becomes a part of the climate system as microbes activate.
Amplifying Feedbacks Starting to Happen Now
The study notes that it is most likely that about 0.45 parts per million of CO2 per year will be leached from mostly northern soils from the period of 2016 to 2050 under 1 C worth of global warming during the period. To this point, it’s worth noting that the world has already warmed by more than 1 C above preindustrial levels. So this amount of carbon feedback can already be considered locked in. The study finds that if the world continues to warm to 2 C by 2050 — which is likely to happen — then an average of around 0.71 parts per million of CO2 will be leached out of soils by respiration every year through 2050.

(When soils lose carbon, it ends up in the atmosphere. According to a new study, soils around the world are starting to pump carbon dioxide into the atmosphere. This is caused by increased soil respiration as the Earth warms. Over the next 35 years, the amount of carbon dioxide being pumped out by the world’s soils is expected to dramatically increase. How much is determined by how warm the world becomes over the next 35 years. Image source: Nature.)
The upshot of this study is that amplifying carbon feedbacks from the Earth environment are probably starting to happen on a large scale now. And we may be seeing some evidence for this effect during 2016 as rates of atmospheric carbon dioxide accumulation are hitting above 3 parts per million per year for the second year in a row even as global rates of human emissions plateaued.
Beyond the Point of No Return
What this means is that the stakes for cutting human carbon emissions to zero as swiftly as possible just got a whole hell of a lot higher. If we fail to do this, we will easily be on track for 5-7 C or worse warming by the end of this Century. And this level of warming happening so soon and over so short a timeframe is an event that few, if any, current human civilizations are likely to survive. Furthermore, if we are to avoid terribly harmful warming over longer periods, we must not only rapidly transition to renewable energy sources. We must also somehow learn to pull carbon, on net, out of the atmosphere in rather high volumes.
Today, Professor Ivan Janssens of the University of Antwerp noted:
“This study is very important, because the response of soil carbon stocks to the ongoing warming, is one of the largest sources of uncertainty in our climate models. I’m an optimist and still believe that it is not too late, but we urgently need to develop a global economy driven by sustainable energy sources and start using CO2, as a substrate, instead of a waste product. If this happens by 2050, then we can avoid warming above 2C. If not, we will reach a point of no return and will probably exceed 5C.”
In other words, even the optimists at this time think that we are on the cusp of runaway catastrophic global warming. That the time to urgently act is now.
Links:
Quantifying Soil Carbon Losses in Response to Warming
Netherlands Institute of Ecology
Earth Warming to Climate Tipping Point
This is the Most Dangerous Time for Our Planet
Climate Change Escalating So Fast it is Beyond the Point of No Return
Hat tip to TodaysGuestIs
Hat tip to Cate
Hat tip to Colorado Bob
Hat tip to Wili
Share this:

Posted by robertscribbler on December 2, 2016
https://robertscribbler.wordpress.com/2016/12/02/beyond-the-point-of-no-return-imminent-carbon-feedbacks-just-made-the-stakes-for-global-warming-a-hell-of-a-lot-higher/
New Study: Climate Change Has Doubled the Number of Category 4 and 5 Storms Striking East and Southeast Asia
The atmospheric-ocean heat engine. It’s a pretty simple mechanism for pumping up the power of storms. But as simple as it is, the results can be devastating when this engine gets revved up by human-forced climate change, according to a new study released Monday in Nature Geoscience.
The Heat Engine in Action
As the ocean surface warms, it heats the local atmosphere. This generates an updraft that pushes higher and higher into the air above. Heat also causes water at the ocean surface to evaporate. This evaporated water is borne up on the winds and air currents rising above the heating water. A low-pressure system forms and the water vapor condenses into clouds which ultimately become thunderstorms. The Coriolis effect gives it all a nudge and the storms and clouds start to spin…

(Pacific Ocean typhoon paths from 1980 through 2005. A new study shows that the destructive power of landfalling typhoons in East and Southeast Asia has increased by nearly 50 percent since 1977. Meanwhile, the number of category 4 and 5 storms striking land has doubled. All impacts due to ocean-surface warming related to human-caused climate change. Image source: Commons.)
The process described above happens every day at the ocean surface. Sometimes these storms form into the powerful cyclones we call hurricanes and typhoons. Under normal global temperature conditions, the kinds and intensities of these storms are what we have generally come to expect. But if you add heat to the Earth System, as we do when we burn fossil fuels and dump carbon into the atmosphere, the whole storm formation process gets amped up — and produces the powerful outlier storms that have become more common over recent years.
Add Human-Forced Warming and End up With More Powerful Storms
The fact that such added heat tends to generate more powerful storms has been a generally accepted part of our understanding of climate science for some time now. However, it was not until recently that this signal of rising storm intensity became visible in the science. Now, a new study published today in Nature Geoscience indicates that’s exactly what’s happening in parts of the Western Pacific.
It’s a pretty earth-shattering revelation with multiple climate change-related findings which are worth reading about in full here. These findings boil down to the following:
- The number of category 4 and 5 storms striking southeast Asia has doubled since 1977.
- The overall destructive power of storms striking this region has increased by nearly 50 percent over the same period.
- This increase in powerful storms has been caused by ocean warming related to climate change.
Standing alone, any one of these findings would be significant. Taken together, they paint a picture of significantly rising risk of storm damage and related loss of life due to climate change in one of the world’s most highly populated regions. In other words, the storms firing and running in to land in this region are not the same as they once were. They have been dramatically altered by the massive volume of greenhouse gasses hitting the world’s atmosphere due to fossil-fuel burning, accumulating over the decades.
The study notes that:
Here, we apply analysis to corrected data and show that, over the past 37 years, typhoons that strike East and Southeast Asia have intensified by 12 to 15 percent… a nearly 50 percent increase in instantaneous destructiveness… with the proportion of category 4 and 5 storms doubling or even tripling… We find that increasing intensity of landfalling typhoons is due to strengthened intensification rates which are, in turn, tied to locally enhanced surface warming on the rim of East and Southeast Asia.
Ramping Storm Intensity
This scientific study helps validate and clarify what many weather and climate observers have already noted during recent years. The destructiveness of storms striking land in East and Southeast Asia is not normal. And, land-falling category 4 and 5 storms are occurring with greater frequency over broader regions.
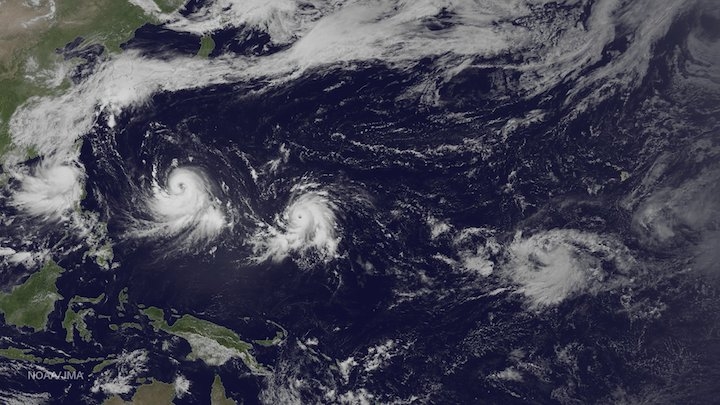
(Four Pacific typhoons take aim on Southeast Asia during July of 2015. A new study finds that the landfall intensity of storms like these is increasing due to human-caused climate change. Image source: NOAA.)
The Western Pacific basin is now capable of producing storms like Haiyan, whose destructive intensity at landfall was mostly theoretical decades before. This increase in intensity has been observed during a period of rapid Earth warming. And with more warming in store, the storms are likely to grow even more intense. From the Nature Geoscience study:
The projected ocean surface warming pattern under increased greenhouse gas forcing suggests that typhoons striking eastern mainland China, Taiwan, Korea, and Japan will intensify further. Given disproportionate damages by intense typhoons, this represents a heightened threat to people and properties in the region.
Links:
Intensification of landfalling typhoons over the northwest Pacific since the late 1970s, Wei, M. and Xie, S.
Asian typhoons becoming more intense, study finds
Share this:

Posted by robertscribbler on September 6, 2016
https://robertscribbler.wordpress.com/2016/09/06/new-study-climate-change-has-doubled-the-number-of-category-4-and-5-storms-striking-east-and-southeast-asia/
Ten Times Faster Than a Hothouse Extinction — Human Carbon Emission is Worst in at Least 66 Million Years
“If you look over the entire … last 66 million years, the only event that we know of … that has a massive carbon release and happens over a relatively short period of time is the PETM. We actually have to go back to relatively old periods. Because in the more recent past, we don’t see anything [even remotely] comparable to what humans are currently doing.” Richard Zeebe of the University of Hawaii in a recent paper published in Nature.
*****

(Annual human carbon emissions are about 150 times that of all the volcanoes on the Earth, 10 times faster than a hothouse extinction that occurred 55.8 million years ago. Image source: La Rosa Rossa.)
Let’s be very clear. The human fossil fuel emission is outrageous and unprecedented on geological timescales. An insult the Earth has likely never seen before. For the pace at which we are emitting carbon into the atmosphere is just flat out insane. We’ve known this for some time because the best of science can’t find any time in all of Earth’s geological history that produces a rate of atmospheric carbon accumulation equal to the one that’s happening now.
However, a new study recently published in Nature now sheds more light on this rather difficult and scary topic. But in order to find an event that is even remotely comparable to the current human greenhouse gas emission, scientists had to look far back into deep time. All the way back through a period when the last of the Dinosaurs were dying off about 55-66 million years ago.
During this time we find evidence of the most recent Hothouse Mass Extinction Event in the geological record. We call this event the Paleocene-Eocene Thermal Maximum or PETM because it’s an extreme period of rapid warming that occurred at the boundary between these two periods of Earth History about 55.8 million years ago.
The PETM Hothouse Extinction
The PETM was pretty amazingly bad. It set off a mass extinction in the oceans which wiped out half of all shellfish through the varied impacts of anoxia, acidification and coral bleaching. Its heat forcing was enough to completely reverse ocean circulation and set up a stratified ocean state. Peatlands and forests went up in mass conflagrations. Terrible insect plagues swept the globe. The related extreme surface temperatures forced a mass poleward migration and widespread genetic alteration of mammals which were eventually reduced to dwarfism.

(Earlier studies estimated PETM emissions rates in the range of 1.7 billion tons of carbon per year. A new Nature study finds PETM emissions to be even lower at 1.1 billion tons of carbon per year. This compares to a current human emission of 10 billion tons of carbon per year. A rate of emission that could jump to as high as 25 billion tons of carbon per year by mid Century unless fossil fuel use is curtailed. It’s worth noting that the ‘slow but steady’ PETM emissions above represent one of the most rapid periods of warming in Earth’s geological history. Image source: Climate Crocks.)
It was a rough and wrenching time of change and difficulty for pretty much all of life on Earth. But what the new study finds and confirms is that the rate of atmospheric carbon accumulation during that extinction period, though enough to cause seriously dramatic climate shifts, was much, much slower than what we see now.
A Human Hothouse Extinction Would be Far Worse
On average, over the PETM extinction event, rates of atmospheric carbon accumulation were found to be in the range of about 1.1 billion tons per year. By comparison, human carbon emissions during 2014 were about ten times this level at around 10 billion tons of hothouse gas hitting the atmosphere. As such, the new study finds that the velocity of the human carbon emission exceeds that of the Paleocene-Eocene hothouse extinction event by an order of magnitude (x10).
Study authors found that the large carbon emission occurred over the course of about 4,000 years. This spike in atmospheric carbon coincided with an approximate 5 degree Celsius spike in global temperatures in the 4,000 to 12,000 year time period. This implies a rate of warming of at most around 0.12 degrees Celsius every 100 years (or as little as 0.04 degrees Celsius per Century). Other estimates put the rate of PETM warming at around 0.025 C per Century. Expected human warming between 1 and 5 degrees Celsius this Century is therefore about 10 to more than 200 times faster than during the PETM extinction event given the best available current scientific evidence.
Such high rates of atmospheric carbon accumulation and related global heating risk generating an event that is outside of any geological context that scientists might use to predict the human warming event’s severity.
“It means we don’t have a really good analog in the past for the massive amount of carbon we’re releasing,” Zeebe said to National Geographic. “Even if we look at the PETM and say the transition to a warmer climate may have been relatively smooth, there’s no guarantee for the future.”
In other words, if you’re adding carbon to the atmosphere at a rate ten times faster than during one of the most remarkable warming events in Earth’s History, then the pace of wrenching geophysical changes and the extinction pressure on organisms is going to be far, far greater. Something that is certainly worse than the PETM and that may even exceed the terrible losses seen during the Permian Mass Extinction if we don’t get a handle on our fossil fuel emissions soon.
Links:
Anthropogenic Carbon Release Unprecedented in Last 66 Million Years
Earth Hasn’t Heated Up This Fast Since the Dinosaurs’ End
PETM — Global Warming, Naturally
Hat tip to DT Lange
Hat tip to Colorado Bob
Share this:

Posted by robertscribbler on March 22, 2016
https://robertscribbler.wordpress.com/2016/03/22/ten-times-faster-than-a-hothouse-extinction-human-carbon-emission-is-worst-in-at-least-66-million-years/
Monitor Shows Carbon Monoxide Spikes to 40,000 Parts Per Billion over California on February 26 — What the Heck is Going On?
Hint: it’s a glitch.
*****
On February 26, The Global Forecast System model recorded an (unconfirmed) intense and wide-ranging carbon monoxide (CO) spike over the US West Coast. A region stretching from British Columbia, through Washington and Oregon, and on over most of California experienced CO readings ranging from about 5,000 parts per billion over the mountains of Southwestern Canada to as high as 40,000 parts per billion over Southern California. Very high peak readings appear to have occurred from Northern California near Eureka and along a line south and eastward over much of Central California to an extreme peak zone just north and west of Los Angeles near Palmdale.

(Very large [unconfirmed] CO spike over Western North America near major geological features on February 26, 2016. Image source: Earth Nullschool.)
For reference, these (unconfirmed) readings in the Nullschool Monitor were between 25 and 200 times above typical background CO levels of about 200 parts per billion and up to twelve times higher than second highest peak readings over polluted regions of China during the same period.
Major Spike Appeared in Just 3 Hours Starting February 25th
Human-based carbon monoxide sources are not generally known to produce spike readings so high and so wide-ranging over such a short interval of time. It would typically take a considerable emission many days to build up under a stagnant air mass. And, to this point, we do have a couple of dome high pressure systems which have tended to form near the California region over recent days. That said, surface winds in the region at 5-15 mph over most areas could hardly be considered stagnant. In addition, the current spike appears over an interval of three hours in the Nullschool data — going from zero coverage to covering all of California and parts of Nevada, Oregon, Washington and BC over that single short interval. It’s a very brief period for such a large and wide-ranging peak reading to appear so soon. One that would require a rather extraordinary pulse of pollution to produce the readings indicated on February 25-26.
Wildfires could produce a longer-term emissions spike under stagnant air as well. However, the wildfires now reported for California are small and isolated. They have flared, off and on, under drought conditions, for weeks without resulting in any significant large fire outbreaks or related major pollution spikes. So it appears unlikely that they are the source of the current burst. Other events related to the ongoing California drought may have had an impact (apparently, burning of desiccated trees from California’s orchards is currently quite widespread due to ongoing drought conditions remaining in place since 2012). However, such instances would have to have been very sudden and wide-ranging to produce the spike we saw on the 25th and 26th. Canadian wildfires — of which there have been very small and low intensity hotspot events recently (noteworthy due to their anomalous appearance out of season, if not for their intensity) — were very far from peak readings in California and did not produce even a moderate level of emissions (undetectable from the visible MODIS sensor).
The Earthquake Precursor Hypothesis
A final suspect for this preliminary observation (which has gotten much hype in social media circles over recent days) is geological. As the apparent spike in the monitor occurs over large fault lines, volcanoes, and above other active geological features along the US and Canadian West, it appears that activity within these features might have produced a brief if intense burp of this gas. Sulfur dioxide (SO2) readings — another geological gas — were also elevated in the monitor, with peak readings again appearing in Southwestern California.
It’s worth noting that no major US or Canadian geological organization has yet made any report on this particularly large CO spike. However, a piece of scientific research in Nature Asia, by K. S. Jayaraman notes that major CO and SO2 spikes may be an indication that future earthquake activity is on the way. According to Nature this kind of intense CO spike occurred prior to a 7.6 magnitude earthquake that shook Gujara in 2001 killing 20,000 people:
Singh said that CO levels were taken by an instrument onboard NASA’s Terra satellite — launched in 2009 — circling the earth in a polar orbit at a height of 705 km. The instrument measures CO concentrations at different heights and also computes the total amount of the gas in a vertical column of air above the earth surface.
Analysis of the satellite data showed a large peak in CO concentrations during January 19 and 20 — a week before the main earthquake event. On January 19, the total CO in the vertical column was also higher than usual. After the 26 January earthquake the concentration of the gas dropped.
According to the scientists, CO gas is forced out of the earth due to the build up of stress prior to the earthquake “influencing the hydrological regime around the epicentre.”
But before we tilt too far into alarmism on this particular possibility, we should consider the fact that the above paper appears to have had no confirmation or further comment in the sciences at this time. So the predictive usefulness of large CO spikes prior to earthquakes remains quite uncertain. And, as noted above, no major geological information outlet has made any warning or comment on earthquake risk.
Furthermore, there’s been no observed spike in earthquake activity along any of the major fault lines over the past week according to USGS observations. Contrary to what some irresponsible analysts have been implying, earthquake activity in the California region over the past 7 days was well within the normal range. At 161 over the past week, this small number is not indicative of any abnormal activity near the various active fault lines. Each year, Southern California alone experiences 10,000 earthquakes, most of which are so small that people don’t even feel them.
The US geological survey also maintains that:
There is no scientifically plausible way of predicting the occurrence of a particular earthquake. The USGS can and does make statements about earthquake rates, describing the places most likely to produce earthquakes in the long term. It is important to note that prediction, as people expect it, requires predicting the magnitude, timing, and location of the future earthquake, which is not currently possible.
Thus the apparent, current very large West Coast CO spike near major fault lines (and over regions suffering from what is now a very severe five-year drought) in this particular monitor remains a bit of a mystery.
Or is it all Just a Glitch?
Considering that all the wildfire and human potential sources for the CO pulse are unlikely to produce the spike in the Nullschool data, that we have no warning of potential impending geological activity from the major agencies, and that we have had no other reports from related agencies to confirm the spike, we should also consider that there may well be something wrong with the monitor. Artifacts can appear in the satellite model data and it’s not unheard of to get a spike reading due to other signals impacting how physical models interpret sensor data.

(Hourly carbon monoxide observations in Central San Bernardino do not match high surface CO measures recorded by the GEOS 5 model. Similar lower atmospheric readings come from station observations throughout Southern and Central California. Image source: California AMQD.)
To this point, lack of confirmation at ground reporting stations for high CO readings appearing in the GEOS 5 monitor increase the likelihood that these high peak readings were a glitch or an artifact in the physical data. A cursory view of local warnings shows no local CO air quality alerts for the areas indicated in the Nullschool data set (You can view a list of the local monitors here). Analysis of this data also shows much lower CO readings from these stations in the range of 400 to 1200 parts per billion — quite a bit lower than what the GEOS 5 monitor is showing.
So what we have is one model showing a very high CO spike, but none of the related ground monitors picking it up. Since there are hundreds of ground stations in this region, it seems quite a bit less likely that there is something wrong with each of the readings coming from these stations than from the GEOS 5 model itself.
This begs the question — was there some kind of false positive that confused GEOS 5? Was there some other signal that tripped the model to show such a high reading? But to these points, a general lack of overall confirmation from the hundreds of ground sensors scattered across the region seems to point to the likelihood that such elevated readings in the GEOS 5 monitor were a glitch, an artifact, or a false reading for this atmospheric level.
UPDATED: Final Confirmation — It’s A Model Algorithm Error
Dr. Gavin Schmidt, head of GISS NASA, has confirmed the glitch in his twitter feed which you can read here. He notes:
The Elevated Carbon Monoxide concentrations in the GEOS 5 products since February 25 of 2016 are incorrect. They are the consequence of unrealistic CO emissions computed by our biomass burning algorithm, which is based on satellite observation of fires… GMAO is working to correct this problem.
An excellent further explanation has been given by Bryan, a blogger over at Of Tech and Learning. His explanation is as follows:
“It’s pure coincidence that at MOPITT resumed data collection over western North America while its operating temperature was still stabilizing. Had the instrument’s temperature remained unstable for a few days, it would have looked like the whole globe was erupting gas. If MOPITT has started collecting data over the south pole, open ocean, or some other obscure location, I doubt anyone would have noticed and made a big fuss. MOPITT uses light collected in the infrared part of the spectrum. Based on Terra’s system status, the CO, CO2 and SO2 data collected by MOPITT on the 25th and 26th of February should be highly suspect. On the Earth map, the CO, CO2, and SO2 levels spike sometime between 1pm and 4pm Pacific time on Feb. 25th, which is between 2100 UTC on the 25th and 0000 UTC on the 26th. This is precisely during the time window when MOPITT’s operating temperature is still unstable.”
So a glitch does appear to be the cause of the current CO spike in the Nullschool data.
Links:
Dr Gavin Schmidt’s Twitter Feed
Carbon Monoxide May Signal Earthquake
An Explanation of Carbon Monoxide Concentrations on US West Coast
Hat tip to Mike
Hat tip to MlParrish
Hat tip to WeHappyFew
Hat tip to Coopgeek
Hat tip to Greg
Hat tip to Bryan
Hat tip to FishOutofWater
Hat tip to Jim Benison
Share this:

Posted by robertscribbler on February 29, 2016
https://robertscribbler.wordpress.com/2016/02/29/carbon-monoxide-spikes-to-34000-parts-per-billion-over-california-on-february-26-what-the-heck-is-going-on/
It’s All About Fresh Water — Rapid Sea Level Rise Points To Massive Glacial Melt in Antarctica
It’s all about fresh water. In this case, massive freshwater outflows from the vast glaciers covering Antarctica.
This week, a new scientific report published in the Journal Nature found that from 1992 through 2012 freshwater outflow from Antarctica’s massive glaciers exceeded 400 gigatons each year. An immense flood of cold, fresh water. One that helped push sea levels rapidly higher around the Antarctic continent.
But with glacial melt on the rise and with mountains of ice now inexorably sliding seaward, these freshwater flows may just be the start of even more powerful outbursts to come. And such prospective future events have far-ranging implications for sea level rise, global weather, sea ice, human-caused climate change, and world ocean health.
Flood of Fresh Water Drives More Sea Level Rise Than Expected
The researchers discovered the tell-tale signature of this vast freshwater flood through chemical analysis of the seas surrounding Antarctica. The analysis pointed to a broad and expanding fresh water layer over-riding a warmer, saltier current issuing in from the Southern Ocean.
Since fresh water is less dense than salt water, the freshwater layer expands at the ocean surface causing sea levels to rise more rapidly. Meanwhile, the heating of the deep ocean surrounding Antarctica is thought to result in additional thermal expansion of the water column.
The researchers note:
On the basis of the model simulations, we conclude that this sea-level rise is almost entirely related to steric adjustment [changes that effect atomic spacing], rather than changes in local ocean mass, with a halosteric [salt based] rise in the upper ocean and thermosteric [heat based] contributions at depth. We estimate that an excess freshwater input of 430 ± 230 Gt yr−1 is required to explain the observed sea-level rise. We conclude that accelerating discharge from the Antarctic Ice Sheet has had a pronounced and widespread impact on the adjacent subpolar seas over the past two decades.

(Rate of sea level rise in the seas surrounding Antarctica since 1992. Aggregate sea level rise is indicated in black. Individual seas data is broken out by color. Image source: Nature.)
Previously, increased rates of sea level rise surrounding Antarctica were thought to have been set off by increasing winds around the continent. The winds were thought to push more water up against the ice faces forming a kind of perpetual, low-grade storm surge. But the current finding provides strong evidence that the source of the sea level rise is due to less dense fresh water over-topping saltier waters flowing in from the Southern Ocean combined with increasing heat along the Antarctic sea bed. And, notably, this is not the first study to find increasing freshwater flows spilling into the Southern Ocean. Last year, a KNMI expedition uncovered similar results.
More Evidence of Large-Scale Melt
The study comes on the back of other recent findings showing that warm water invasion at Antarctic glacier bases had led to more rapid than expected melt and destabilization. In May, two NASA studies showed that a broad section of West Antarctica had destabilized and was sliding at an ever more rapid pace toward the ocean (see reports here and here). These findings held stark implications for global sea level rise as large ice regions of Greenland and West Antarctica, containing enough water to raise seas at least 15 feet, are likely already in a state of irreversible collapse.

(Sea level rise anomaly of the region surrounding Antarctica compared with the rest of the Southern Ocean. Red indicates faster than normal sea level rise. Blue indicates slower than normal sea level rise. Image source: Nature.)
This intensifying glacial melt and associated freshwater cap expanding out from the pole has implications — not just for sea level rise, but for sea ice, weather, and world ocean system health.
Impacts For Sea Ice
Large outflows of glacial fresh water may well be involved in the recent observed expansion of sea ice in the zone surrounding Antarctica (see recent related study). Fresh water serves as an insulative cap on the ocean surface preventing warm water from entering the top layer from below. The warm, salty water, in the Antarctic instead pools near the bottom or at the base of the great ice sheets.
Fresh water also freezes at a higher temperature than salt water. So sea ice in an expanding freshwater zone around Antarctica would have naturally higher resiliency even to the rising temperatures now occurring due to human-caused warming. Eventually, however, human heat forcing would overwhelm the ice, but not before a period of related, localized negative feedbacks.
The Iceberg Cooling Effect
The fresh water is a haven for sunlight-reflecting sea ice. It is interspersed with ice bergs from the glacial discharge and the large ice bergs cool the surrounding air. The fresh water layer prevents warm water upwelling from the warm, deep waters surrounding Antarctica. And the leading edge of the fresh water would drive salt-water down-welling along its advancing front. This would push warmer waters toward the ocean bottom, resulting in a kind of heat sink. And this is exactly the kind of dynamic that appears to be ongoing in the Southern Ocean now. These combined impacts are what is known as the ice berg cooling effect associated with large-scale glacial outbursts known as Heinrich Events. And we may well be in the process of setting off one of these geological scale nightmares.

(Iceberg cooling effect under a mid-range warming scenario when global climate models were set to include the effects of large freshwater outflows from polar glaciers at a fast enough rate to raise seas by 60 cm through 2060 and 144 cm through 2080 [left frames]. Note the cooler zones in the Southern Ocean and North Atlantic adjacent to Greenland. Right frames include mid range emissions/warming scenarios and IPCC projected rates of sea level rise. It is worth noting that the amplifying effects of potential additional ghg release from the global climate system, particularly from Arctic and world ocean carbon stores, are not included in these simulations. Image source: Hansen and Sato.)
For global weather, such events have major implications. Regional cooling in the zone of freshwater outflow would juxtapose regional warming in the southern hemisphere meridional zones. This temperature differential would increase with the strength of the fresh water outflow and the rising intensity of the human-driven warming. The result would be a powerfully intensified storm track. Both the intensified storm track and increased atmospheric moisture loading due to human warming would result in much more powerful weather events than we are currently used to and the potential for catastrophic storms would drastically increase.
Amplifying Feedbacks and a Blow to World Ocean Health
Lastly, the expanding flood of fresh water would result in an increasing stratification of the world ocean system. This stratification would drive warm, salty water toward the ocean bottom and deplete already low oxygen reserves in that region. In addition, the extra heat is more likely to destabilize deep-sea clathrates — releasing methane which will speed in the oxygen depletion of the abyssal waters even as it tips the world ocean system to stop storing carbon and to begin releasing it. A combined feedback that is both an ocean killer and an amplifier to the already extraordinarily powerful human heat forcing mechanism.
Links:
Rapid Sea Level Rise Along Antarctic Margins Due to Increasing Glacial Discharge
Important Role For Ocean Warming and Enhanced Ice Shelf Melt in Sea Ice Expansion
Update on Greenland Ice Sheet Mass Loss: Exponential?
Grim News From NASA: West Antarctica’s Entire Flank is Collapsing
Share this:

Posted by robertscribbler on September 3, 2014
https://robertscribbler.wordpress.com/2014/09/03/its-all-about-fresh-water-rapid-sea-level-rise-points-to-massive-glacial-melt-in-antarctica/
Scientists: Warming Ocean, Upwelling to Make an End to Antarctica’s Vast Pine Island Glacier

(Southern Ocean interface with Pine Island Glacier as seen during the second week of January, 2014. Note the ocean has already invaded substantially land-ward pushing the glacial coastline back by between seven and ten miles. Image source: Lance-Modis)
Among Antarctica’s most vulnerable ice shelves, the Pine Island Glacier (PIG) is a massive feature. It rests on sloped terrain that is mostly below sea level even as it spills out into the southern ocean through a nearby bay, calving great icebergs that then slowly ride out, like floating ice faerie castles, into the stormy seas. In total, the shelf covers 160,000 square miles, an area two thirds the size of Great Britain.
The Pine Island Glacier is vulnerable for many reasons. It rests on sloped land that tilts it toward the warming seas. Much of it rests below sea level, making its underbelly open to the assaults of the upwelling currents of a rapidly warming ocean. As portions of the under-structure melt, the glacier becomes buoyant, floating on surface waters subject to waves, winds and currents which adds further stress to inland structures.
A few anchors held the great glacier in place over the millenia. The great pressure of ice pushing down shoved the glacier deep into the underlying Earth, for the most part, sticking it in place as it only slowly ground toward the sea.
But now these anchoring features are disintegrating, the warming waters rushing in from underneath, lubricating the ice bottom. The slope, the gravity, the long tongues of ice entering the ocean are all coming into play. The great ice sheet is in motion. A motion that scientists now conclude will not stop until the entire glacier collapses into the heating waters.
Rumors of Glacial Demise
That the Pine Island Glacier was one of Antarctica’s most sensitive to human warming has long been well known to scientists. The geographic features surrounding the glacier, the relatively high angle of slope tipping the glacier toward the ocean, and the large section of the ice shelf below sea level all attracted interest, questions and research.
By the mid 1990s, records of massive melt coming from the Pine Island Glacier began, with upwards of 10 cubic kilometers of ice observed to be lost each year. With ice loss rates continuing to increase, more efforts focused on determining the glacier’s ultimate fate. By the mid to late 2000s, average net ice loss rates were over 20 cubic kilometers per year.

(The July 2013 calving of the Pine Island Glacier as shown in a Lance-Modis satellite shot.)
At about the same time, in 2001, 2007, and 2013, three great icebergs calved off of Pine Island. These were massive bergs, averaging over 2000 square kilometers in size. Though large iceberg calving from the Pine Island Glacier was historically typical, the size and frequency of these amazing events were enough to raise eyebrows and add to already rampant speculation that the Glacier may well be headed toward an inexorable collapse.
Ocean’s Impact on Basal Melt Discovered
By 2010, studies were beginning to come in showing that the Pine Island Glacier was experiencing a rapid melt from underneath. Warming deep ocean currents were upwelling from the Amundsen Sea to erode the glacier’s base. Ice loss from this basal melt was estimated to be even greater than that observed through the increasingly rapid motion of the glacier and related large ocean calving events.

(Image source: Nature)
Basal melt was also shown to be undermining the glacier, pushing deeper and deeper beneath the ice shelf and driving ocean water further into the continent. The mechanism for this increased basal melt came directly from a human warming of the deep ocean surrounding Antarctica. Accelerated deep ocean warming was coming more and more into play as human atmospheric heating transferred through the ocean surface and into the depths.
In the Antarctic, a massive pool of warm water developed in the depths surrounding the continent. The warmer water gathered beneath a fresher, colder layer that kept a lid on the warmth, forcing it toward the bottom. But near the continents, the dynamics of ocean currents and coastal mixing brought this warm water up to contact the coast and, in this case, the base of the Pine Island Glacier.
A Nature Geoscience study led by Dr. Adrian Jenkins found progressive basal melt due to the action and heat transfer of this warm, upwelling water (see image above). The evidence collected seemed grim. It appeared that the Pine Island Glacier may well be in the first stages of disintegration. But more comprehensive study was needed before conclusions could be drawn.
Prognosis: Irreversible Collapse
By 2013, enough information had been collected to start making model runs to determine the ice sheet’s ultimate fate. And, recently, three teams of scientists took up the task. The results of these model runs were stark. They showed that, no matter what, Pine Island’s Glacier was probably suffering from the early stages of an irreversible collapse.

(Glacial velocity map of Antarctica. Note the very high velocity of the Pine Island and adjacent Thwaites glaciers. Image source: Antarctic Glaciers)
In the new Nature study entitled “Retreat of Pine Island Glacier Controlled by Marine Ice Sheet Instability” the authors applying these models found that the glacier had “been kicked and it’s just going to keep on rolling for the foreseeable future.”
Dr Hilmar Gudmundsson, one of the study’s authors in a recent interview with BBC noted:
“Even if you were to reduce melt rates, you would not stop the retreat. We did a number of model runs where we allowed PIG to retreat some distance back, and then we lowered the melt rates in our models. And despite doing that, the grounding line continued to retreat. You can talk about external forcing factors, such climate and ocean effects, and then there are internal factors which are the flow dynamics. What we find is that the internal dynamics of flow are such that the retreat is now self-sustaining.”
In other words, even if the climate somehow miraculously cooled or if the warming ocean somehow managed to melt less ice at the base of the Pine Island Glacier, the glacier would still ultimately destabilize and collapse.
This is hard news, as it has implications for the rest of West Antarctica and, ultimately, about 25 feet worth of sea level rise now locked in the ice. As noted above, the Pine Island Glacier is a massive section of West Antarctica. It is responsible for the draining of about 20% of this section of the continent’s Ice and is one of the primary barriers preventing rapid sea level rise. It is the first domino to start falling. But other dominoes sit in series behind it.
The beginning of PIG’s catastrophic collapse will also likely have major implications for Antarctica’s net ice loss. Gudmundsson’s group found that average melt rates from the Pine Island Glacier are expected to more than quadruple over the next 20 years, increasing to over 100 cubic kilometers of ice loss each year. Total sea level contribution from the Pine Island Glacier alone could be as much as 10 millimeters over the same period, according to model assessments.
This is a large contribution from just one ice sheet. A contribution that is not yet accounted for in global climate simulations for sea level rise. And we have yet to take into account potential additions from other Antarctic melt sources like the adjacent Thwaites glacier or the large glaciers that drain into the Ross Ice Shelf.
In short, if Pine Island has reached the point of no return, then the rest of West Antarctica may well be soon to follow.
Links:
Retreat of Pine Island Glacier Controlled by Marine Ice Sheet Instability
Observations Beneath Pine Island Glacier in West Antarctica and Implications for its Retreat
Pine Island Glacier Retreat “Irreversible”
Ocean Warming Shown to Melt Ice Sheets From Below
Share this:

Posted by robertscribbler on January 15, 2014
https://robertscribbler.wordpress.com/2014/01/15/scientists-warming-ocean-upwelling-to-make-an-end-to-antarcticas-vast-pine-island-glacier/
Through The Looking Glass of The Great Dying: New Study Finds Ocean Stratification Proceeded Rapidly Over Past 150 Years
During the terrible mass extinction event at the Permian-Triassic boundary about 250 million years ago nearly all life on Earth was snuffed out. The event, which geologists have dubbed “The Great Dying,” occurred during a period of rapid warming on the tail end of a long period of glaciation (see A Deadly Climb From Glaciation to Hothouse: Why the Permian-Triassic Extinction is Pertinent to Human Warming). According to reports by Dr. Peter Ward, a prominent geologist specializing in causes of previous mass extinctions, the Permian extinction was composed of three smaller extinction events occurring over the course of about 50,000 to 80,000 years which together wiped out 96% of all marine species and 70% of all land species. Ward’s book “Under a Green Sky,” in my view, together with Hansen’s seminal “Storms of My Grandchildren” provide an excellent if terrible rough allegory of the climate beast we seem to be in the process of awakening.

(NCAR A2 model run shows global surface temperatures near those last seen during the PETM and Permian/Triassic extinction events by 2090 under a middle-range fossil fuel emissions scenario. A2 does include some added emissions via amplifying feedbacks from massive polar methane or CO2 stores along with other Earth Systems feedbacks. It is worth nothing that the P/T extinction occurred at the end of a glacial period while the PETM did not and was notably less pronounced. It also worth noting that global average temperatures are currently about .2 C above those seen in the 1990s.)
As noted above, Ward’s work focused on causes and what he found at numerous dig sites around the world was evidence of a ‘Great Dying’ that began at the ocean floor, proceeded upward from the depths, and eventually came to transcend the ocean boundary and inflict a similar, if less pronounced, lethality upon terrestrial organisms. The mechanism Ward proposed for the worst extinction in Earth’s geological memory involved how oceans and, in particular, living creatures in the oceans, respond to rapid warming. Ward found that during periods of high heat called hothouse states, oceans first became anoxic and stratified and then, during the worst events, transitioned to a deadly primordial state called a Canfield Ocean.
A stratified ocean is one in which the layers become inverted and do not mix. Warm water is avected toward the ocean bottom and a cooler layer on top keeps that warm layer in place. The warmer water beneath is oxygen poor and this results in more anaerobic microbes living in the deep ocean. Overall, global ocean warming also contributes to an anoxic state. Many of these microbes produce toxins that are deadly to oxygen dependent organisms. As they multiplied, the combined low oxygen/high toxicity environment created a layer of death that slowly rose up through the world ocean system.
The primary lethal agent Ward proposed for this action was hydrogen sulfide gas. This deadly gas, which has an effect similar to that of cyanide gas, is produced in prodigious quantities by an anaerobic bacteria whose remnants lurk in the world’s deep oceans. In lower quantities they turn the water pink or purple, in greater quantities — black. Oxygen is toxic to these primordial bacteria. And so, in the mixed oceans of the Holocene all the way back to the PETM boundary layer, these little monsters were kept in check by a relatively high oxygen content. But start to shut down ocean mixing, start to make the oceans more stratified and less oxygen rich and you begin to let these dragons of our past out of their ancient cages. And once they get on the move, these creatures of Earth’s deep history can do extreme and severe harm.
Ward hypothesized that these ancient organisms and the gas they produced eventually came to fill the oceans and then spill out into the atmosphere.
An anoxic, stratified ocean full of anaerobic organisms and out-gassing hydrogen sulfide to the atmosphere is a primordial sea state known as a Canfield Ocean. And Ward found that such hot, toxic waters were the lethal agent that most likely snuffed out nearly all life 250 million years ago.
A Climate Hockey Stick for the World Ocean System: Oceans Show Marked and Rapid Stratification Over the Past 150 Years
Peter Ward’s tone was nothing if not fearful in his book ‘Under a Green Sky.’ He wrote with the wisdom of a man who has come face to face with terrible limits time and time again. He wrote with the wisdom of a man shocked by some of the hardest truths of our world. He also made a plea — could scientists and experts of different fields please work together to give humanity a better measure of the risks he saw to be plainly visible.
Chief among these risks, according to Ward, included a rapidly warming planet. Ward found that both extreme high heat conditions as well as a relatively rapid pace of warming, in geological terms, increased the speed of transition to stratified ocean and Canfield Ocean states. Ward acknowledged that high rates of water runoff from continents likely contributed to anoxia. Recent studies have also indicated that rapid glacial melt combined with rapid global heating may contribute to a an increasingly stratified and anoxic ocean system.
Now, a new study of deep ocean corals entitled Increasing subtropical North Pacific Ocean nitrogen fixation since the Little Ice Age and conducted by researchers at the University of Santa Cruz and published in Nature has discovered proxy evidence that ocean stratification over the past 150 years advanced at the most rapid pace in at least the last 12,000 years. The study analyzed the sediment composition of coral growth layers to determine changes in ocean states since the 1850s. As the corals sucked up the dead bodies of micro-organisms over the past 1,000 years, the researchers were able to analyze what was happening to the cyanobacteria at the base of the food web.
What they found was that the bacteria increased their rate of nitrogen fixation by about 17 to 27 percent over the past 150 year period. And that this pace of change was ten times more rapid than that observed at the end of the Pliestocene and beginning of the Holocene 12,000 years ago.

(The Ocean’s Hockey Stick? Nitrogen Proxy Levels and Their Relationship to Climate Change.)
Increasing nitrogen fixation is an indicator of ocean stratification because cyanobacteria species under stress evolve to fix higher amounts of nitrogen from the surface transfer boundary with the air if particulate nitrogen levels in their environment drop. In a healthy, mixed ocean environment, nitrogen from various sources (terrestrial, run-off, etc), is readily traded between ocean layers due to the mixing action of ocean currents. In cooler oceans, more nitrogen is also held in suspension. But as oceans become warmer and more stratified, a loss of mixing and solubility results in lower nitrogen levels.
The researchers believe that this increase in nitrogen fixation is a clear indication that the region of the Pacific they observed is rapidly becoming more stratified and that this rate of increase is probably an order of magnitude faster than what occurred during the last major transition at the end of the last ice age.
“In comparison to other transitions in the paleoceanographic record, it’s gigantic,” Lead author Sherwood noted. “It’s comparable to the change observed at the transition between the Pleistocene and Holocene Epochs, except that it happens an order of magnitude faster.”
A separate study analyzing the nitrogen content of sea bird bones also provided proxy indication of a shift among cyanobacteria toward greater rates of nitrogen fixation, providing some additional confirmation for the increased ocean stratification observation. (An excellent article providing a more in depth exploration of these studies is available here.)
These studies combine with numerous observations of declining ocean health, increasing ocean hypoxia and anoxia, and an increasing number of observed mechanisms that may result in a more and more stratified ocean state as human warming intensifies to increase concern that the worst fears of Dr. Peter Ward and colleagues may be in the process of realization. (See: Dead Dolphins, Climate Change Devastating Ocean Fishermen, and Mass Starfish Die-off for more indicators of failing ocean health.)
Concerned Journalists and Terrified Ecologists
Put into various contexts, the current state of climate and environmental health does channel our worst fears that the Permian Extinction event may well be in for a human-caused repeat. The current estimated background extinction rate of 100-250 species per day is possibly the most rapid in all of geological history. The current CO2 level, near 400 parts per million, is higher than at any time during which human beings walked the Earth. The pace of greenhouse gas emissions is at least six times faster than at any time in the geological record. And the current, very large, forcing provided by humans does not yet include a probable powerful and unpredictable response from the Earth’s natural systems.
As Ecologist Guy McPherson notes — Nature Bats Last. And we should not be comforted by this notion. Because Nature carries the biggest stick of all. A consequence hanging over our heads that grows larger and more dangerous with each passing year during which our insults to her continue.
Among the pessimists regarding the end consequences of human caused climate change and related pollution, ecologists are the worst of the bunch. This is likely due to the fact that ecologists are very intimately involved in the study of how communities of organisms succeed or fail in natural settings. Among all groups of scientists, they are perhaps the ones most intimately familiar with the way in which all living things are connected to both one another and to the natural world. Ecologists know all too well that small shifts can mean huge changes to biodiversity, the rate of death among living beings, and the distribution of species in a given environment. But the changes humans inflict are not small in the least. They roughly ripple through the natural world in ways that ecologists know all too well have never before been seen.
Dr. McPherson is such an ecologist and one with such great conscience and concern that he, years ago, abandoned most of the luxuries of modern civilization to live in a fashion that produced the least harm possible. Not that this action has resulted in more optimism on his part. In fact, Guy is one of a growing group of people who believe that no action is likely to save humankind. That our insults to the natural world have already grown too great.
McPherson notes:
“We’ve never been here as a species and the implications are truly dire and profound for our species and the rest of the living planet.”
In this observation, Guy is probably right. But I sincerely hope that his and my own worst fears do not emerge.
It was Guy’s ongoing tracking of various dangerous alterations to world climate systems and assertion that human extinction may well be nigh that drew the attention of prominent journalist Dahr Jamail. Jamail recently penned the article: “The Great Dying Redux: Shocking Parallels Between Ancient Mass Extinction and Climate Change.”
Reading professor emeritus Guy McPherson’s blog was enough to convince Mr. Jamail of the risk that current warming could result in an extinction event to rival that of the Great Dying so long ago. Mr. Jamail notes:
It is possible that, on top of the vast quantities of carbon dioxide from fossil fuels that continue to enter the atmosphere in record amounts yearly, an increased release of methane could signal the beginning of the sort of process that led to the Great Dying. Some scientists fear that the situation is already so serious and so many self-reinforcing feedback loops are already in play that we are in the process of causing our own extinction. Worse yet, some are convinced that it could happen far more quickly than generally believed possible — even in the course of just the next few decades.
And so we come full circle. Rapid human warming leads to troubling ocean changes that hint at those feared to have resulted in mass extinctions during the Permian-Triassic boundary event. And the very rapid human warming puts at risk the catastrophically rapid release of Arctic methane which would certainly consign Earth to a rapid jump from a glacial to a hothouse state and potentially produce the kind of Canfield Oceans Dr. Ward fears. It is a deadly transition for which we have growing evidence with almost each passing day, one that McPherson and others fear could truly make an end to us and to so many other living creatures on this world.
So many scientists, so much valid reason to be dreadfully concerned, and yet we continue on the path toward a great burning never before seen in Earth’s history…
Links (Read them!):
Increasing subtropical North Pacific Ocean nitrogen fixation since the Little Ice Age
The Great Dying Redux: Shocking Parallels Between Ancient Mass Extinction and Climate Change.
Deep Sea Corals Record Dramatic Long-Term Shift in Pacific Ocean Ecosystem
Climate Change Devastating Ocean Fishermen
Hat Tip to David Goldstein
Share this:

Posted by robertscribbler on December 18, 2013
https://robertscribbler.wordpress.com/2013/12/18/through-the-looking-glass-of-the-great-dying-new-study-finds-ocean-stratification-proceeded-rapidly-over-past-150-years/
Amplifying Feedbacks: Climate Model to Test Projections of Zero Sea Ice By Summer 2016, Stark Predictions by Wadhams, Duarte
Ever since 1995 and especially since 2007 Arctic sea ice area, volume and extent have been in rapid free-fall. By 2012 both sea ice area and extent had suffered losses greater than 55% when compared to end summer measures in 1979. Sea ice volume, meanwhile had shown a stunning loss of nearly 80% from 1979 volume observations. This staggering trend of losses means that any melt year comparable to 2007, 2010 (volume) or 2012 would result in the total or near total loss of all sea ice within the Arctic by end of summer.
The summer of 2013 was exceptional in that it was the first year that statistical averages indicated a potential for total summer sea ice loss. The risk at the time was considered to be low, only 10%. But the figure was historic in that, never before, had a statistical risk of total sea ice loss been identified. Following more typical trends, the 2013 melt season showed a bounce-back from 2012’s record melt year with levels roughly correlating with those seen in 2009. That said, even 2013’s pseudo-recovery did little to disturb an extraordinarily powerful melt trend:

(Sea Ice Volume Measurements For All Months as Observed By PIOMAS With Exponential Trend. Image source: Wipneus. Note that the exponential trend shows monthly volume measures for July, August, September and October reach zero sea ice volume all before 2019.)
Taken into context, the 2013 melt season was little more than a counter-trend year in a period of ongoing and apparently inexorable decline. In context to these massive losses, the heat forcing in the Arctic continues to grow with most regions showing at least a doubled rate of temperature increase when compared to the global norm. Total temperature change in the Arctic is now about 2 degrees Celsius hotter than the 1950 to 1980 global average. A recent study of the regions around Baffin Island showed temperatures are now hotter than at any time within at least the last 44,000 years and probably the last 120,000 years. And with temperatures rising by about .4 degrees Celsius each decade, the Arctic continues to rapidly transition toward ever more hot and unfamiliar territory.
A High Resolution Climate Model For An Arctic in Rapid Transition
These rapid and massive changes appear to have left conventional global climate models (GCMs) in the dust. Earlier global climate model runs of the Arctic assumed slow responses to temperature increases by the world’s ice sheets resulting in predictions for ice free Arctic Ocean conditions at much higher temperatures than those currently being observed. The result of these assumptions that Arctic sea ice generated high inertia and was more resilient to human caused climate change were predictions for ice free Arctic summers to hold off until at least 2100.
But, as we have seen in the above analysis, recent events have put the possibility for ice free Arctic conditions on a much shorter time-scale. And, until recently, only statistical analysis, exponential trends fitting, and direct observation were able to provide any direct guide that more closely fit the stark and ongoing changes in the Arctic. In a world where simulative models seemed to take precedence over even observed reality, the dearth of models describing what all could plainly see was a catastrophic and rapid melt trend cast doubt on the all-too-stark observations.
Now, a new tool to place these much more rapid than expected melt conditions into context appears to be coming together. The high resolution Regional Arctic Systems Model (RASM) constructed by US Navy Scientist Professor Wieslaw Maslowski finds its basis in a 2012 paper showing the potential for the Arctic to be ice free come 2016 +/- 3 years. This new model takes into account a more detailed summary of Arctic conditions including a more highly resolved interpretation of the impacts of warming-driven changes to:
“… sea ice deformation, ocean eddies, and associated ice-ocean boundary layer mixing, multiphase clouds as well as land-atmosphere-ice-ocean interactions.”
Dr. Maslowski notes that while no climate model simulation is perfectly accurate, the RASM simulation is likely to be much closer to what is actually happening in the Arctic environment. Maslowski notes:
“Given the estimated trend and the volume estimate for October–November of 2007 at less than 9,000 km3, one can project that at this rate it would take only 9 more years or until 2016 ± 3 years to reach a nearly ice-free Arctic Ocean in summer. Regardless of high uncertainty associated with such an estimate, it does provide a lower bound of the time range for projections of seasonal sea ice cover.”
It is important to note that RASM hasn’t yet run or provided projections. But the fact that it is taking into account the visibly rapid loss of sea ice as well as a more refined view of the Arctic environs means that such a tool could well generate more accurate measures or at least help explain the apparently very rapid melt trend. According to Maslowski:
“We do expect to compare sea ice volume results [from the RASM model] with our earlier model for the same period … possibly next year or so…”
Confirmation of the Most Pessimistic Predictions?

(2007 and 2012 record sea ice minimums — overlay. Image source: NSIDC)
Dr. Maslowki’s paper and RASM model runs may provide single source confirmation for some of the most pessimistic predictions by Arctic sea ice experts. Dr. Peter Wadhams, a world renown sea ice expert who has spent about 30 years monitoring the state of sea ice aboard British Navy submarines has projected that the Arctic could reach an ice-free state by the end of summer during 2015 or 2016.
Another climate expert, Dr. Carlos Duarte, head of the Ocean Institute at the University of Australia, has projected that the Arctic will reach an ice free state by 2015.
More moderate projections place total sea ice loss during summer at between 2025 and 2040.

(IPCC Global Climate Model Sea Ice Melt Projections. Figures are in Sea Ice Extent (not Volume as seen Above). It is worth noting that the Volume and Area melt trends are much more pronounced than the extent measure that fails to count holes in the ice (area) or add in the measure of ice thickness (volume). The above image, produced by Overland and Wang, also appears to be off the 2012 minimum extent measure by about 200,000 square kilometers.)
Meanwhile, global climate models (GCMs), provided above, continue to lag real time observation, and projections by noted experts. Even taking into account models that have gotten the current trend mostly correct show ice free conditions by around 2050 (mean). Meanwhile, the GCM overall mean continues to show near ice-free conditions by 2100.
These projections are questionable for a number of reasons, not the least of which is the fact that they only take into account the very low resolution of sea ice extent and not the higher resolution figures of sea ice area or volume. Sea ice area, for example, fell to a stunning record low of 2.1 million square kilometers during 2012, a total loss of about 3.6 million square kilometers since 1979 and a loss of about 1 million square kilometers off the previous record low (area) set in 2011. Such a low figure could already, arguably, be called ‘nearly ice free when compared to average area lows of nearly 6 million square kilometers during summers four decades ago.

(Sea Ice Area Measures Provided by NSIDC via Cryosphere Today. Note the extreme record low set in 2012, a measure well below comparable sea ice extent figures which fail to account for holes in the ice. See also: Arctic Ice Graphs.)
It is this lack of GCM resolution, combined with an ongoing trend of stunning losses that has resulted in serious changes in predictions by even somewhat conservative scientists from the National Snow and Ice Data Center. Professor Mark Serreze of Colorado’s branch of NSIDC, who is skeptical that ice free conditions could be reached as early as 2016, notes:
“I am on record stating that we may lose the summer ice cover as early as 2030, and I stand behind that statement. This is in itself much earlier than projections from nearly all climate model simulations. I would agree with Dr. Maslowski that the IPCC models have shortcomings.”
The question, then, is will higher resolution climate models like Maslowski’s RASM provide a better understanding of what appear to be chaotic, powerful and rapid changes to the Arctic environment well ahead of the previously predicted time-frame?
Loss of Summer Sea Ice to Unleash Amplifying Feedbacks
Because it covers such a large stretch of ocean with a white, reflective surface, sea ice is a primary governor of Arctic and global weather. It keeps the Arctic cool by insulating millions of square kilometers of dark Arctic Ocean waters from the near constant radiation of the polar summer sun.
As the sea ice retreats, more of this dark water becomes exposed to the sun’s rays. Because the ocean surface is dark, it traps most of this light. The result is far greater warming of the Arctic during the summer time.
The loss of sea ice and related ocean warming has a number of knock-on effects. The first is that increasing ocean heat delivers far more energy to the sea bed. In the case of the East Siberian Arctic Shelf, the warming shallow sea is one filled with carbon deposits from a massive expanse of submerged tundra. An estimated 1500 gigatons of methane lay sequestered in thawing permafrost beneath this rapidly warming sea. According to Wadhams, loss of sea ice can add up to 7 degrees Celsius of additional warming to this vulnerable sea bed.
Current estimates provided by Dr. Natalia Shakhova show that around 17 megatons of methane are being released from the ESAS each year. This emission is more than twice that of the entire global ocean system and accounts for about 2.8 percent of the current global methane emission. Given the massive volume of methane stored in the ESAS and the rapid pace of sea ice loss and related ocean warming, this region of the world is more than capable of providing significant additional volumes of this potent greenhouse gas.

(A frothy mixture of methane and sea ice near the East Siberian Arctic Shelf. Image source: Igor Semiletov, The University of Alaska)
Meanwhile, ship based observations show that methane levels at the surface of ESAS waters are a stunning 3800 ppb, about twice the global average:
“Ship-based observations show that methane concentrations in the air above the East Siberian Sea Shelf are nearly twice as high as the global average… Layers of sediment below the permafrost slowly emit methane gas, and this gas has been trapped for millennia beneath the permafrost. As sea levels rose at the end of the ice age, the shelf was once again covered by relatively warm ocean water, thawing the permafrost and releasing the trapped methane… In the short-term… methane has a global warming potential 86 times that of carbon dioxide. (NSIDC)”
More rapid Arctic Ocean warming during summer times also results in more rapid warming of nearby land masses. And recent years have seen a number of extraordinary Arctic heatwaves driving 80+ degree temperatures all the way to the shores of the Arctic Ocean. Rapid warming of this region also results in a rapid thaw of massive volumes of permafrost. The permafrost stores organic material that breaks down into both CO2 and methane, providing additional emissions that enhance an already very rapid human warming. Current emissions from the Arctic tundra system are estimated to be around 17 megatons of methane and hundreds of megatons of CO2. Like the emissions coming from the ESAS, these emissions provide a significant added contributor to the human GHG forcing and will likely continue to provide increasing emissions as the sea ice retreats further.
In addition to the combined amplifying feedback of loss of sea ice albedo and amplifying greenhouse gas emissions from the Arctic, sea ice erosion has now also been shown to have profound effects on the circumpolar Jet Stream. Research by Dr. Jennifer Francis, Dr. Quihang Tang, a number of other scientists, and confirming analysis by Dr. Jeff Masters, has noted a weakening in the Jet Stream caused by a lowering of the temperature differential between the lower latitudes and the poles. The Jet is driven by such high temperature extremes between north and south. But as the higher latitudes warm faster than the temperate zones this temperature differential drops and the Jet Stream weakens. The end result is higher amplitude Jet Stream waves that tend to get stuck, resulting in more persistent, extreme weather. Dr Quihang, in a recent paper, notes:
“As the high latitudes warm faster than the mid-latitudes because of amplifying effects of melting ice, the west-to-east jet-stream wind is weakened. Consequently, the atmospheric circulation change tends to favour more persistent weather systems and a higher likelihood of summer weather extremes.”
The end result of these alterations brought on by a very rapid loss of Arctic sea ice are chaotic changes to the Arctic Ocean and surrounding lands along with a severe disruption to Northern Hemisphere weather patterns. These changes also combine in a self-reinforcing pattern to further amplify the pace of human caused warming both in the Arctic and around the globe. And should the summer Arctic sea ice completely melt in the time-frame of now to 2019 as Maslowski, Wadhams and Duarte have projected as a ‘most rapid’ estimate, then the already stark changes we are seeing will become much more extreme and pronounced.
Links:
Extreme Summer Weather Linked To Vanishing Cryosphere
Could Arctic Summers be Ice-Free Within Three Year’s Time?
When Will the Arctic Summer be Nearly Ice Free?
Hat Tip to Aaron
(Updated December 17)
Share this:

Posted by robertscribbler on December 16, 2013
https://robertscribbler.wordpress.com/2013/12/16/amplifying-feedbacks-us-navy-climate-model-shows-zero-sea-ice-by-summer-2016-confirms-stark-predictions-by-wadhams-duarte/
Please Help Support Our Ongoing Efforts

Climate of Pandemic — A COVID-19 Special Report

GROWTH SHOCK

Luthiel’s Song: Dreams of the Ringed Vale

Luthiel’s Song: The War of Mists

Climate Progress

The Secular Jurist

Exposing Misinformation Spread by Anthony Watts

Colorado Bob’s Climate Feed

Arctic Sea Ice Blog

Science Blogs

Climate State


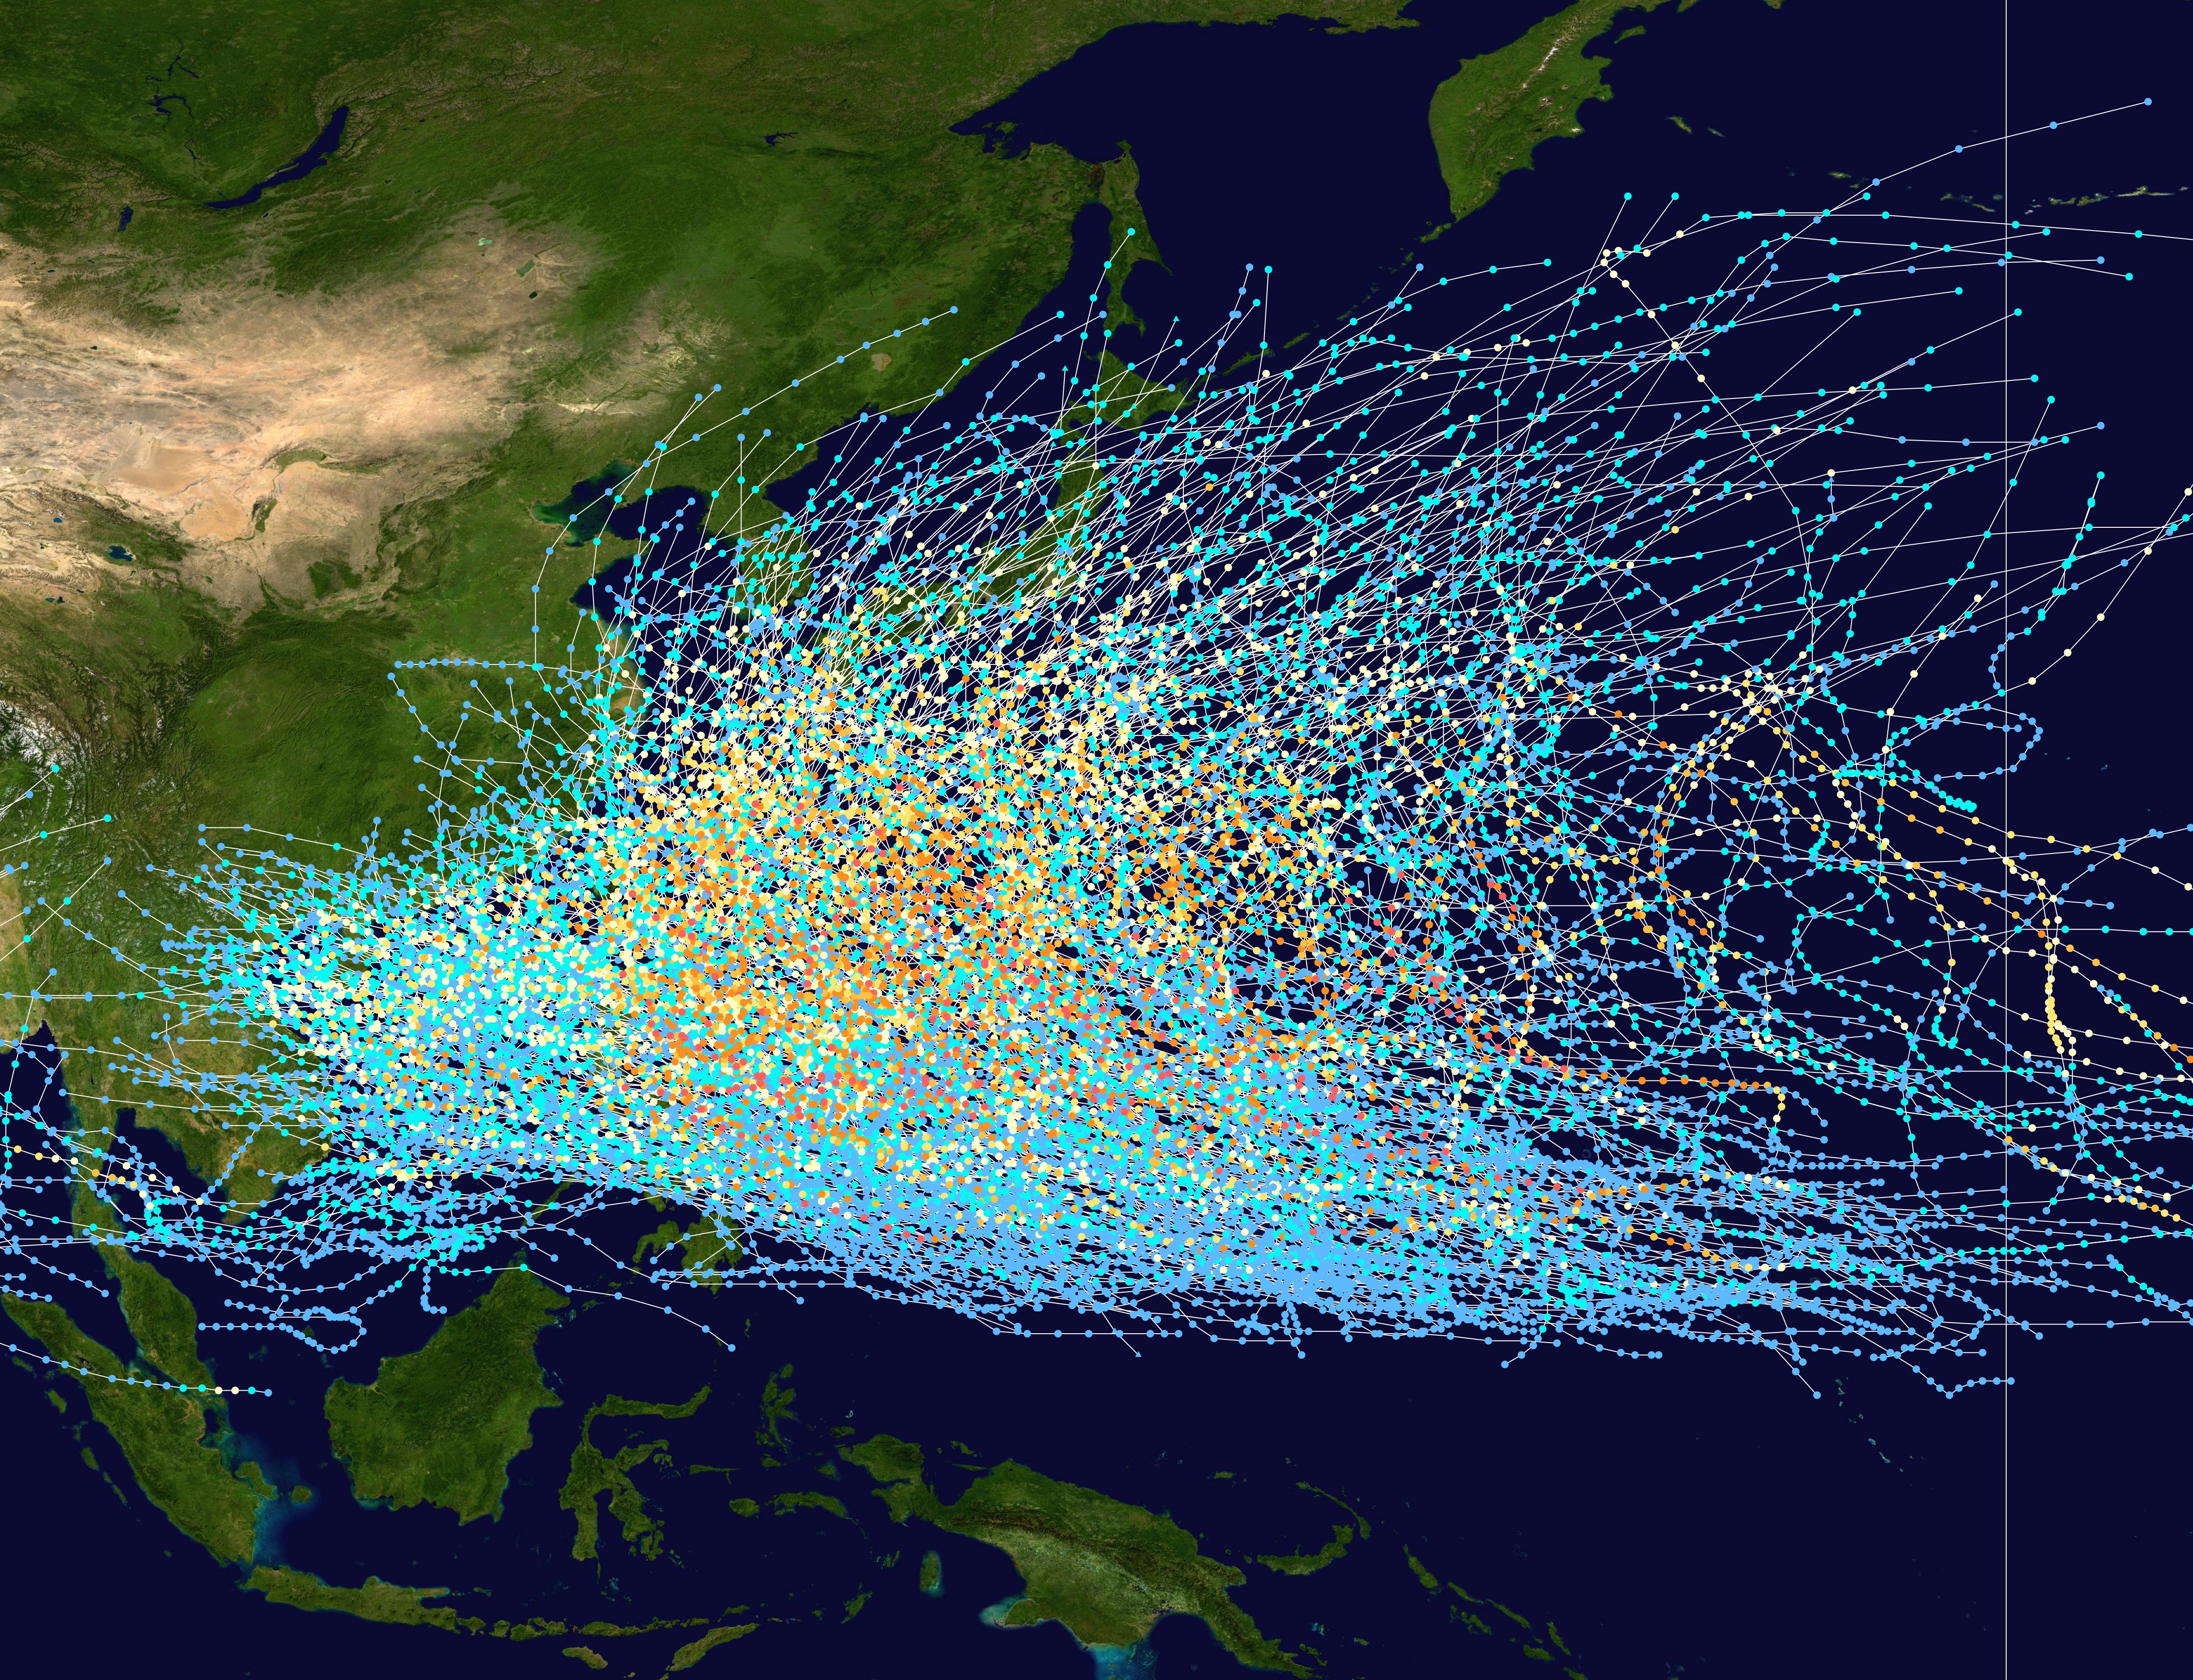