
Major storm system sets off blizzard conditions in central north. An freaky heatwave blankets the southeast. Warm ocean waters counter-balance El Nino in hurricane forecast for summer. Beginning of the end for sea ice? Waves are fun and small here in the OBX!
All posts tagged Antarctic sea ice
OBX Wave Report Feb 22 — Winter Heat and Waves

Posted by robertscribbler on February 22, 2023
https://robertscribbler.wordpress.com/2023/02/22/obx-wave-report-feb-22-winter-heat-and-waves/
Global Sea Ice At Record Lows For More than a Month
As a weak El Nino combines with continued rising atmospheric greenhouse gas levels to push global temperatures higher in 2019, we are seeing some pretty extreme warming impacts the world over. Just one of these impacts involves sea ice.
(An analysis of factors contributing to global sea ice loss.)
Looking north, we already observe that Arctic sea ice is pretty much tied for lowest visible extent on record in the National Snow and Ice Data Center (NSIDC) measure. According to NSIDC’s Charctic Graph, sea ice extent in the Northern Hemisphere is ranging around 12.465 million square kilometers. This is just slightly above the record low for the date set in 2016 at 12.422 million square kilometers.
To the south, Antarctic sea ice extent has recently slipped into new record low ranges for this time of year. As of May 10th, NSIDC showed sea ice extent near the frozen southern continent in the range of 7.898 million square kilometers or about 200,000 square kilomters below the previous daily record low set in May of 2017. These record lows have occurred on the back of a rather warmer than normal late Southern Hemisphere Fall season.
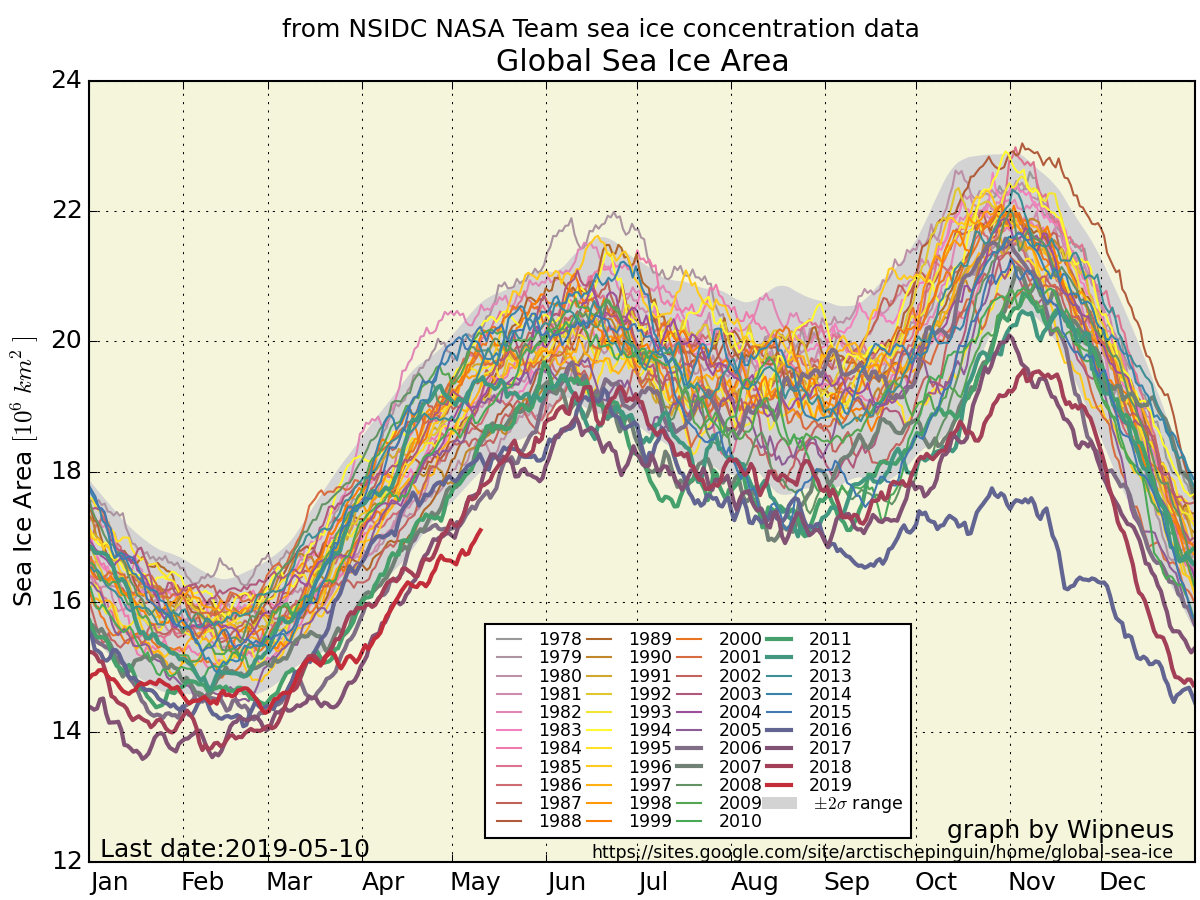
(Global sea ice graph provided by Wipneus. Date provided by NSIDC.)
Two hemispheres experiencing record low or near record low sea ice conditions over an extended period during April through May of 2019 have now generated a historical period for global sea ice. The result is that recent major global sea ice losses occurring during 2016-2019 are being further solidified. Yet one more aspect of the larger global warming regime enforced by continued fossil fuel burning.
(Interested in fighting climate change on a personal level by switching to a clean energy vehicle? Get up to 5,000 free supercharger miles with this referral code.)
Share this:

Posted by robertscribbler on May 11, 2019
https://robertscribbler.wordpress.com/2019/05/11/global-sea-ice-at-record-lows-for-more-than-a-month/
Antarctic Sea Ice Hits New All-Time Record Low
During late February, Antarctic sea ice breached the previous all-time record low for extent coverage since measurements began in 1978. And in the following days, sea ice extent measures near the South Pole have continued to creep lower, gradually extending into unprecedented ranges.
Record Melt During a Period of Considerable Global Heat
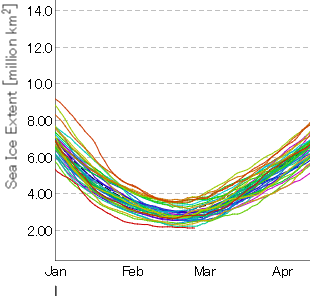
(This February, according to JAXA, the Antarctic sea ice extent measure hit a new all time record low. Image source: JAXA.)
Hitherto unseen global heat — driven primarily by human fossil fuel emissions — appears to be the chief contributor to this melting. During 2016, global average surface temperatures rose to 1.2 degrees Celsius above 1880s ranges. This global reading likely represents the warmest surface temperatures the world has experienced in the last 115,000 years. At the same time, the global ocean system has been rapidly accumulating warmth and transferring it through the surface and deep layers of the world’s waters.
Such pervasive heat is producing an ongoing trend of considerable sea ice melt in the Arctic — a trend that has been in place since record-keeping began in 1978. One that, all by itself, is strong enough to drag global sea ice measures lower and lower. The warmth is also producing land ice melt around the world — including glaciers in Antarctica, Greenland and across numerous mountain ranges.
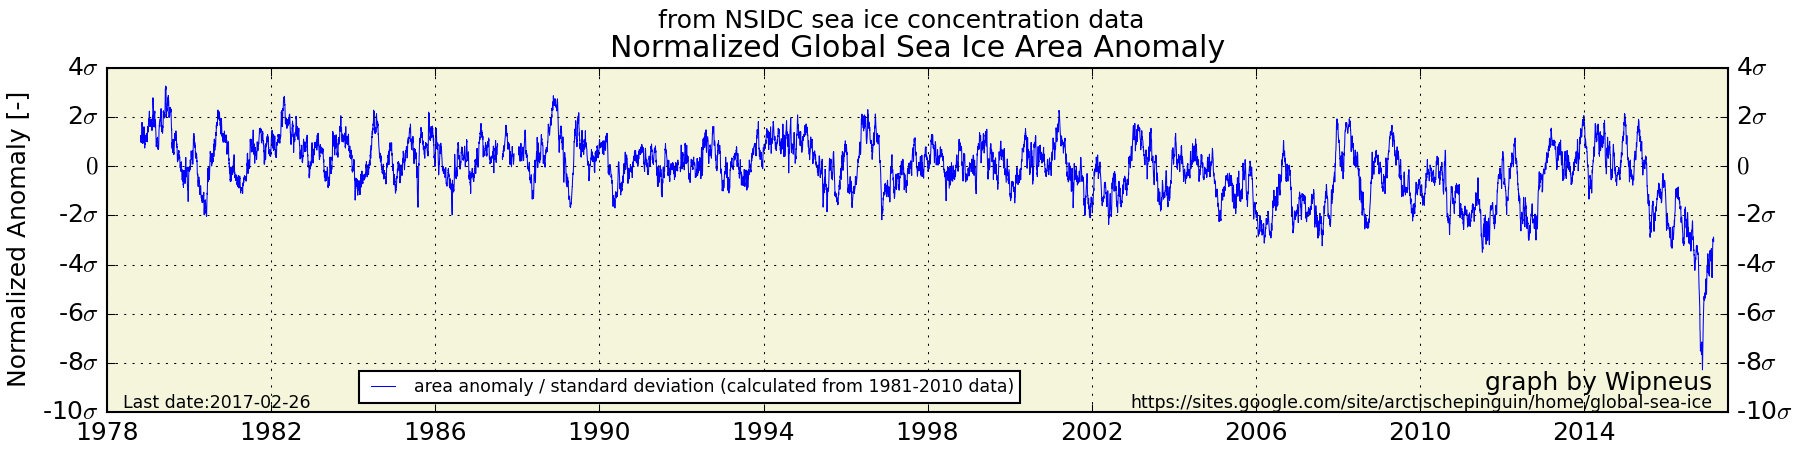
(Global warming produced an identifiable global sea ice melt trend during the post year 2000 period. By 2016, that trend had become glaringly obvious. See final paragraph for further discussion. Image source: Wipneus.)
Mild Antarctic Ice Growth Trend Reversed
Sea ice melt in the Antarctic, however, is a possible new feature. In the past, it is thought that fresh water outflow from glaciers in Antarctica and strong winds encircling the Southern Hemisphere sea ice helped to protect it from the initial pulse of human-forced warming. And as recently as 2014 and 2015, Antarctic sea ice experienced new record high readings even as the long-term trend hinted at a possible slow expansion of sea ice near the South Pole. Researchers had indicated that the protection for Southern Hemisphere sea ice might only last as long as fragile wind patterns around the South Pole remained.
For 2016 and 2017, however, that thin veil of protection appears to have fallen. Previous record lows for Antarctic sea ice extent set in 1997 at 2.26 million square kilometers sea ice coverage during the austral summer month of February have now been exceeded by 100,000 square kilometers. As of yesterday, according to JAXA, the new record low stood at 2.16 million square kilometers.
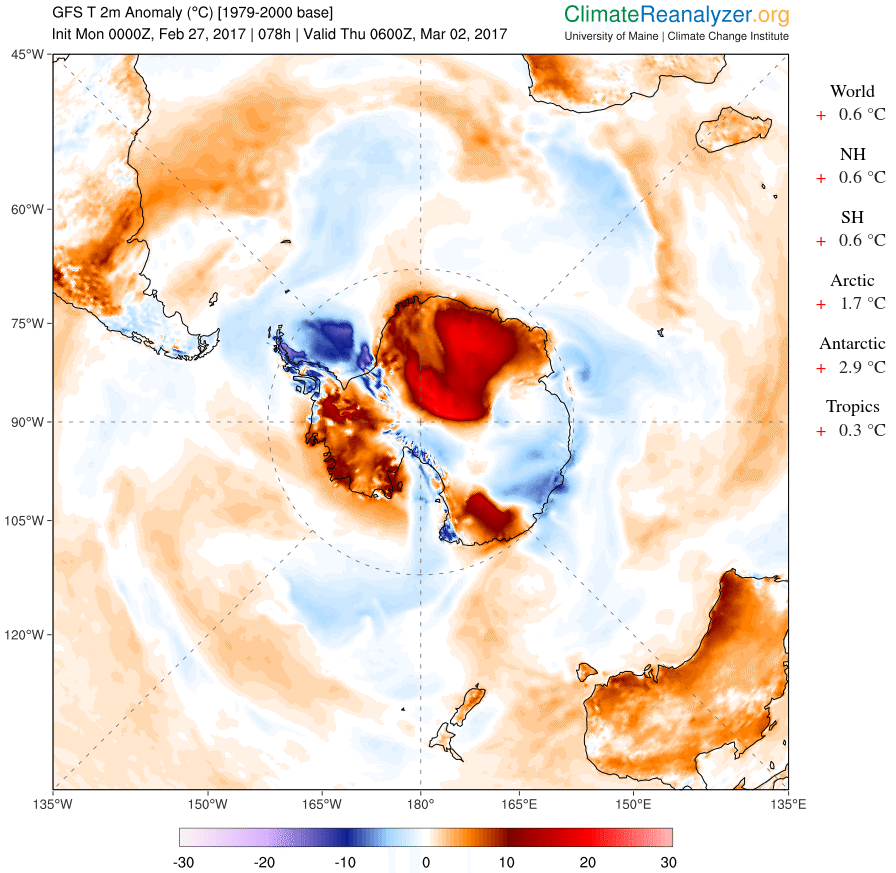
(More above average temperatures predicted this week for Antarctica may extend sea ice record lows somewhat before refreeze sets in. Image source: Climate Reanalyzer.)
Antarctic refreeze typically starts during mid-February as seasonal cooling sets in. However, 2017’s warmth has driven an extension of late season melt with Antarctic sea ice continuing to decline through the end of February. At some point during the next week or two, however, refreeze is likely to finally kick in. But this return to rising ice coverage may be still be delayed somewhat by very warm Antarctic temperatures predicted to range as high as 2.9 C above average through the next five days.
Global Sea Ice Coverage Falling Rapidly
This year’s all time record low for Antarctic sea ice extent also comes at a time when the Arctic has been experiencing daily, monthly and seasonal record lows. Highly unseasonable temperatures have dominated Arctic Fall and Winter during 2016 and 2017 — producing never before see low extent coverage during the period. As a result of record lows occurring at the same time in the north and in the south, overall global sea ice coverage has taken a considerable beating and the larger global sea ice trend is now strongly negative.
Links:
Global Sea Ice Diminishing Despite Antarctic Gains
What’s Going on With Antarctic Sea Ice?
Share this:

Posted by robertscribbler on February 27, 2017
https://robertscribbler.wordpress.com/2017/02/27/antarctic-sea-ice-hits-new-all-time-record-low/
The Human World Has Never Experienced A Time When Global Sea Ice Was So Weak and Reduced
Neven — one of the world’s most beloved sea ice trackers — has again taken a break from his much-earned sabbatical to issue yet one more warning on the state of global sea ice.
His report, based on this month’s bombshell National Snow and Ice Data Center statement, can best be described as an urgent call for action on the part of the global community to redouble efforts aimed at reducing the wide-ranging and expanding harms caused by the terrible warming trend we have artificially forced upon our world.
Neven is a kind, honest, and open soul. He is also one of the smartest and decent fellow bloggers I have had the good fortune of encountering in my many travels during my last four years of covering the slow motion global train wreck caused by our widespread and vastly irresponsible burning of fossil fuels. In other words, the man, in my view, has the moral and intellectual authority that many lack. We should listen to him.
Before the World Warmed, This Would Have Been a 1 in 30 Billion Probability Event
For, sadly, on the crucial issue of sea ice, a general muting of the subject has tended to continue despite a jaw-dropping plunge in both the coverage and volume of a substance so crucial to maintaining a stable global climate:
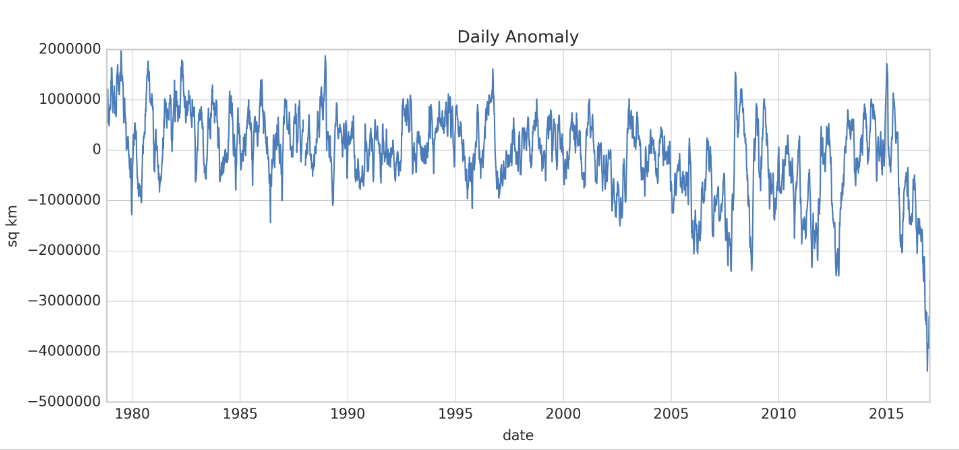
(Global sea ice extent fell off a cliff during December of 2016. The measure has now bounced back a little. But the global average remains significantly below past record lows for this time of year. Loss of so much sea ice can be highly disruptive to the climate system and related atmospheric circulation and precipitation patterns. Image source: NSIDC.)
During December, global sea ice extent coverage fell to an amazing 4.4 million square kilometers below average. This is far, far outside the 2 standard deviation range — passing to fully 8 standard deviations beyond the typical yearly average.
Under past expectations of average, the statistical probability of such an event is approximately 1 in 30 billion. Of course, it’s pretty obvious at this time that a normal, natural variability is not the underlying cause of such a great loss of sea ice. That the warmth we added to the system has now greatly tipped the scales beyond anything representing what would have previously been considered a normal range. A range that since the year 2000 had already tended to dip below average more and more frequently. But one that has never seen so much ice lost.
Unprecedented Losses
This area of sea ice removed — enough to change how the face of our Earth looks from space — is approximately the size of two Greenlands (Note that sea ice loss does not directly contribute to sea level rise. But loss of protective sea ice can contribute to land ice melt — which does add to rates of sea level rise.). And it has been roughly split between the Arctic in the north and the Antarctic in the south.
If sea ice extent losses appear bleak, then sea ice volume losses seem even worse. Sea ice extent is a rough measure of the surface of the world covered by ice excluding gaps behind the leading ice edge. Sea ice volume, however, measures both the ice area — including gaps — and the ice thickness.
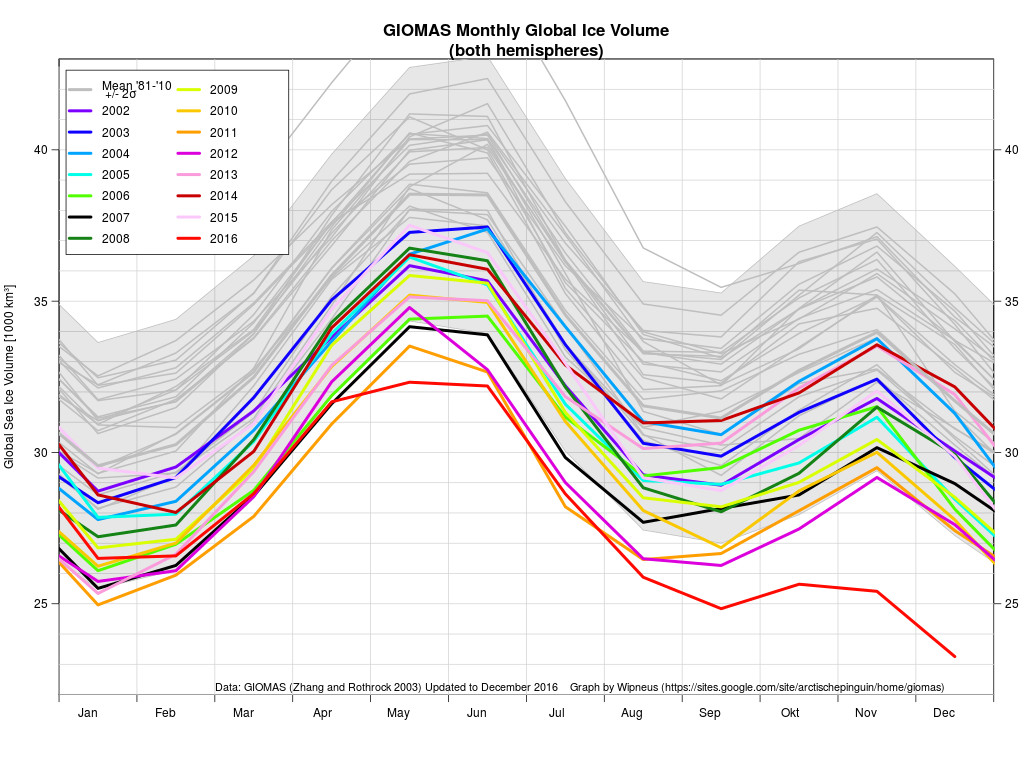
(Globally, we’ve lost about 1/3 of the total volume of sea ice since the 1980s. 2016’s record fall in the measure coincided with record hot global temperatures and an abnormal period of polar warming that continues on into 2017. Image source: Wipneus.)
Late 2016’s big drop included the approximate removal of 1/3 of the world’s sea ice volume when compared to 1981-2010 averages. In other words, 1/3 of all of the floating portion of the world’s cryosphere beyond the edge of anchored ice shelves had melted away during the period.
Record Global Temperatures as Prime Cause For North and South Pole Sea Ice Melt
In the north, extremely warm temperatures ranging from 2 to up to 7 degrees Celsius above average for the Arctic Ocean region have helped to drive these unprecedented fall and winter sea ice losses. In the south, warmer than normal surface conditions appear to have also helped to drive the amazing coordinate losses there. And overall, 2016 has shown warm to extremely warm conditions for both poles during a year in which global temperatures have spiked to around 1.2 degrees Celsius above 1880s averages.
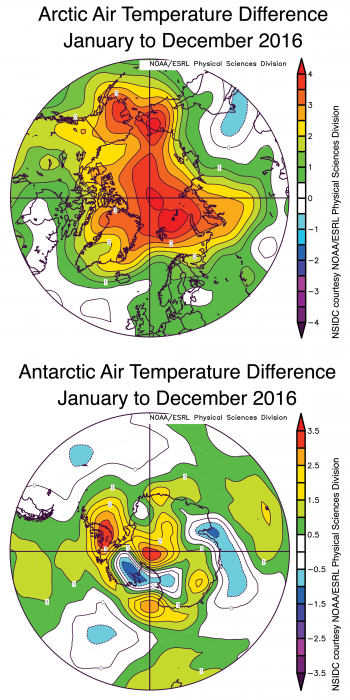
(Extremely strong polar amplification during 2016 is the likely primary contributor to sea ice loss in both the northern and southern polar regions. Image source: NSIDC.)
Under polar amplification — a condition associated with the human-forced warming of our world — scientists expected that the polar regions would tend to warm faster than the rest of the Earth surface. And during 2016, this global warming related condition presented effects writ large. The damage to sea ice, so far, has been monumental. And these losses have continued into 2017 — even if they are somewhat less below the record low line than during their period of maximum departure this past December.
Albedo Losses and a Bad Set-up for Arctic Summer
Sea ice loss generates its own form of amplifying feedback — in which already prevalent polar warming can worsen further. Less ice coverage means that during summer more of the dark ocean surface is presented to absorb the sun’s rays. This replacement of a white, reflective surface with a dark blue, absorptive one means that still more heat will tend to be trapped in the polar environment. In addition, during winter, less ice cover means that the warmer ocean beneath will tend ventilate more heat and heat-trapping water vapor into the polar atmospheres. And it’s this kind of self-reinforcing cycle that can tend to lock in the dangerous changes like worsening severe weather, worsening heatwaves in the middle and lower latitudes, and the increasing rates of land glacier melt and sea level rise that scientists have been warning about for so long. And it’s this kind of disruptive longer term climate trend that we are being drawn into at this time.
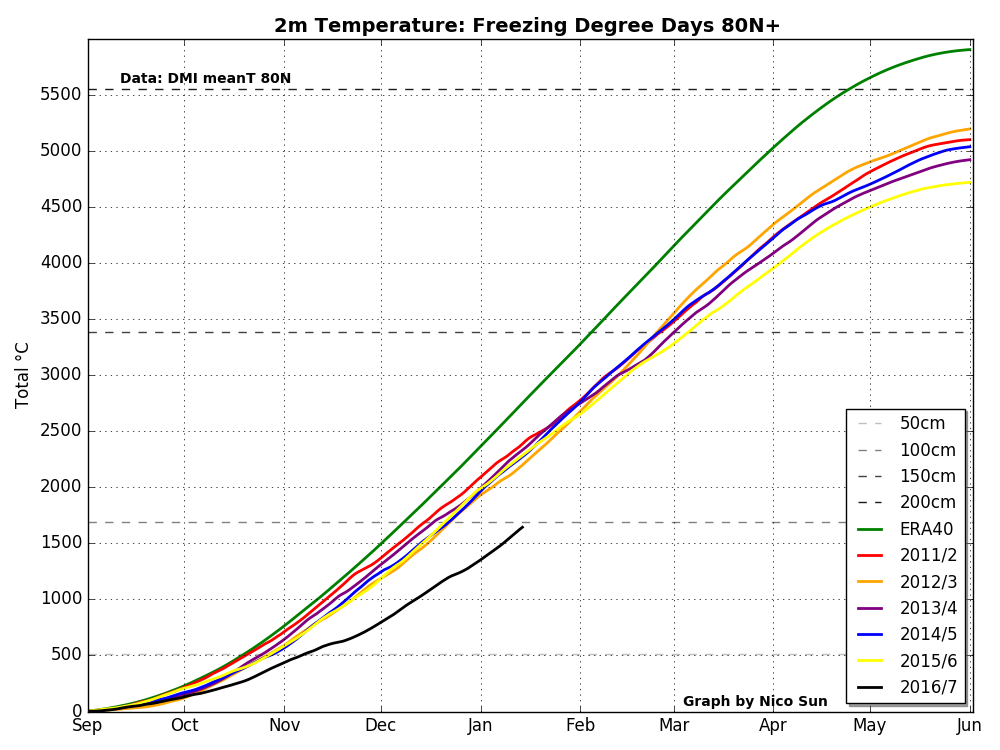
(Freezing degree days for the crucial 80 N region have significantly departed into record low ranges. The less freezing degree days, the closer this region is to thawing. Image source: Tealight. Data Source: DMI.)
Nearer term, it appears that the polar heat which has already so greatly damaged the Arctic sea ice is set to stay. Over the next few days, the Arctic appears set to experience a powerful series of low pressure systems running in from the Barents side between Svalbard and Siberia. Neven warns that these storms will tend to push a considerable portion of the remaining thick ice out of the Arctic and through the Fram Strait. Over the next couple of weeks, global forecast models indicate that above freezing temperatures will tend to invade regions now covered by sea ice in Hudson Bay, Baffin Bay, and in the Chukchi Sea. Though the ice is trying to grow, such repeated insults will tend to keep ice coverage in record low ranges.
If this trend of warmth, storms and ice export continues through February, March and April — as it has during October, November, December and January — then the set up for the 2017 melt season would be about the worst we have ever seen. And that would tend to increase the likelihood of new record minimums being reached during September all while hastening the day when the Arctic experiences near ice free conditions. Lets hope that doesn’t happen. But, so far, the trends for the winter of 2016-2017, from pole to pole, have followed along the lines of a near worst case scenario.
Links:
Global Sea Ice Records Broken Again
National Snow and Ice Data Center Sea Ice News
Hat tip to Suzanne
Hat tip to Cate
Hat tip to Colorado Bob
Share this:

Posted by robertscribbler on January 13, 2017
https://robertscribbler.wordpress.com/2017/01/13/the-human-world-has-never-experienced-a-time-when-global-sea-ice-was-so-weak-and-reduced/
From Pole to Pole, Global Sea Ice Values are Plummeting
During the record hot year of 2016, both Arctic and Antarctic sea ice extents took a huge hit.
Extreme warmth in the Arctic helped to produce leading losses there. Values that began during January at 1 million square kilometers below average have steadily declined as the months progressed to near 2 million square kilometers below average. Meanwhile, the Antarctic — which began the year at near average sea ice extent values — saw significant losses as the region grew anomalously warm during austral spring. Today, sea ice extent values surrounding the Antarctic are now also just shy of 2 million square kilometers below average.
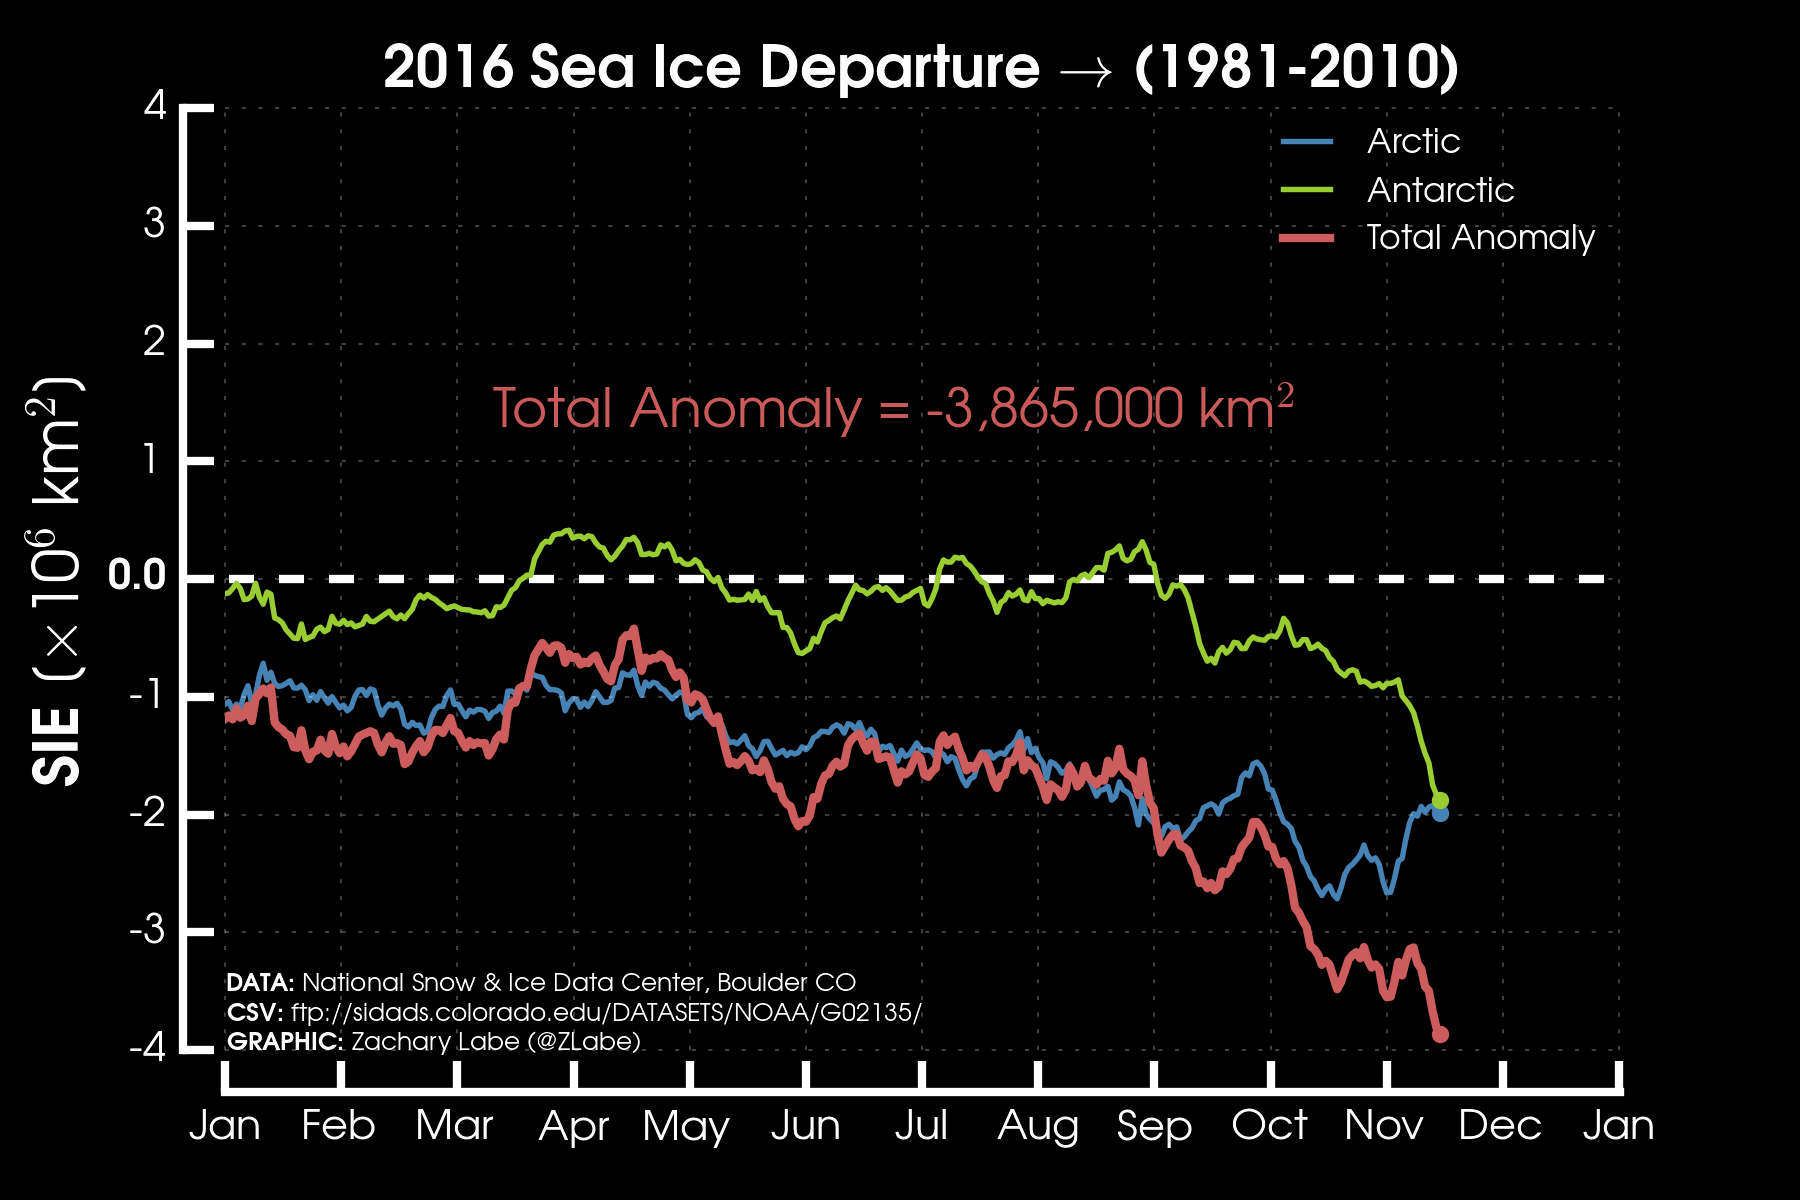
(Zachary Labe, one of the most well-recognized up and coming U.S. climate scientists, has produced this graph based on NSIDC recorded global, Arctic, and Antarctic sea ice values. As you can see, global sea ice extent during the hottest year on record has steadily plummeted to near 4 million square kilometers below average as the months progressed. Image source: Zack Labe’s Sea Ice Figures. Data source: NSIDC. You can also follow Zack’s informative twitter feed here.)
In total, global sea ice coverage is now about 3,865,000 square kilometers below average.
If you think that number sounds really big, it’s because it is. It represents a region of lost ice nearly 40 percent the size of the land and water area of the entire United States including Alaska and Hawaii. To visualize it another way, imagine all of the land area of Alaska, California, Texas, Montana, Arizona and New Mexico combined and you begin to get the gist.
Sea Ice Coverage — An Important, But Complex Climate Indicator
Many climate specialists have viewed sea ice as a kind of climate change canary in the coal mine. Sea ice sits upon the warming oceans and beneath a warming atmosphere. And these oceans are now taking up the majority of the heat being trapped in the atmosphere by fossil fuel emissions. Warming ocean surfaces have a higher specific heat value than the air and this greater overall energy capacity in warming regions generates a substantial blow to ice coverage even if the initial water surface temperature swing is only moderate.
Once sea ice is lost for a significant period, a kind of feedback loop comes into play where dark ocean surfaces trap more of the sun’s rays during polar summer than once-white ice coverage — which previously reflected radiation back toward space. This newly absorbed heat is then re-radiated back into the local atmosphere during polar fall and winter — creating an inertial barrier to ice reformation and ultimately generating a big jump in seasonal ocean and atmospheric surface temperatures.
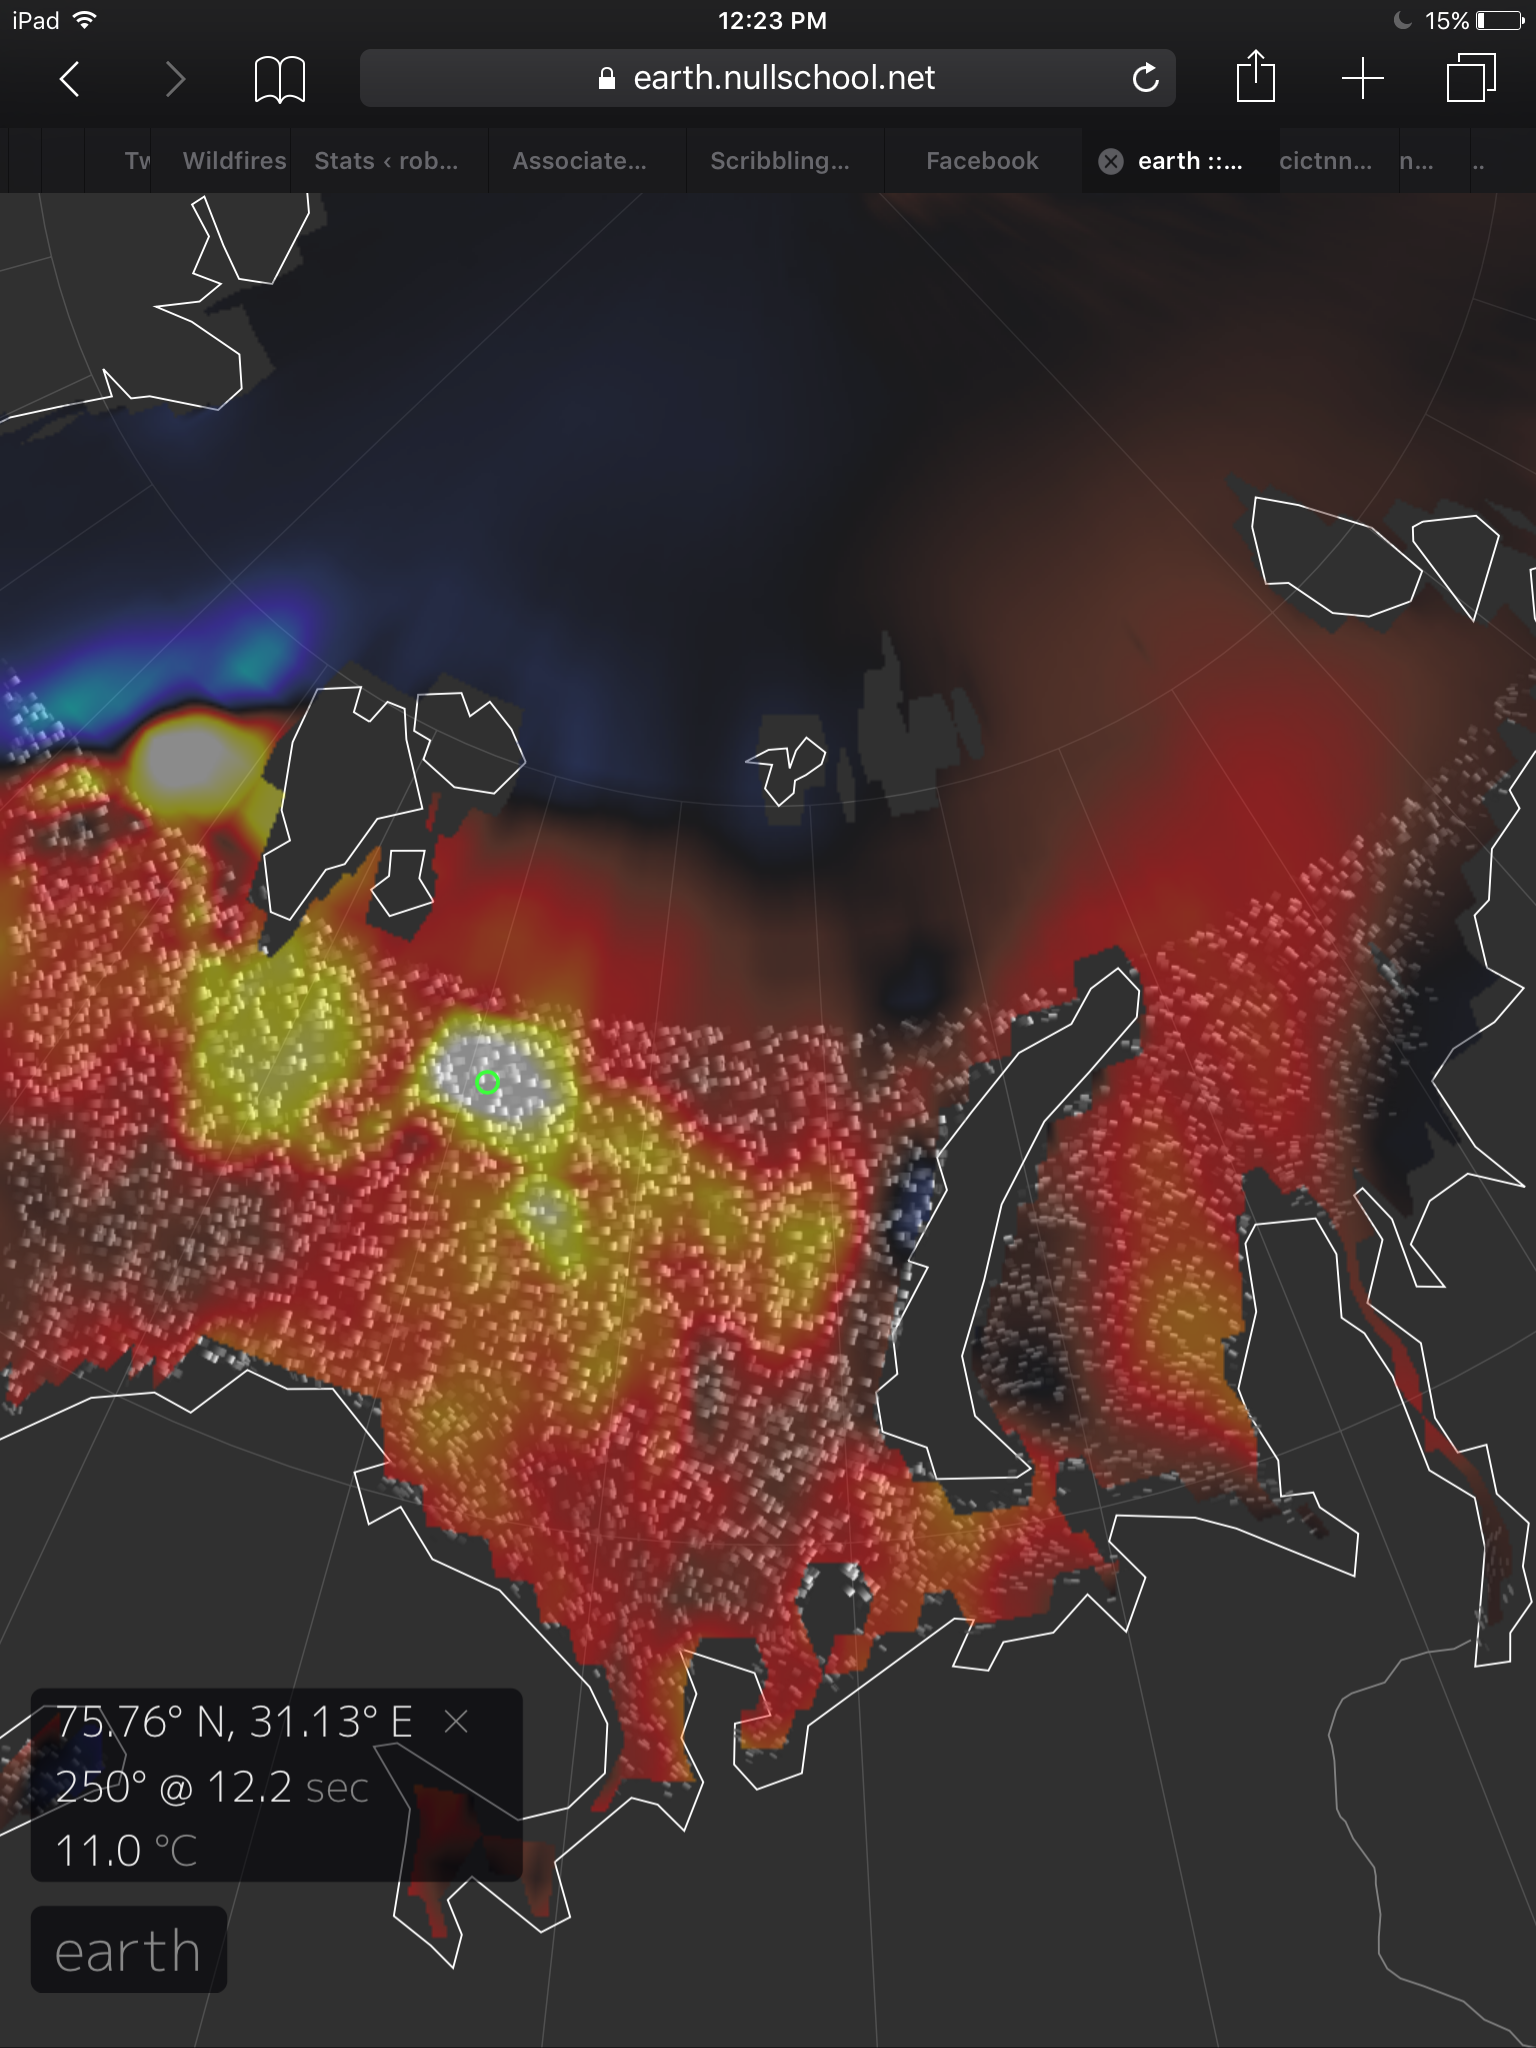
(Highly pronounced ocean surface warming coupled with warm air invasions appears to be generating the extreme losses to sea ice now seen in the Arctic. The Barents Sea, shown above, has seen particularly extreme warming. Note the 11 C above average hot spot near the sea ice edge zone. In the Antarctic, the causes of losses remain uncertain. However, atmospheric warming and shifts in the circumpolar winds appear to be producing this effect even as slightly cooler than average surface waters remain in place — possibly due to storm related Southern Ocean upwelling and increasing fresh water outflows from Antarctic glaciers. Image source: Earth Nullschool.)
This dynamic is particularly pronounced in the Arctic where a thawing ocean surrounded by warming continents tends to readily collect heat even as atmospheric energy transfers from the south, in the form of warm wind events, have grown more pronounced. An effect related to the climate change influence known as Northern Hemisphere Polar Amplification.
In the Antarctic, the stormy Southern Ocean generates up-welling. This dynamic tends to cool the ocean surface even as it transfers heat into the deeper ocean. And increasing stormy conditions surrounding Antarctica related to climate change can intensify this effect. In addition, warm bottom waters melting sea-fronting glaciers in Antarctica produce a lens of fresh water which cools the surface and also traps heat below. So the signal coming from Antarctica with regards to sea ice has tended to be more mixed — with atmospheric warming and changes in wind patterns generating more variable sea ice impacts relative to the Arctic. So this year’s sea ice losses there are more difficult to directly link to climate change even though climate change related influences on the physical system in the Antarctic and among its surrounding waters are becoming more and more apparent.
Zack Labe notes that:
The Arctic sea ice anomaly, however, fits with the ongoing Arctic amplification trend of thinning sea ice and loss of old ice. Additionally, it has been well noted in previous literature (i.e., http://onlinelibrary.wiley.com/doi/10.1029/2010GL044136/full …) concerning the increasing fall temperatures in the Arctic and possible causes.
Major Volume Losses From 2015 to 2016
Despite big losses to sea ice surrounding the Antarctic this fall, it is the Arctic where the damage and risk of further loss is most pronounced. Particularly, reductions to thicker, multi-year ice in the Arctic during 2015 to 2016 have been exceptionally severe:
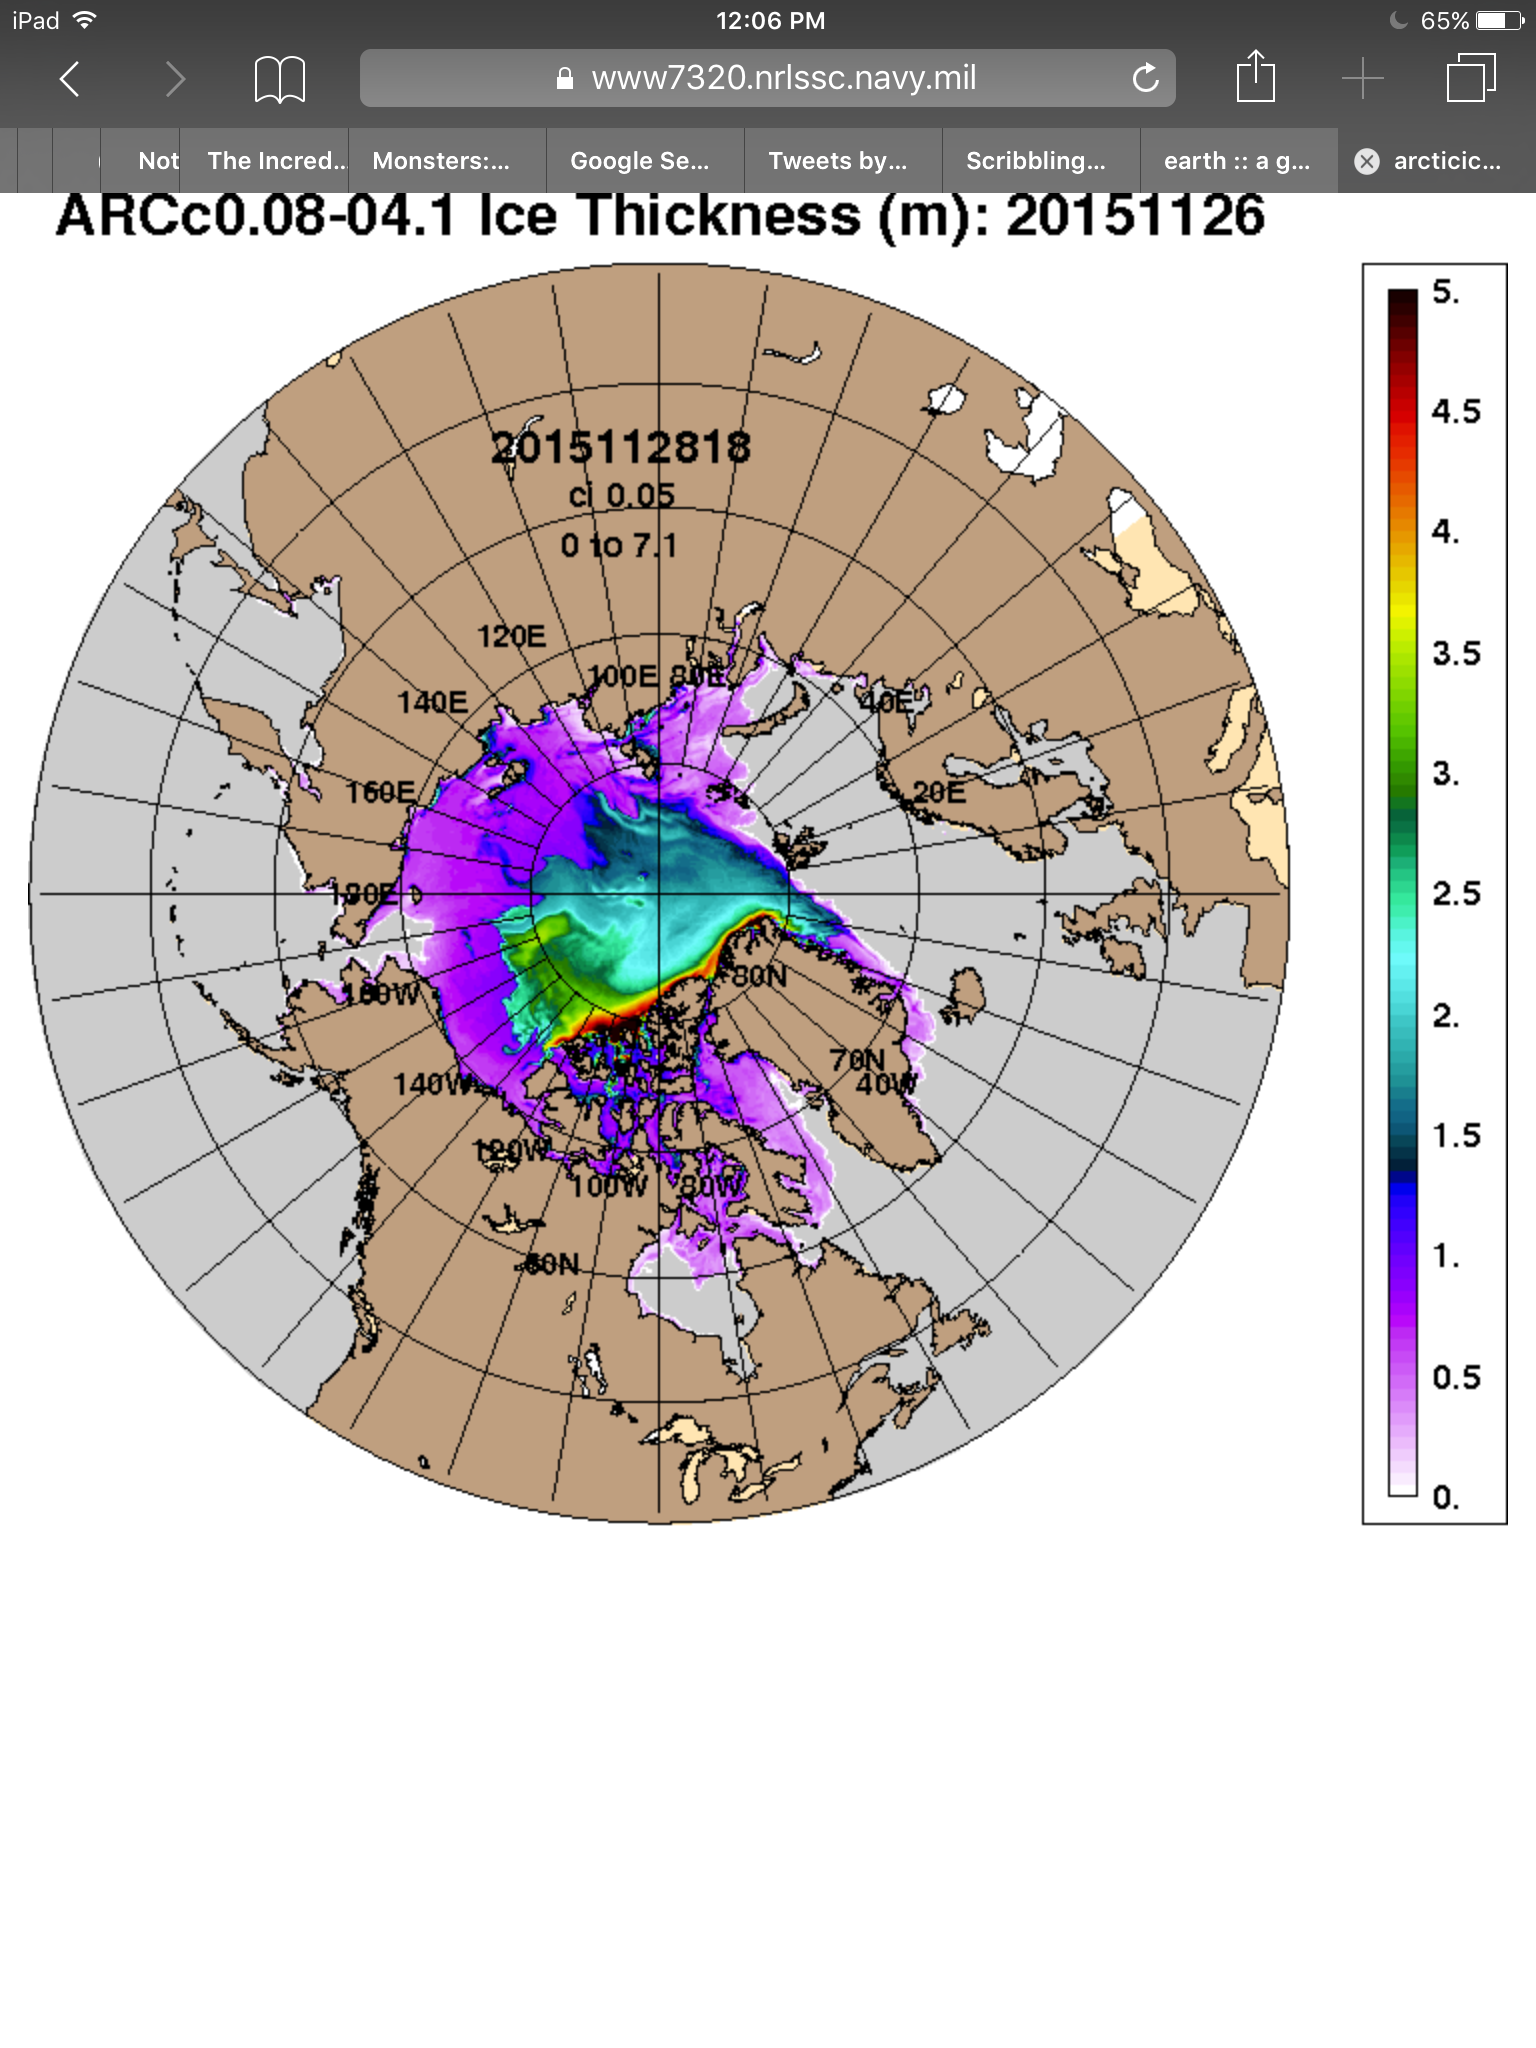
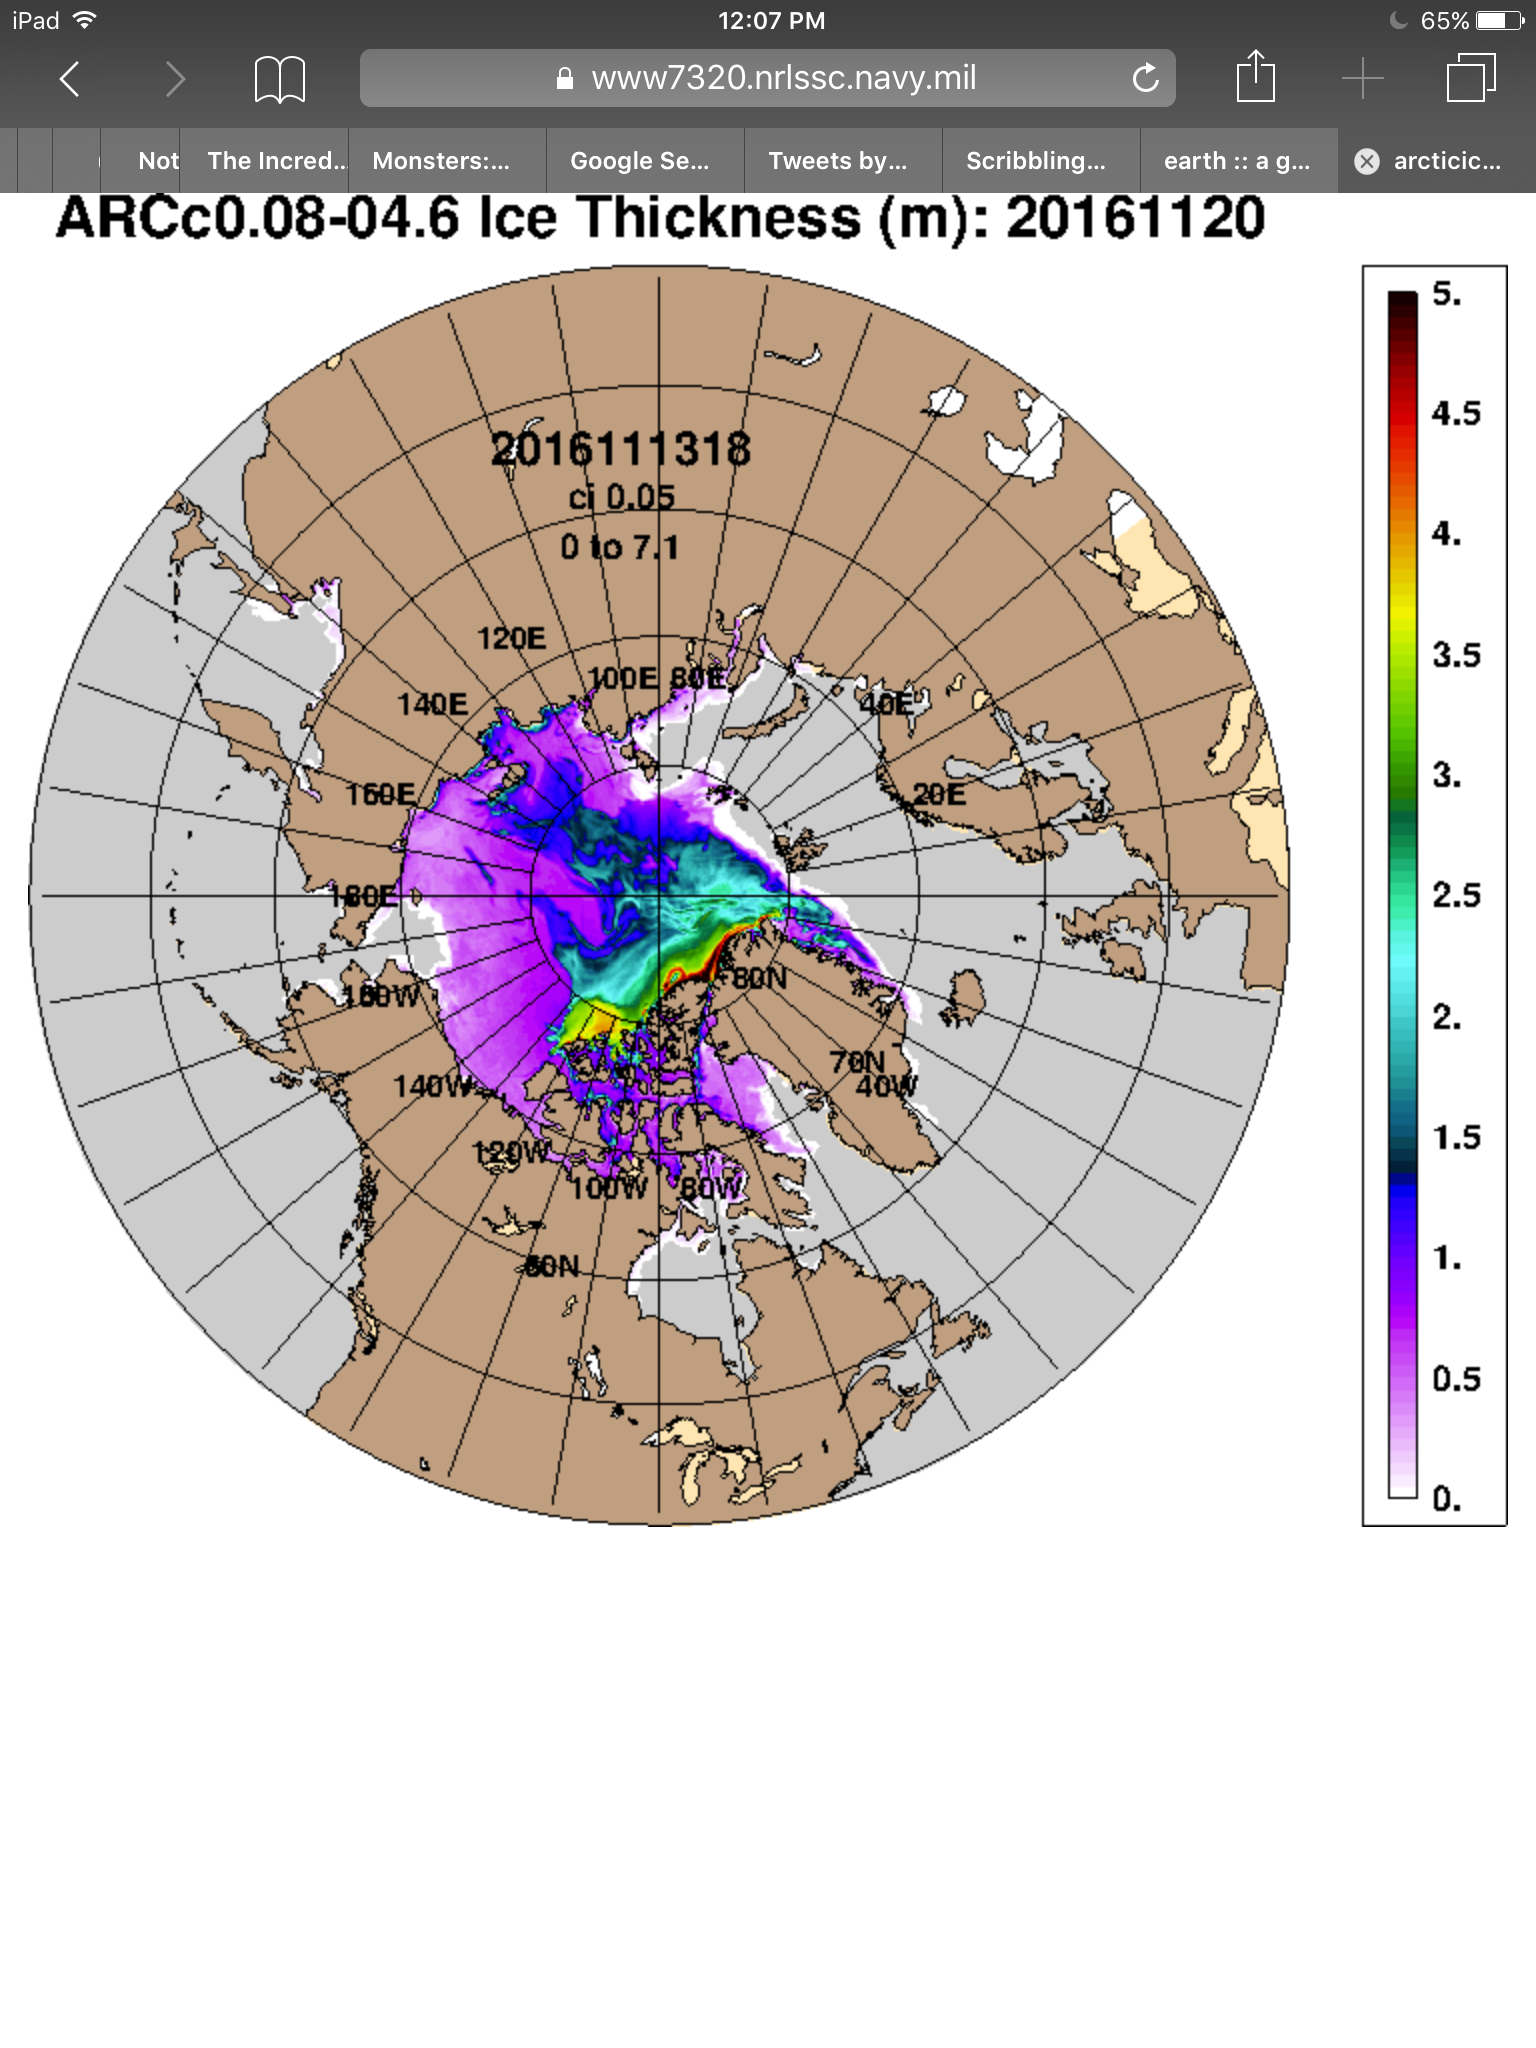
In the above images, we see a comparison between late November sea ice coverage and thickness as provided by the U.S. Navy ARCc model. The left frame represents late November of 2015 and the right frame represents projected values for November 20, 2016. Note the greatly reduced coverage in the 2016 image. But even more noteworthy is the substantial loss of thicker ice in the Arctic Ocean north of the Canadian Archipelago and Greenland.
These two images tell a tale of a great loss of sea ice volume. One that the sea ice monitor PIOMAS confirms. According to PIOMAS, ice volume values during October were tracking near lowest levels ever recorded. And continued heat into November generates a concern that a period of new record low volume levels may be on the way.
But it’s not just the record low values that should be a concern. It’s the location of the remaining thick ice that’s a worry as well. For a substantial portion of the remaining thick ice is situated near the Fram Strait. Wind and ocean currents tend to push ice out of the Arctic Ocean and through the Fram. Ice tends to then be funneled down along the coast of Greenland and on into the North Atlantic where it melts. So the fact that a big chunk of the already greatly reduced remaining thick ice now sits on the edge of the sea ice version of Niagra Falls is not a good sign.
La Nina Years Tend to Push More Heat Toward the Poles
It is notoriously difficult to accurately forecast sea ice melt and refreeze trends in the various seasonal measures for any given individual year. And even many of the top sea ice experts have had a devil of a time forecasting the behavior of sea ice during recent years. However, one thing remains quite clear — the long term trend for sea ice in the Arctic is one of rapid decline.
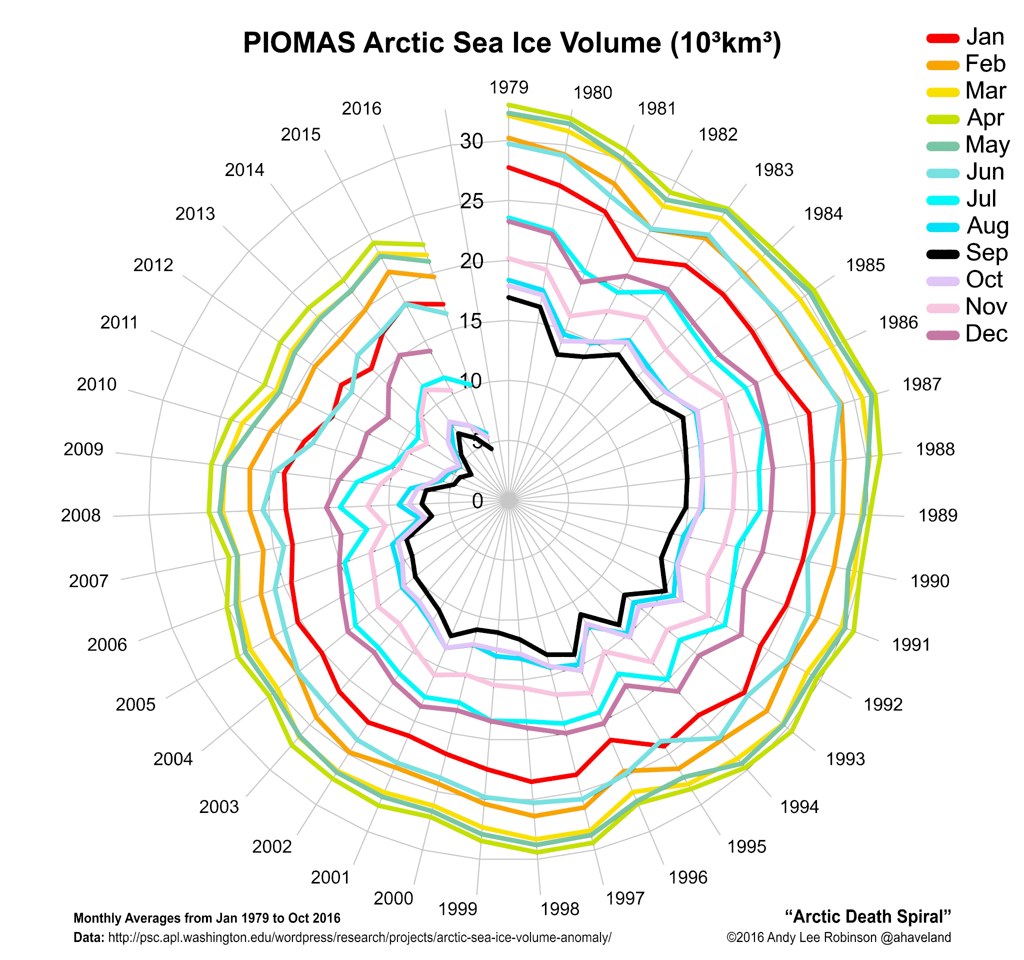
(Arctic sea ice ‘Death Spiral’ by Andy Lee Robinson. Image source: Haveland.)
We are now entering a situation where one very warm winter followed by one warmer than normal summer could push Arctic sea ice values to near the zero mark. A situation that could effectively set off a blue ocean event in the near future. A number of prominent sea ice experts have predicted that it’s likely that such a state will be achieved rather soon — by the early 2030s under current trends. Others point toward nearer-term loss potentials. But there is practically no-one now saying, as was often stated during the early 2010s, that a blue ocean event could hold off until the early 2050s.
All that said, the trajectory going into 2017 for the Arctic at present doesn’t look very good. Both sea ice extent and volume are now at or well below the previous low marks for this time of year. Remaining thick ice positioned near the Fram Strait generates a physical disadvantage to the ice in general. In addition, NOAA has announced that La Nina conditions are now present in the Equatorial Pacific. And La Nina events tend to push more ocean and atmospheric heat toward the poles — particularly toward the Arctic.
Links/Notes/Disclaimer:
Note: This article is written as a follow-on to the previous blog post — For The Arctic Ocean Above 80 North, It’s Still Summer in November — and they should be read together for context.
Disclaimer: I asked PhD student Zachary Labe to make a general comment on sea ice trends, to which he generously provided his particular take on the Arctic. I have also made my own best-shot science and observation-based analysis of the situation given current trends. Because of the fact that the present situation is new and evolving, some of my statements may well pass outside the bounds of currently accepted science. The fact that Labe commented in this post does not, in this case, mean that he agrees fully or in part with my particular initial rough analysis of the subject.
Permafrost and Arctic Sea Ice — Climate Canaries in the Coal Mine
U.S. Navy ARCc Model Sea Ice Thickness
Hat tip to Andy Lee Robinson
Hat tip to Cate
Share this:

Posted by robertscribbler on November 15, 2016
https://robertscribbler.wordpress.com/2016/11/15/from-pole-to-pole-global-sea-ice-values-are-plummeting/
A Tale of Two Ice Caps: As Arctic Ocean Heads Toward Ice-Free Summers, New Study Shows Human Warming Takes Out 56% of Antarctic Sea Ice by 2050
Thus far, the Arctic has been ground zero for human-caused climate change. A combination of sea ice melt, albedo loss, a warming ocean that transports heat beneath a melting ice cap, regions of Jet Stream retreat into the far north, and an overburden of greenhouse gasses near the pole, among other factors, have all resulted in a very rapid pace of local warming.
(Global surface temperature anomaly over the last month features a high degree of, very visible, Arctic heat amplification. Most global warming models show the Arctic warms rapidly first under human warming. Then, as second stage warming progresses, heat begins to spike over other regions of the globe. Image source: NOAA ESRL.)
While global warming totals about .8 C above the 1880s average, about 1/6th the difference between now and another ice age, but on the side of hot, Arctic warming has pushed above 3.0 C during the same time period. And as the Arctic is warming four times as fast as the rest of the globe, many of human climate change’s most extreme impacts are now visible there.
The Arctic’s Massive and Dramatic Loss of Sea Ice
A primary measure of Arctic warming has been sea ice melt. And Arctic sea ice melt during the past few decades has been nothing if not dramatic. By end of summer 2012, a time when sea ice melt is most intense, area and extent totals had fallen more than 50% below their 1979 measurements. Meanwhile, Arctic sea ice volume, a measure of area + thickness, had fallen by as much as 80%. These losses are dramatic and raise the possibility for ice free summers, if the weather conditions line up, during a period between now and 2030.
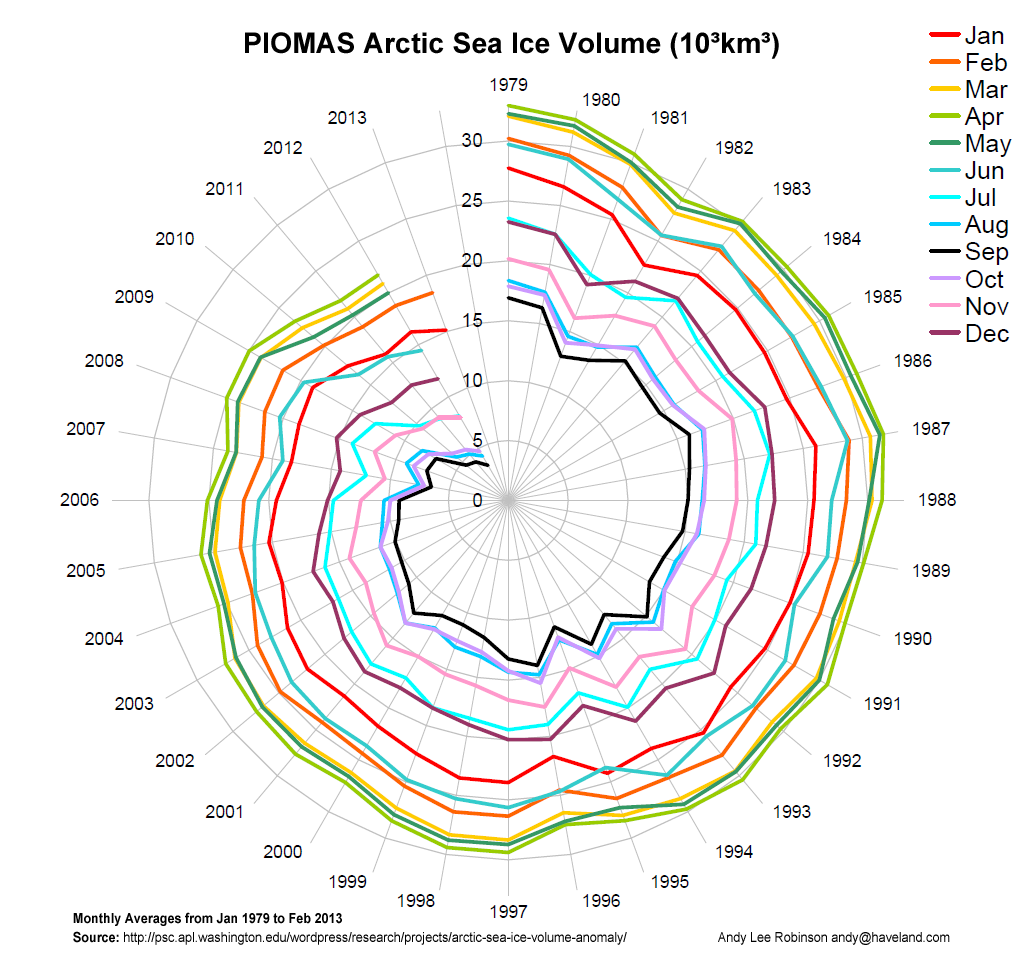
(Arctic death spiral showing sea ice volume measurements for all months from 1979 through early 2013. Image source: Skeptical Science. Data source: PIOMAS.)
Thin Ice Over Warming Water
As hinted at above, the Arctic has a number of unique characteristics that make it vulnerable to rapid warming in the context of a more slowly warming globe. And chief among these is geography — warmer continents surrounding a mostly frozen ocean.
A lion’s share of the northern polar ice cap area is composed of sea ice. By area, even after the stunning losses seen since 1979, the sea ice cap composes about 10.5 million square kilometers on average. Greenland, in contrast, only boasts an ice sheet of around 2 million square kilometers. This large layer of ice provides an amazing amount of cooling just due to its white, reflective properties. In the past, this albedo has helped to maintain a zone of very cold air centered almost directly over the pole.
But this Arctic system of cold amplification and northern refrigeration has a major Achilles heel. For the sea ice sits upon an ocean that is much closer to the melting point of water than any frozen land mass. Furthermore, all ocean systems are connected and, to one degree or another, readily transport heat.
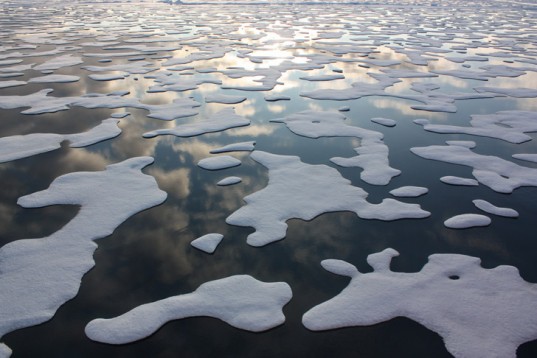
(Melting Arctic sea ice during summer. Image source: NASA.)
In the context of human-caused warming, the majority of northern polar ice area is little more than a relatively thin layer sitting atop an ocean that is rapidly collecting atmospheric heat. A context that can result in rather dramatic consequences. In short, what this means is that northern polar ice sheet inertia isn’t quite so strong as was previously hoped.
A warming ocean eats away at the bottom ice. And as the thin, frozen ice layer of white, reflective ice is, at first gradually, and then more rapidly, replaced by dark, absorptive ocean the Arctic refrigerator breaks down and, increasingly, turns into a heat amplifier. A quickening pace of albedo loss means an even more rapid pace of warming for the ocean waters below. As warmth concentrates, more feedbacks come into play. Greenhouse gasses like methane and CO2 become liberated from the ice and also go to work in setting off warming. These feedbacks work in concert and, for a time, the Arctic heat rapidly amplifies.
Arctic heat amplification is now plainly visible in winter months when heat absorbed by a mostly ice-free Arctic Ocean during summer radiates up through thin and crack-riddled ice. In this way, heat bubbling up through the ice displaces cold, Arctic air southward, sparking off severe weather. An ongoing event that was particularly extreme during the winters of 2012-2013 and 2013-2014 when Arctic air first fled south over Europe and then the central and eastern United States (see polar vortex collapse).
An extended period of heat amplification has been the story of Arctic warming ever since the world began to heat up during the 1880s. A more moderate spurt of sea ice loss coincided with the growing Arctic warmth from the 1920s to the 1950s before stalling in the 60s and 70s, only to resume with a vengeance during the 1980s. Today, the extreme of Arctic heat amplification results in a number of rather severe knock-on effects that threatens everything from even larger Arctic greenhouse gas releases (methane, CO2) and severe changes to the Jet Stream that may well wreck the periods of relatively stable weather human beings in the north have been used to for 10,000 years running.
Antarctic — Vast Continental Ice Sheets Surrounded By Oceans
Moving southward into the still frozen austral regions, we find a geography and related pace of climate change that is markedly different. Here the vast glaciers pile atop a Continent that has now been buried and frozen for millions and millions of years. The cold is locked into ice sheets that reach thousands of feet in height, cover an area of nearly 14 million square kilometers, and plunge deep into the long-frozen Earth. If the ice in the Arctic is merely a thin facade covering warmer oceans, the Antarctic ice is a thick fortress atop adamant and frozen earth.
The degree of inertia this represents for human-caused climate change is, therefore, much greater than what we see up north. And though the Antarctic fortress is far from impenetrable to the radically strong assaults of human warming, it will resist their insults for longer, giving way its great piles of ice in a more ablative fashion with, likely, even more stark and shocking results.
This densely frozen geography coming into conflict with human-caused warming has resulted in far-reaching, though less visible, impacts. Overall, largely due to the heat-insulation effect of Antarctica, southern hemisphere warming has progressed far more slowly than warming in the north. Here the battle is one of inches in which regions closer to the equator, such as Australia and the equatorial oceans, show the highest rates of warming. Meanwhile, Antarctica has remained, for the most part, a bastion of cold with increasingly intense wind fields isolating it from the more rapidly warming regions. In this case, and in contrast to the Northern Hemisphere Jet Stream, the upper level winds surrounding the South Pole have strengthened even as they have slowly receded.
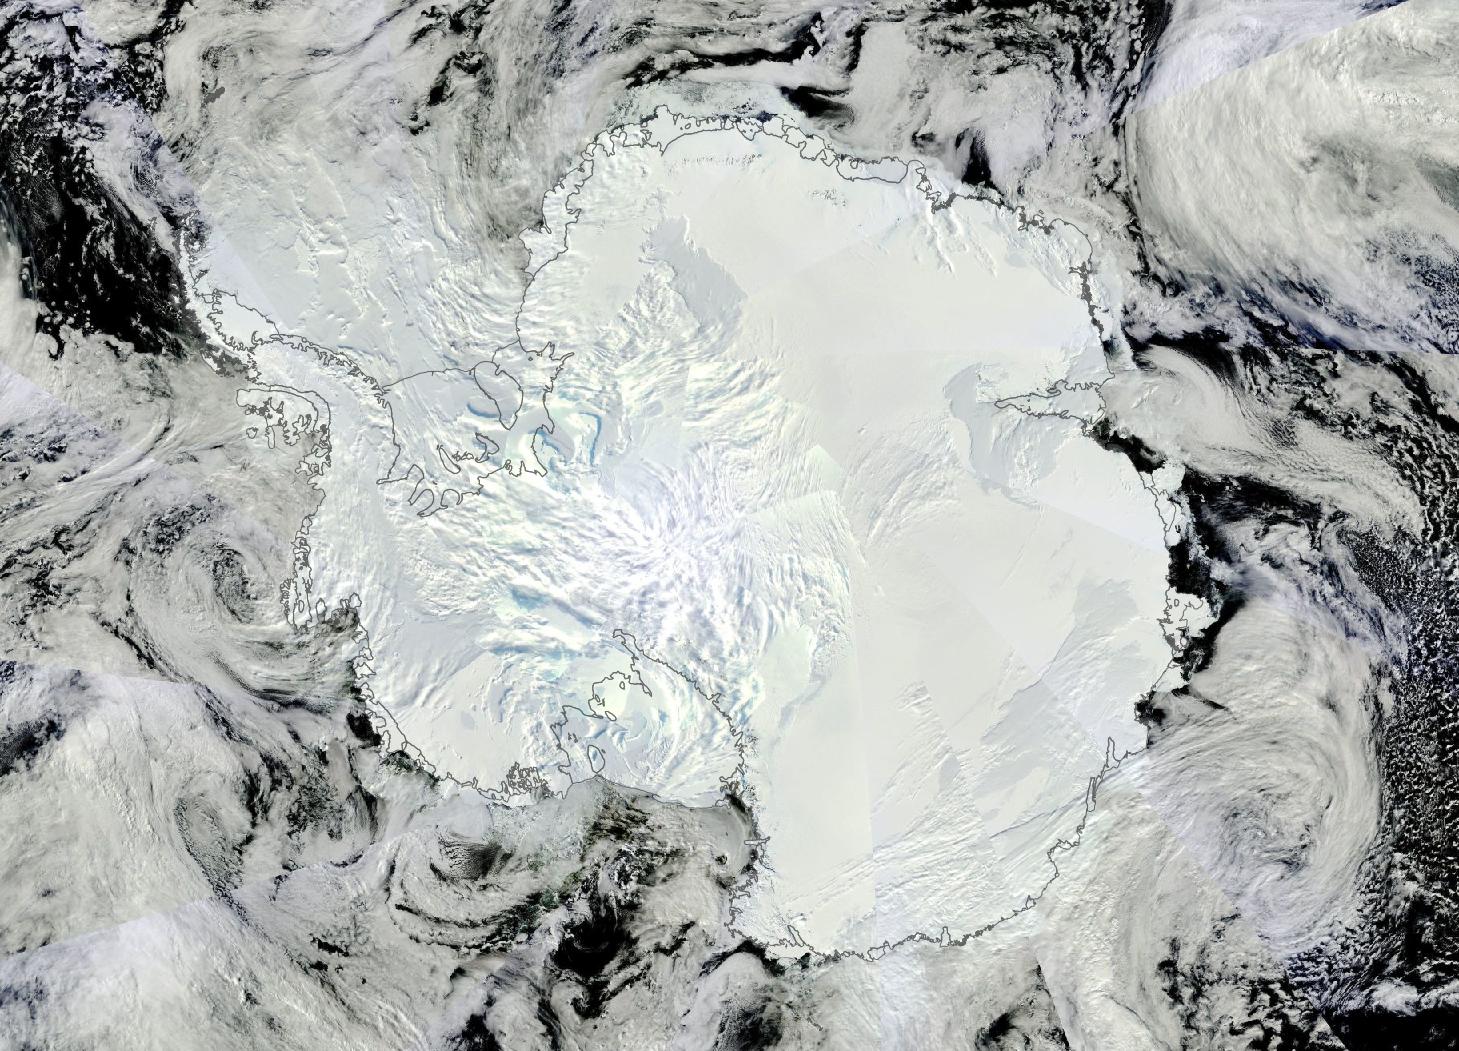
(Antarctica surrounded by storms on March 2 of 2014 as a combination of austral summer and human warming shove the Southern Hemisphere Jet Stream toward the pole. Image source: Lance-Modis.)
Such a recession resulted in very hot, dry weather for southern Australia as equatorial heat shoved the strong winds and related storms ever southward. Meanwhile, increased rates of evaporation held in check the benefits of equatorial rain expansion into northern regions. Only the occasional challenge to this new, retreating Jet Stream, breaks the pattern of expanding drought in the south with extraordinary precipitation and storm events. And so Australia has suffered a series of worst droughts and fires on record interrupted by brief but very intense rain events over the past decade.
While the vast ice sheets of Antarctica have, so far, served as a buttress against atmospheric warming even as the Jet Stream retreated southward, heat in the ocean again went to work. Though mostly protected by vast and frozen continental lands to the west, the more northerly segment of East Antarctica featured large sections of submerged continents upon which rested immense, sea terminating ice sheets. Some of these great ice sheets had sections submerged hundreds of feet below sea level. And though the surface waters only gradually warmed, deeper down, the story was much different.
The endless calving of Antarctica’s glaciers sends off thousands of ice bergs from the shores of Antarctica each year. This massive calving cools the surface waters near Antarctica through both the melting of these frozen hills and mountains as well as the chilling effect they have on nearby air currents. As such, cold waters continually flow out from Antarctica. But even these waters have been impacted by human caused climate change, grudgingly increasing in temperature over the decades.
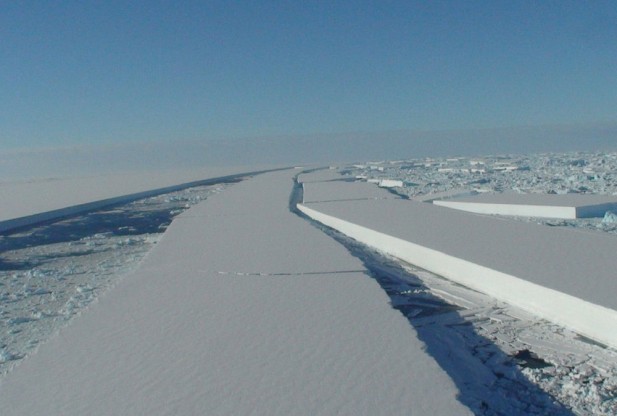
(Pine Island Glacier calves into the Amundsen Sea. A recent study found this large ice sheet was in the first stages of irreversible collapse. Image source: iSTAR-NERC.)
If the cold surface waters surrounding Antarctica have warmed only slowly, the story of the depths is somewhat different. Down-welling warmer and saltier waters contacting the Antarctic Circumpolar Current create a growing pool of warmth extending to the Antarctic Continental Shelf boundary. There, water circulation dynamics cause the warm water in the abyss to up-well even as it contacts the ocean terminating polar ice sheets.
The warm water thus eats away at the undersides of these ice sheets, causing increasing instability in some of the most vulnerable regions of West Antarctica. This heat transfer from the ocean depths has set off a significant erosion in a number of very large ice sheets and is now spurring the massive Pine Island Glacier (PIG) into an unstoppable rush to the sea.
Models Show Antarctic Sea Ice to Rapidly Decline through Mid Century
If Antarctic warming has been more subtle than the explosive heat amplification of northern regions, it is no less ominous. At the very least, it resulted in locking in 1-2 meters of sea level rise through irreversible ice sheet collapse spurred by warm water upwelling and now puts at risk many more meters of eventual increases to follow.
But, at the surface of the waters, despite a period of slowly rising warmth, the buffer zone of Antarctic sea ice has remained somewhat stable since 1979, even showing periods of moderate increase in overall area and extent. As described above, this is in marked contrast to a stunning collapse of Northern Hemisphere sea ice. A contrast that has served as foil for much debate over the ongoing impacts of human warming even as it was exploited as fodder by climate change deniers, when they weren’t out chasing the most recent snowstorm.
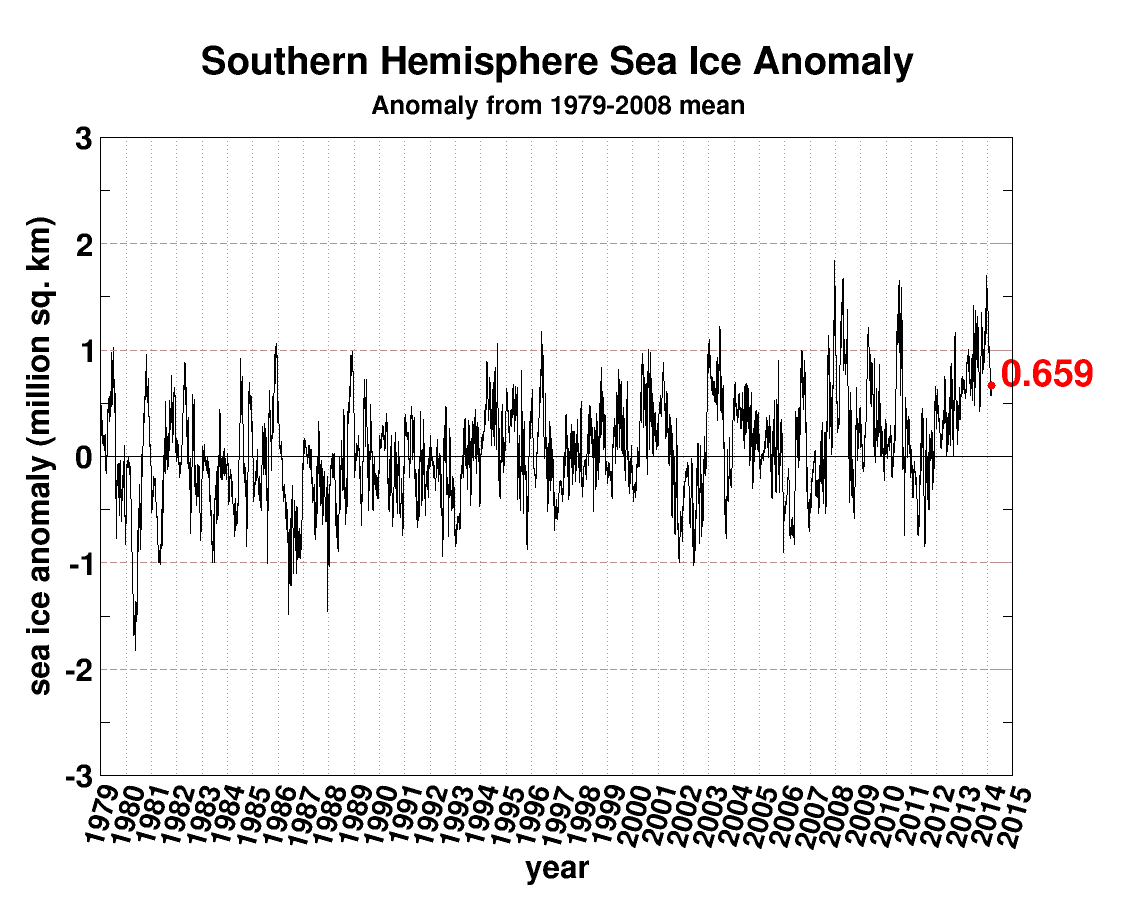
(Antarctic sea ice area anomaly since 1979 shows a slight increase in overall coverage, primarily due to a counter-trend increase in Ross Sea ice coverage. New studies show Antarctic sea ice is now set to rapidly decline. Image source: Cryosphere Today.)
Looking more closely, though, one finds that the current expansion of Antarctic sea ice may well be very precarious. For of the three embayments containing Antarctic sea ice only one — the Ross Sea — has shown sea ice growth in recent years. The other two have either remained stable or shown slow recession.
Polar researchers had attributed the moderate net expansion of southern sea ice to a combination of increasingly strong winds spreading out Ross ice flows during winter, a freshening of surface waters through the ongoing melt of Antarctica’s ice sheets that increases the melt temperature of ice and thus encourages its formation, and to changes to ocean currents and rates of precipitation. Now, a new study conducted by researchers at the Virginia Institute of Marine Science has found that this relative period of Ross sea ice stability and growth is about to end.
Warmth About to Crash Through Antarctica’s Gates
The various fragile conditions that have conspired to expand Ross Sea ice are now about to collapse under an onrush of increasing temperatures. For according to a new study entitled The Effects of Changing Winds and Temperatures on the Oceanography of the Ross Sea During the 21rst Century high resolution climate models show both increasing temperatures and rapidly melting ice in this critical and climatologically sensitive region under a regime of business as usual fossil fuel emissions.
According to the study’s authors:
We examined the effects of projected changes in atmospheric temperatures and winds on aspects of the ocean circulation likely important to primary production using a high-resolution sea ice–ocean–ice shelf model of the Ross Sea. The modeled summer sea ice concentrations decreased by 56% by 2050 and 78% by 2100.
In short, the bounding Jet Stream, the insulating continental Antarctic ice, and the cold surface waters surrounding the continent can’t keep out an ever increasing level of human-caused warming indefinitely. Over the coming decades this warmth will pulse higher in the region surrounding Antarctica with profound impacts to sea ice, resulting in a more than 50% reduction by 2050 and a 78% reduction by 2100.
The study also found that:
The ice-free season also grew much longer, with the mean day of retreat in 2100 occurring 11 days earlier and the advance occurring 16 days later than now.
In essence, the spring and summer melt season throughout the Antarctic region was shown to extend nearly one month longer than today’s period of melt and warmth. Such an expansion of heat intensity and duration will have profound impacts not only for sea ice, but for land ice and for life in the oceans as well.
Mixing Layers Reduced, Large Phytoplankton Blooms to Follow
Perhaps less visible but somewhat more ominous are ocean changes that are projected as Antarctic sea ice goes into rapid decline. Study authors found that ocean mixing over the region would fall by 12% by 2050 and a remarkable 44% by 2100. This dramatically increased stratification would, at first, result in very large blooms of phytoplankton as the surface waters see far more oxygen and the depths become ever-more deprived. This riot of microbial life may seem a positive development for the Ross Sea. But, if anything, it is a sign of oceanic productive zones moving southward to the polar region.
More ominous is the impact on krill and larger animals dependent on these small swimmers. Sea ice is critical to the survival of many krill species. And with its decline, these marine animals are likely to be negatively impacted.
According to lead author, Dr. Walker Smith:
our results suggest that phytoplankton production will increase and become more diatomaceous. Other components of the Ross Sea food web will likely be severely disrupted, creating significant but unpredictable impacts on the ocean’s most pristine ecosystem.
Links:
Arctic Sea Ice Melt, Methane Release Shows Amplifying Feedbacks to Human-Caused Climate Change
Arctic Heat Wave to Rip Polar Vortex in Half
Scientists: Ocean Warming, Upwelling to Make an End to Antarctica’s Vast Pine Island Glacier
Share this:

Posted by robertscribbler on March 3, 2014
https://robertscribbler.wordpress.com/2014/03/03/a-tale-of-two-ice-caps-new-study-shows-human-warming-takes-out-56-of-antarctic-sea-ice-by-2050/
Please Help Support Our Ongoing Efforts

Climate of Pandemic — A COVID-19 Special Report

GROWTH SHOCK

Luthiel’s Song: Dreams of the Ringed Vale

Luthiel’s Song: The War of Mists

Climate Progress

The Secular Jurist

Exposing Misinformation Spread by Anthony Watts

Colorado Bob’s Climate Feed

Arctic Sea Ice Blog

Science Blogs

Climate State

