City-Threatening Wildfires — The North’s New Climate Future

That great roaring sound you’re hearing may just be another 3.6 billion dollar climate disaster…

*****

Reports are in and it’s official — the Fort McMurray Fire was the costliest disaster ever to impact Canada. According to the Insurance Bureau of Canada (IBC), claims of damages for the massive Alberta wildfire have now topped 3.6 billion dollars. That’s worse than the Alberta floods of 2013 at 1.8 billion dollars (ranked third), and worse than the great Quebec ice storm of 1998 which inflicted 1.9 billion dollars (in 2014 dollars) in damages.

Pyrocumulous cloud

(Fires in northern regions and within the Arctic are now so energetic that they often produce pyrocumulus clouds — like this one which was thrown off by the Fort McMurray Fire.)

CEO Don Forgeron of IBC stated that the damage from the fires provide “alarming evidence” that extreme weather events have increased in frequency and severity in Canada. And that’s especially true for wildfires — which are being worsened by a climate change driven warming. The added heat is lengthening the fire season in Northern Latitudes even as it is generating temperatures that are inhospitable to trees that have adapted to live in much cooler climates. It’s also thawing the permafrost — which adds more peat-like fuels for fires to burn.

The Fort McMurray fire erupted under these new climate conditions and under temperatures that were 40 degrees (Fahrenheit) above average at the time of ignition. It forced the entire city of Fort McMurray to empty. It resulted in the evacuation of 90,000 people, the (darkly ironic) temporary shut down of various fossil fuel production facilities, and leveled 2,400 structures. Many more structures were damaged due to smoke or falling embers. In total, more than 27,000 property claims were filed.

Dozens of massive wildfires Siberia

(Dozens of massive wildfires burn through Central Siberia on July 7th of 2016 in this LANCE MODIS satellite shot. For reference, bottom edge of frame is 220 miles. These kinds of events, according to Greenpeace, burned 8.5 million acres last year in Russia. It’s a new climate context that is turning northern regions into a fire hot zone and it’s not at all normal.)

Unfortunately, this fire is unlikely to be a one-off event. Year after year, an Arctic warming at 2.5 to 3 times the rate of the rest of the globe pulls heat northward. Earlier thaws and added fuels combine explosively with swaths of dead trees killed by rampaging invasive species that have arrived from the south. No northern or Arctic nation has been untouched by the extreme fires. Alaska, Canada, and Siberian Russia have all seen extraordinary and massive fires during recent years. Fires that throw great pulses of heat and burning debris high into thunderheads of flame called pyrocumulus clouds. A word that climate change has now added to the popular lingo.

Links/Attribution/Statements:

LANCE MODIS

Last Damage Estimate For Fort McMurray Fire 3.6 Billion

The Climate Context For the Fort McMurray Fire

Hat tip to Colorado Bob

Monitor Shows Carbon Monoxide Spikes to 40,000 Parts Per Billion over California on February 26 — What the Heck is Going On?

Hint: it’s a glitch.

*****

On February 26, The Global Forecast System model recorded an (unconfirmed) intense and wide-ranging carbon monoxide (CO) spike over the US West Coast. A region stretching from British Columbia, through Washington and Oregon, and on over most of California experienced CO readings ranging from about 5,000 parts per billion over the mountains of Southwestern Canada to as high as 40,000 parts per billion over Southern California. Very high peak readings appear to have occurred from Northern California near Eureka and along a line south and eastward over much of Central California to an extreme peak zone just north and west of Los Angeles near Palmdale.

40000 ppbv

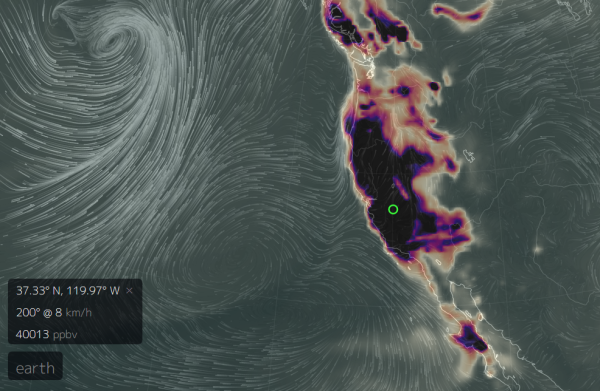
(Very large [unconfirmed] CO spike over Western North America near major geological features on February 26, 2016. Image source: Earth Nullschool.)

For reference, these (unconfirmed) readings in the Nullschool Monitor were between 25 and 200 times above typical background CO levels of about 200 parts per billion and up to twelve times higher than second highest peak readings over polluted regions of China during the same period.

Major Spike Appeared in Just 3 Hours Starting February 25th

Human-based carbon monoxide sources are not generally known to produce spike readings so high and so wide-ranging over such a short interval of time. It would typically take a considerable emission many days to build up under a stagnant air mass. And, to this point, we do have a couple of dome high pressure systems which have tended to form near the California region over recent days. That said, surface winds in the region at 5-15 mph over most areas could hardly be considered stagnant. In addition, the current spike appears over an interval of three hours in the Nullschool data — going from zero coverage to covering all of California and parts of Nevada, Oregon, Washington and BC over that single short interval. It’s a very brief period for such a large and wide-ranging peak reading to appear so soon. One that would require a rather extraordinary pulse of pollution to produce the readings indicated on February 25-26.

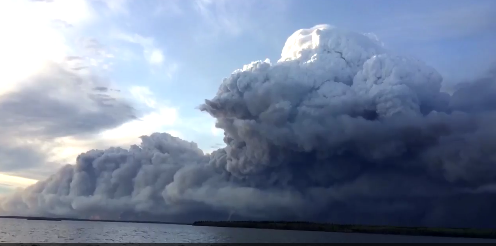
Wildfires could produce a longer-term emissions spike under stagnant air as well. However, the wildfires now reported for California are small and isolated. They have flared, off and on, under drought conditions, for weeks without resulting in any significant large fire outbreaks or related major pollution spikes. So it appears unlikely that they are the source of the current burst. Other events related to the ongoing California drought may have had an impact (apparently, burning of desiccated trees from California’s orchards is currently quite widespread due to ongoing drought conditions remaining in place since 2012). However, such instances would have to have been very sudden and wide-ranging to produce the spike we saw on the 25th and 26th.  Canadian wildfires — of which there have been very small and low intensity hotspot events recently (noteworthy due to their anomalous appearance out of season, if not for their intensity)  — were very far from peak readings in California and did not produce even a moderate level of emissions (undetectable from the visible MODIS sensor).

The Earthquake Precursor Hypothesis

A final suspect for this preliminary observation (which has gotten much hype in social media circles over recent days) is geological. As the apparent spike in the monitor occurs over large fault lines, volcanoes, and above other active geological features along the US and Canadian West, it appears that activity within these features might have produced a brief if intense burp of this gas. Sulfur dioxide (SO2) readings — another geological gas — were also elevated in the monitor, with peak readings again appearing in Southwestern California.

It’s worth noting that no major US or Canadian geological organization has yet made any report on this particularly large CO spike. However, a piece of scientific research in Nature Asia, by K. S. Jayaraman notes that major CO and SO2 spikes may be an indication that future earthquake activity is on the way. According to Nature this kind of intense CO spike occurred prior to a 7.6 magnitude earthquake that shook Gujara in 2001 killing 20,000 people:

Singh said that CO levels were taken by an instrument onboard NASA’s Terra satellite — launched in 2009 — circling the earth in a polar orbit at a height of 705 km. The instrument measures CO concentrations at different heights and also computes the total amount of the gas in a vertical column of air above the earth surface.

Analysis of the satellite data showed a large peak in CO concentrations during January 19 and 20 — a week before the main earthquake event. On January 19, the total CO in the vertical column was also higher than usual. After the 26 January earthquake the concentration of the gas dropped.

According to the scientists, CO gas is forced out of the earth due to the build up of stress prior to the earthquake “influencing the hydrological regime around the epicentre.”

But before we tilt too far into alarmism on this particular possibility, we should consider the fact that the above paper appears to have had no confirmation or further comment in the sciences at this time. So the predictive usefulness of large CO spikes prior to earthquakes remains quite uncertain. And, as noted above, no major geological information outlet has made any warning or comment on earthquake risk.

Furthermore, there’s been no observed spike in earthquake activity along any of the major fault lines over the past week according to USGS observations. Contrary to what some irresponsible analysts have been implying, earthquake activity in the California region over the past 7 days was well within the normal range. At 161 over the past week, this small number is not indicative of any abnormal activity near the various active fault lines. Each year, Southern California alone experiences 10,000 earthquakes, most of which are so small that people don’t even feel them.

The US geological survey also maintains that:

There is no scientifically plausible way of predicting the occurrence of a particular earthquake. The USGS can and does make statements about earthquake rates, describing the places most likely to produce earthquakes in the long term. It is important to note that prediction, as people expect it, requires predicting the magnitude, timing, and location of the future earthquake, which is not currently possible.

Thus the apparent, current very large West Coast CO spike near major fault lines (and over regions suffering from what is now a very severe five-year drought) in this particular monitor remains a bit of a mystery.

Or is it all Just a Glitch?

Considering that all the wildfire and human potential sources for the CO pulse are unlikely to produce the spike in the Nullschool data, that we have no warning of potential impending geological activity from the major agencies, and that we have had no other reports from related agencies to confirm the spike, we should also consider that there may well be something wrong with the monitor. Artifacts can appear in the satellite model data and it’s not unheard of to get a spike reading due to other signals impacting how physical models interpret sensor data.

Carbon Monoxide Hourly Observations San Bernandino

(Hourly carbon monoxide observations in Central San Bernardino do not match high surface CO measures recorded by the GEOS 5 model. Similar lower atmospheric readings come from station observations throughout Southern and Central California. Image source: California AMQD.)

To this point, lack of confirmation at ground reporting stations for high CO readings appearing in the GEOS 5 monitor increase the likelihood that these high peak readings were a glitch or an artifact in the physical data. A cursory view of local warnings shows no local CO air quality alerts for the areas indicated in the Nullschool data set (You can view a list of the local monitors here). Analysis of this data also shows much lower CO readings from these stations in the range of 400 to 1200 parts per billion — quite a bit lower than what the GEOS 5 monitor is showing.

So what we have is one model showing a very high CO spike, but none of the related ground monitors picking it up. Since there are hundreds of ground stations in this region, it seems quite a bit less likely that there is something wrong with each of the readings coming from these stations than from the GEOS 5 model itself.

This begs the question — was there some kind of false positive that confused GEOS 5? Was there some other signal that tripped the model to show such a high reading? But to these points, a general lack of overall confirmation from the hundreds of ground sensors scattered across the region seems to point to the likelihood that such elevated readings in the GEOS 5 monitor were a glitch, an artifact, or a false reading for this atmospheric level.

UPDATED: Final Confirmation — It’s A Model Algorithm Error

Dr. Gavin Schmidt, head of GISS NASA, has confirmed the glitch in his twitter feed which you can read here. He notes:

The Elevated Carbon Monoxide concentrations in the GEOS 5 products since February 25 of 2016 are incorrect. They are the consequence of unrealistic CO emissions computed by our biomass burning algorithm, which is based on satellite observation of fires… GMAO is working to correct this problem.

An excellent further explanation has been given by Bryan, a blogger over at Of Tech and Learning. His explanation is as follows:

“It’s pure coincidence that at MOPITT resumed data collection over western North America while its operating temperature was still stabilizing. Had the instrument’s temperature remained unstable for a few days, it would have looked like the whole globe was erupting gas. If MOPITT has started collecting data over the south pole, open ocean, or some other obscure location, I doubt anyone would have noticed and made a big fuss. MOPITT uses light collected in the infrared part of the spectrum. Based on Terra’s system status, the CO, CO2 and SO2 data collected by MOPITT on the 25th and 26th of February should be highly suspect. On the Earth map, the CO, CO2, and SO2 levels spike sometime between 1pm and 4pm Pacific time on Feb. 25th, which is between 2100 UTC on the 25th and 0000 UTC on the 26th. This is precisely during the time window when MOPITT’s operating temperature is still unstable.”

So a glitch does appear to be the cause of the current CO spike in the Nullschool data.

Links:

Earth Nullschool

AMQD Data

Dr Gavin Schmidt’s Twitter Feed

Active Fire Maps

Canadian Fire Maps

Cascadia Subduction Zone

The San Andreas Fault Line

Carbon Monoxide May Signal Earthquake

Paradise Burning

Copernicus Monitoring System

An Explanation of Carbon Monoxide Concentrations on US West Coast

Hat tip to Mike

Hat tip to MlParrish

Hat tip to WeHappyFew

Hat tip to Coopgeek

Hat tip to Greg

Hat tip to Bryan

Hat tip to FishOutofWater

Hat tip to Jim Benison

Summer 2014 Melt Season to Ramp up in Early May Heat Wave: Fixed Jet Stream, Dual Ridges Form Sea Ice Achilles Heel

For many months the weather pattern has been essentially fixed. A ridge over China and Eastern Russia combined with warm air flows over Central Asia to amplify heat from Siberia and on into the Arctic Ocean. On the other side of the Pacific, a harmonic pattern involving warm southerly air flows over Alaska and Western Canada has also transported an inordinate amount of highly anomalous heat into the Arctic.

These warm ridges have been consistently reinforced by high amplitude Jet Stream waves. During the Winter of 2013-2014, these same atmospheric heat transport engines collapsed the polar vortex, causing melt, avalanches, and 60 degree F temperatures for Alaska in January all while pulling Arctic air down over the Eastern United States throughout the winter months.

For Alaska, Western Canada and the Eastern US, it is a general pattern that has now lasted nearly 14 months. A blocking pattern that weather historians everywhere should take note of as a general evidence of atmospheric changes resulting from human-caused warming and a validation in observation to the findings of Dr. Jennifer Francis.

Early Season Melt in the Bering Sea

This warm air flow also severely retarded sea ice formation in the Bering Sea between Alaska and far Eastern Russia throughout winter. Now, this poorly formed ice is rapidly melting out as a barrage of storms and continued warm, southerly air flows result in ongoing degradation. Recent observations show a rather extreme loss of sea ice in this region over the past 18 days:

Bering and Chukchi Seas April 10Bering and Chukchi Seas April 27

(LANCE-MODIS comparison of Bering and Chukchi Sea Ice on April 10 [left image] and April 27 [right image]. Image source: LANCE MODIS. Hat Tip to Arctic Sea Ice Forums Poster Frivolousz21.)

As we can clearly see in the two images above, both snow cover and sea ice have experienced severe losses in this region from April 10 to April 27. Warm southerly winds have continued to push ice northward enhancing melt as temperatures typically remained near or above -2 C (the temperature at which sea ice begins to melt) in most regions. Snow losses amplified warmer than freezing water flows into adjacent ocean basins, also enhancing sea ice losses as land masses continued to warm.

Heat Pulse for Bering, Chukchi, East Siberian and Beaufort Seas

Over the next six days, this general warming trend is expected to spike, bringing with it a front of much hotter than usual temperatures extending along a broad zone of the Arctic Ocean north of Canada, Alaska and East Siberia and nearly reaching the North Pole at maximum extent.

The pulse is expected to bring 18-32 F above average temperatures for this region, pushing daily highs into the mid 30s to mid 40s over the Arctic Ocean and to nearly 50 F over waters directly adjacent to the Alaskan coast. GFS model runs for May 2, 2014 show this powerful warm air invasion, indicated by the wave of green on the map below, extending well into the Arctic Ocean with extraordinarily warm temperatures in the mid-to-upper 60s over a broad swath of Central Alaska:

Arctic Heatwave Friday May 2

(GFS temperature model for May 2, 2014. Image source: University of Maine.)

Such an intense warm pulse will greatly involve the Bering, the Chukchi, the East Siberian and Beaufort Seas. It will likely most significantly impact sea ice in regions of the Bering Sea and near-shore zones of the Chukchi and Beaufort. The early season heat wave may also enhance the ice weakening process throughout the affected zone by softening the sea ice and by creating the potential for melt pond formation.

The Major Impact of Early Season Melt Pond Formation

During May and June, early melt pond formation can have a dramatic impact on sea ice melt much later in the season as the darker pools reduce ice sheet albedo serving as a kind of heat lens that bores down through the ice surface. Eventually, the melt ponds connect, forming larger and larger volumes over the ice face until the sea ice is almost completely overwhelmed. In the last phase, melt breaks down through the ice surface to contact the ocean. At this point, the sea ice is typically splintered into much smaller and disassociated fragments.

A recent paper in the journal Nature has found that a multiplication of such early season melt ponds may well be a predictive indicator of end season sea ice extent, area and volume values come September.

The paper notes:

Our simulations show that melt ponds start to form in May, a maximum extent of 18% is reached in the climatological mean at mid-July, and there are hardly any exposed ponds left by mid-August. The strong interannual variability and the positive trend are striking. Whereas in 1996, the year with the highest September ice extent since 1979, the maximum pond fraction reaches only 11%, in 2012, the year with the lowest September ice extent, up to 34% of the sea ice is covered by ponds.

Neven over at the Arctic Ice Blog recently provided an excellent assessment of the impact of melt ponds which is available here.

Massive interconnection of sea ice melt ponds

(Major expanse of dark sea ice melt ponds in the Chukchi Sea during June of 2010. Image source: The Polaris Project.)

Achilles Heel For the Arctic During the Summer of 2014

The most recent hot pulse for this region may just be the first of many as the spring and summer melt season progresses. Jet Stream patterns continue to remain fixed, delivering much hotter than normal temperatures throughout the Western Canadian, Alaskan, and East Siberian regions. Furthermore, snow cover losses for these regions are particularly well advanced further enhancing the likelihood of warm air invasions from these rapidly heating continental zones. Anomalously large and extreme early season fires may also result in a degree of albedo loss as smoke and soot is drawn northward to darken both remaining snow cover and sea ice.

As such, this zone represents a kind of sea ice Achilles heel as the 2014 melt season progresses. If we do see major losses and a progression toward record melt, it will likely come as a result of extreme weather patterns emerging from the continental zones spanning East Siberia, Alaska and Western Canada.

Links:

LANCE MODIS

Arctic Sea Ice Forums

University of Maine

Global Forecast System Model

More on Melt Ponds

September Sea Ice Minimum Predicted By Sea Ice Melt Pond Fraction


Wildfires Burn More Than 1 Million Acres in Quebec, Canada; 121 Firefighters Called in For Help

On May 25th, a large thunderstorm ignited wildfires across Quebec. They have been burning ever since.

In total, more than 1 million acres (or about 1000 square miles) of forest had burned as of July 9th. The fires had become so severe that by July 5th, they’d shut off power to more than 500,000 residents (10% of the Quebec population), prompted Quebec to declare a state of emergency, and threatened many towns throughout the region. A vast pall of smoke hung over much of the area, stretching as far as Ontario, some 400 miles away, where severe smog resulted in air hazard, health warnings, and pleas from officials for residents to limit driving.

The following video provides an excellent description of this major fire-related smog event:

Temporary relief came when rains swept through the area on July 7th and 8th. But the fires quickly recovered causing Quebec to send out pleas for additional fire crews from the Northeastern US and broader Canada. So far, Maine, Massachusetts and British Columbia have responded by sending a total of 121 firefighters to battle the massive blazes.

Quebec Wildfires

(Quebec Wildfires on July 9th. Image source: Lance-Modis)

In the above Aqua satellite image provided by NASA, you can see a number of these large fires burning in the vicinity of southern Hudson bay in the northwest region of Quebec. The fires still raged after a number of rainstorms swept through the area on July 7th and 8th.

Adding insult to injury, a train carrying 72 cars laden with crude oil derailed and exploded in the Quebec town of Lac Megantic, likely killing 50 people and forcing over 2,000 to evacuate. The wildfires and oil train explosion formed a hot concoction of global warming and Canadian dependence on petroleum this week that made for a very volatile, damaging and deadly mixture.

Conditions in Context

Northern Quebec is yet one more Arctic region to experience large wildfires this summer. Northern Canada, Alaska and Siberia have all also seen large and powerful fires burning near or above the Arctic circle. Most fires have been ignited by dry or heat-wave conditions. In the case of Canada, Alaska and Siberia, temperatures surged from the high 80s to the mid 90s. One central Alaska location recorded an all-time record of 98 degrees Fahrenheit. Resulting thunderstorms in these areas sparked massive tundra, peat, and arboreal forest fires.

These Arctic wildfires and heat waves are particularly disturbing when you factor in a new Los Alamos study showing that soot from forest fires is a more powerful amplifying feedback to human warming than previously estimated. Soot generated from this burning is more local to remaining sea and land ice. Wind and weather can deposit this soot onto icy regions reducing their albedo and hampering their resilience to the 24 hour summer sun.

These fires also occur in a region that is, increasingly, emitting more and more methane and carbon dioxide into the atmosphere — additional amplifying feedbacks that contribute both to Arctic warming and to larger global warming. High volumes of methane in tundra, peat, and permafrost melt lakes may also provide trigger zones that ignite these kinds of Arctic fires. In these areas, methane concentrations are sometimes high enough to burn if ignited by a spark, lightning, or a wildfire raging in the area. Though it seems counter-intuitive, these combined conditions may make the Arctic one of the most vulnerable regions to burning from massive fires as the effects of human global warming progress.

The northwestern area of Quebec primarily features arboreal forest. But sporadic regions of permafrost dot the area and melt/decay of this permafrost has been particularly rapid as warmth has advanced northward over the past few decades. This year, the driest spring and early summer in 40 years led to conditions that would encourage the record burning from May to July. As of July 9th, three very large fires were still raging in the vicinity of James Bay, some of them devouring woodlands at a speed of near 20 miles per hour.

A strong low pressure system is forming over Quebec today and is predicted to deepen before moving northeast by Saturday. This storm may bring more rains to the fire stricken area. As of today, there were some reports of light rain, high humidity and fog. All conditions that are likely to aid firefighting and containment efforts. It is worth noting that, thus far, rainfall has not been enough to alleviate record dry conditions in the area. It is also worth pointing out that fires rapidly re-surged to dangerous levels after previous rains fell in early July. So firefighters and communities in Quebec may be in it for the long haul.

Links:

BC Sends 100 Firefighters to Quebec

Quebec Families told 30 Missing After Train Crash are Likely Dead

15 Massachusetts Firefighters Sent to Quebec to Battle Massive Blazes

Extreme Jet Stream Pulls Two Rivers of Moisture Together For Record Flooding Event Over Toronto

Just weeks after Alberta experienced a record shattering rain event, a new storm began to form over Toronto, Canada. This storm brought with it a train of powerful thunderstorms that, one after the other, dumped torrential rain that would accumulate to nearly 5 inches in some areas and which would break the city’s all time record for rainfall within a 24 hour period.

As unusual as this event is, it is particularly abnormal for it to follow such a short time-span after the deluge that inundated Calgary and its surrounding regions. Human-caused climate change has created the conditions that make extreme weather of this kind increasingly more likely. Added heat energy creates instability in the atmosphere. The added heat and moisture increases the strength of the elemental forces that drive and enhance storms. And receding sea ice and land snow cover (during summer) have brought about dangerous changes to the Jet Stream that make weather patterns over a given region more likely to persist for long periods of time and that are more likely to link weather systems from north to south, creating the conditions for exceptionally strong storms.

It is in this context that record rainfall occurred over Toronto on July 8th. The set-up for this event involved the confluence of two weather systems — one from the north, and another from the south. These two streams of stormy weather and moisture came together in a flow over Toronto that was then ignited into a long strand of thunderstorms by a boiling atmospheric instability as northward streaming warm air collided with cooler Arctic air.

July 5 Toronto Flood

(Precursor to Toronto Floods, July 5. Image source: Lance-Modis)

In the above image we can see the Jet Stream, which had sagged for so long over the Eastern US and toward the Gulf of Mexico, now rushing along across southern Canada. It is indirectly visible via an accompanying band of clouds rushing across the top of this image. To the south, you can see a broad river of moisture flooding up from the Gulf of Mexico, behind the Appalachians, and up toward the Great Lakes. It is this river of moisture that dumped many inches of rain over the US Gulf Coast from July 3-6. This same river of moisture would rush northward to meet with a storm system brought along by a dip in the Jet.

July 7 Toronto Flood

(Toronto Flood, July 7th. Image source: Lance-Modis)

In this second image, we see the moisture flow from the Gulf of Mexico surging north and forming a head near the Great Lakes, just south of Toronto. From the north, a second large bank of cloud and moisture begins to move south as the Jet commences another dive toward the Eastern US. The stage is now set for the historic storm that drenched Toronto.

Toronto Flood July 8

(Toronto Flood, July 8th. Image source: Lance-Modis)

In the last image we can now see the two flows of moisture combined into an immense cloud over the Toronto region. Note the elongated east-west orientation of the cloud flow as storm after storm sets up in a train-like pattern to drench Toronto. The meeting of two air flows — one from the Gulf of Mexico, another from the Arctic — combined to make this storm so powerful. And an anomalous orientation of the Jet Stream enabled such a storm to form.

In the end, the Toronto storms shut down the power grid to over 300,000 people, turned roads into rivers for a period of up to ten hours, flooded out rail lines and crippled the largest city in Canada. It also left many neighborhoods there looking like this:

Toronto Flood Neighborhood

(Image source: CTV)

All the result of a 100 year rain event following just weeks after a 100+ year rain event striking the Alberta region of Canada. The Alberta flood was the third most costly weather disaster in Canadian history at $3 billion dollars. Though not likely to rival the cost of the 2013 Calgary floods, yesterday’s Toronto flooding adds substantial damage to an already battered country.

Links:

Toronto Deluged with Record all Time Rainfall

Lance-Modis

Toronto Floods: The Storm’s Toll by the Numbers

Tropical Storm Leslie Rakes Newfoundland; Turns ‘Post Tropical’ and Sets Sights on Greenland, Iceland

The North Atlantic is very warm for this time of year. So warm, in fact, that tropical storms are now able to make landfall in Canada. Today, tropical Storm Leslie raked Newfoundland before being bundled up by a cold front and hustled off toward Greenland and Iceland.

Leslie is now considered ‘post tropical’ by the National Hurricane Center. But the heat and tropical moisture bound up in this storm will take days to fully dissipate. As such, the storm is expected to bring 50-60 knot winds just off the coasts of Greenland and Iceland before looping back toward the UK by Friday morning.

The Leslie and cold front combo struck the Canadian coast with a powerful punch last night and this morning — resulting in record rains and flash flooding. You can view news coverage of the powerful impacts of these two converging storms here:

http://www.cbc.ca/video/watch/News/TV Shows/The National/Canada/ID=2277644407

Overall, it is a very rare event for tropical storms to impact Canada and these parts of the North Atlantic. This season has been unusual as a number of storms have trekked further north than during a typical hurricane season. Tropical Storm Michael, just to the east of Leslie, has also ventured far into the open waters of the North Atlantic.

It is these regions where hurricanes and tropical storms usually go to die. But, since the late 1990s, Canada and Great Britain have been increasingly in the firing line of these cyclones. Looking at Leslie’s track, it appears that danger from tropical storms may extend as far north as southern Greenland and Iceland in the coming decades.

Though scientists have made mixed observations on the potential for increased numbers of storms due to global warming, a majority of scientists have determined that increased heat energy in the atmosphere results in stronger storms. Scientists and meteorologists will now also likely have to extend the zones in which these storms typically occur.

Links:

http://www.nhc.noaa.gov/refresh/graphics_at2+shtml/152706.shtml?5-daynl#contents

http://www.cbc.ca/news/canada/nova-scotia/story/2012/09/10/ns-truro-flood-residents.html