2014 has been a rough year for El Nino forecasting.
During Winter and Spring, an extraordinarily strong Kelvin wave rocketed across the Pacific. Containing heat anomalies in excess of 6 C above average, this flood of trans-Pacific warmth hit the ocean surface, dumping an extraordinary amount of heat into the atmosphere. The heat helped drive global sea surface temperatures for May, June, and July to all-time record values.
Many forecasters believed that this heat would lead to a moderate to strong El Nino event starting this summer. And, by June, NOAA was predicting that El Nino was 80% likely to emerge some time this year.
But the initial oceanic heat pulse was crushed by a failure of atmospheric feedbacks. The trans-Pacific trade winds, with a few visible exceptions, remained strong enough to suppress El Nino formation. And so it appeared that, by late July, the initial powerful heat pulse providing potential for El Nino had almost entirely fizzled.
Then, a second warm Kelvin Wave began to form even as Southern Oscillation values started to fall.
(Second warm Kelvin Wave running across Pacific has resurrected the potential for a weak to moderate late 2014 El Nino. Image source: Climate Prediction Center.)
This second Kelvin Wave contains a broad swath of +2 to +5 C anomaly values and is rapidly propagating toward the surface zones of the Central and Eastern Pacific. And though not as strong as the Kelvin Wave that formed earlier this year, the current Kelvin Wave is occurring in conjunction with what appears to be a somewhat more robust atmospheric feedback.
The Southern Oscillation Index, a measure of pressure differences between Tahiti and Darwin, is an indicator of Nino related atmospheric conditions. At consistent values below -8, weather variables tend to favor El Nino formation. And, for the past twelve days, 30 day averages have been below the -8 threshold. If these values extend for much longer, the coincident warm Kelvin Wave and atmospheric conditions favorable for El Nino may well set off this long-predicted event.
Model runs still show a 60-65% chance of El Nino formation before the end of this year and NOAA’s forecast continues to call for a weak El Nino forming some time in late 2014:
(Model Forecast shows 60-65 percent chance of El Nino by November through January. Image source: CPC/IRI.)
It is worth noting that this second warm Kelvin Wave is providing the last chance for El Nino in 2014. So if atmospheric feedbacks fade and sea surface temperatures remain just on the high side of ENSO neutral, then 2014 will close without the incidence of this wide-scale Pacific Ocean and atmospheric warming event.
With weak El Nino, however, there is still a likelihood that 2014 will tie or exceed hottest ever global surface temperature values. A failure for El Nino to form will probably result in 2014 closing as one of the five hottest years on record, given current trends.
(Large algae bloom still visible in Lake Erie satellite shot on August 4, 2014. Image source: LANCE-MODIS.)
Warming, more toxic waters. It’s a problem directly driven by human-caused climate change. And for Toledo, Ohio, this weekend, it’s a reality that was starkly driven home as water services to half a million residents were suddenly shut off. There, in the waters of Lake Erie, a massive bloom of freshwater cyanobacteria pumped out enough poison to put human health at risk and force Ohio officials to declare a state of emergency.
Emerging Threat to Public Health
In Northern Ohio, water safety officials have been nervously testing Lake Erie supplies for many years now. Microbial blooms in western Lake Eerie were on the rise and the worry was that the new blooms may pose a future health threat as both climate change and agricultural run-off intensified.
By 2011, the wettest summer on record and warm waters in Lake Erie helped trigger a major outbreak of cyanobacteria blooms which ultimately resulted in more than 10 billion dollars in damage due to fouled waters, toxic beaches, and losses to the fishing and tourism industries of Lake Erie’s bordering states. Last year, a massive bloom caused some small northern Ohio towns to temporarily cut off water supplies. By last weekend, the entire water supply of Toledo, Ohio was under threat from the microbe-produced toxin called microcystin.
Water Poisoning by Microbes
Microcystin is a potent toxin produced by the small-celled, fresh water cyanobacteria. The substance is unsafe at levels greater than 1 part per billion in drinking water (according to the World Health Organization). Consumption of the toxin results in headaches, nausea and vomiting. Microcystin is directly toxic to the liver with exposure resulting in severe damage. It also results in damage to the digestive system and low levels of exposure have been linked in studies to various forms of abdominal cancer.
Since the toxin is a chemical that has already been produced by bacteria, usual sanitation methods, such as boiling water, are ineffective and may even help to concentrate the poison, making it more potent. So the toxin must be prevented from entering the water supply at the source — which can be difficult if much of the water source is contaminated, as is the case with Lake Erie.
A Threat Driven By Climate Change and Human Activity
As waters warm, they host larger and larger blooms of cyanobacteria harmful to animal life, including humans. The microbes thrive in warm, nutrient-rich water. And under climate change waters both warm even as runoff in certain regions increases due to more frequent bursts of heavy rainfall. This has especially been the case for the central and north central sections of the US, this year, which have suffered extensive and frequent downpours together with record hourly and daily rainfall totals in many areas.
The deluges flush nutrients down streams and into major bodies of water. The water, warmed by human-caused climate change, are already a haven for the cyanobacteria. So the blooms come to dominate surface waters. In addition, the runoff contains added nutrients due to large amounts of phosphorus and other agriculture-based fertilizers. It’s a combination that really gives these dangerous microbes a boost. Under such conditions, the massive resulting blooms can turn the surface lake water into green sludge.
Dead Zones, Anoxic Waters
(Green cyanobacteria in Lake Erie during the large algae bloom of 2013. Image source: University of Michigan.)
Eventually, the cyanobacteria leech the surface waters of nutrients and begin to die out. As they do, they undergo decay which strips oxygen from the waters. Through this process, dangerous, anoxic dead zones radiate from areas previously dominated by large cyanobacteria blooms. The dead zone and toxin producing bacteria often result in large-scale fish kills and the wide-scale fouling of waters that can be so damaging to various industries. However, the dead zones themselves are havens for other toxic microbes — the hydrogen sulfide producing kind.
Water is Declared Safe — Information Still Unavailable to the Public
Today, water safety officials lifted the ban on water use for Toledo, claiming that water was now safe to use and drink after the water system was properly flushed. Officials apparently conducted six tests to confirm water supply safety but have not yet made results public. Personnel with the EPA unofficially stated that microcystin levels were at 3 parts per billion on the day the water was declared unsafe but that water was now safe for residents.
The declaration was met with widespread criticism due to the fact that data on water testing was not made publicly available, reducing confidence in the safety officials’ assertions and causing many residents to question their veracity. State and city water officials say they plan to post the data on their website, but have yet to confirm a time.
Meanwhile, the large cyanobacteria bloom is still ongoing. Experts expect the bloom to peak sometime in mid September and then begin to recede with the advent of fall and cooler weather. With more than a month and a half still to go, Lake Erie water troubles may just be starting to ramp up.
I’m going to say something that will probably seem completely outrageous. But I want you to think about it, because it’s true.
You, where-ever you are now, are living through the first stages of a disaster in which there is nowhere to run, nowhere to hide, and no safe place on Earth for you to go to avoid it. The disaster you are now living through is a greenhouse emergency and with each ounce of CO2, methane and other greenhouse gasses you, I, or the rest of us, pump into the air, that emergency grows in the vast potential of damage and harm that it will inflict over the coming years, decades and centuries. The emergency is now unavoidable and the only thing we can hope to do through rational action is to reduce the degree of harm both short and long term, to rapidly stop making the problem worse, and to put human ingenuity toward solving the problem rather than continuing to intensify it.
But damage, severe, deadly and terrifying is unleashed, in effect and already happening, with more on the way.
* * * * *
(Michael Mann’s famous Hockey Stick graph showing Northern Hemisphere temperatures over the past 1,000 years. The influences of human warming become readily apparent from the late 19th to early 21rst centuries. But human greenhouse gas forcing has much greater degrees of warming in store.)
This week, Michael Mann wrote an excellent piece describing the immediacy of our current emergency in the Scientific American. In typical, just the facts, fashion, he laid out a series of truths relevant to the current greenhouse catastrophe. These facts were told in a plain manner and, yet, in a way that laid out the problem but didn’t even begin to open the book on what that problem meant in broader context.
Michael Mann is an amazing scientist who has his hand on the pulse of human-caused climate change. He is a kind of modern Galileo of climate science in that he has born the brunt of some of the most severe and asinine attacks for simply telling the truth and for revealing the nature of our world as it stands. But though Mann’s facts are both brutal and hard-hitting for those of us who constantly read the climate science, who wade through the literature and analyze each new report. By simply stating the facts and not telling us what they mean he is hitting us with a somewhat nerfed version of his ground-breaking Hockey Stick. A pounding that may seem brutal when compared to the comfortable nonsense put out by climate change deniers and fossil fuel apologists but one that is still not yet a full revelation.
I will caveat what is a passionate interjection by simply saying that Michael Mann is one of my most beloved heroes. And so I will do my best to help him out by attempting to lend more potency to his already powerful message.
2 C by 2036 — Digging through the Ugly Guts of it
All that said, Michael Mann laid out some brutal, brutal facts in his Scientific American piece. Ones, that if you only take a few moments to think about are simply terrifying. For the simple truth is that the world has only a very, very slim hope of preventing a rapid warming to at least 2 C above 1880s levels in the near future and almost zero hope altogether of stopping such warming in the longer term.
Mann, in the supplemental material to his Scientific American paper, notes that the total forcing of all other greenhouse gasses currently in the atmosphere is about 20% of the total CO2 forcing. This gives us a total CO2 equivalent forcing of 480 ppm CO2e, which uncannily mirrors my own analysis here (the science may have under-counted a bit on the methane forcing, but this value is likely quite close to current reality for both the short and long term).
480 ppm CO2e is one hell of a forcing. It is nearly a 75% greater forcing than 1880s values and, all by itself, is enough to raise temperatures long-term by between 3.5 and 4.5 degrees Celsius.
And it is at this point that it becomes worthwhile talking a bit about different climate sensitivity measures. The measure I am using to determine this number is what is called the Earth Systems Sensitivity measure (ESS). It is the measure that describes long term warming once all the so called slow feedbacks like ice sheet response (think the giant glaciers of Greenland and West Antarctica) and environmental carbon release (think methane release from thawing tundra and sea bed clathrates) come into the equation. Mann, uses a shorter term estimate called Equilibrium Climate Sensitivity (ECS). It’s a measure that tracks the fast warming response time once the fast feedbacks such as water vapor response and sea ice response are taken into account. ECS warming, therefore, is about half of ESS warming. But the catch is that ECS hits you much sooner.
At 480 ppm CO2e, we can expect between 1.75 and 2.25 degrees C of warming from ECS. In essence, we’ve locked about 2 C worth of short term warming in now. And this is kind of a big deal. I’d call it a BFD, but that would be swearing. And if there is ever an occasion for swearing then it would be now. So deal with it.
Mann, in his article, takes note of the immediacy of the problem by simply stating that we hit 2 C of shorter term ECS warming once we hit 405 ppm CO2 (485 CO2e), in about two to three years. And it’s important for us to know that this is the kind of heat forcing that is now hanging over our heads. That there’s enough greenhouse gas loading in the atmosphere to push warming 2 C higher almost immediately and 4 C higher long term. And that, all by itself, is a disaster unlike anything humans have ever encountered.
(Global annual fossil fuel emission is currently tracking faster than the worst-case IPCC scenario. Aerosols mask some of the heating effect of this enormous emission, what James Hansen calls ‘a Faustian Bargain.’ Image source: Hansen Paper.)
But there is a wrinkle to this equation. One that Dr. James Hansen likes to call the Faustian Bargain. And that wrinkle involves human produced aerosols. For by burning coal, humans pump fine particles into the atmosphere that reflect sunlight thereby masking the total effect of the greenhouse gasses we have already put into the atmosphere. The nasty little trick here is that if you stop burning coal, the aerosols fall out in only a few years and you then end up with the full heat forcing. Even worse, continuing to burn coal produces prodigious volumes of CO2 while mining coal pumps volatile methane into the atmosphere. It’s like taking a kind of poison that will eventually kill you but makes you feel better as you’re taking it. Kind of like the greenhouse gas version of heroin.
So the ghg heroin/coal has injected particles into the air that mask the total warming. And as a result we end up with a delayed effect with an extraordinarily severe hit at the end when we finally stop burning coal. Never stop burning coal and you end up reaching the same place eventually anyway. So it’s a rigged game that you either lose now or you lose in a far worse way later.
Mann wraps coal and other human aerosol emissions into his equation and, under business as usual, finds that we hit 2 C of ECS warming by 2036 as global CO2 levels approach 450 ppmv and global CO2e values approach 540 ppmv. At that point, were the aerosols to fall out we end up with an actual short term warming (ECS) response of 2.5 to 3 C and a long term response (ESS) of about 5 to 6 C. (Don’t believe me? Plug in the numbers for yourself in Mann’s climate model here.)
So ripping the bandaid off and looking at the nasty thing underneath, we find that even my earlier estimates were probably a bit too conservative and Mann, though we didn’t quite realize it at first, is hitting us very hard with his hockey stick.
What does a World That Warms So Rapidly to 2 C Look Like?
OK. That was rough. But what I am about to do is much worse. I’m going to take a look at actual effects of what, to this point, has simply been a clinical analysis of the numbers. I’m going to do my best to answer the question — what does a world rapidly warming by 2 C over the next 22 years look like?
Ugly. Even more ugly than the numbers, in fact.
First, let’s take a look at rates of evaporation and precipitation. We know that, based on past research, the hydrological cycle increases by about 6% for each degree Celsius of temperature increase. So far, with about .8 C worth of warming, we’ve had about a 5% increase in the hydrological cycle. What this means is that evaporation rates increase by 5% and precipitation events, on average, increase by about 5%. But because weather is uneven, what this does is radically increase the frequency and amplitude of extreme weather. Droughts are more frequent and more severe. Deluges are more frequent and more severe.
(Program in which top climate scientists explain how global warming increases the intensity of evaporation and precipitation all while causing dangerous changes to the Jet Stream.)
At 2 C warming we can change this loading from a 5% increase in the hydrological cycle of evaporation and precipitation to a 12% increase. You think the droughts and deluges are bad now? Just imagine what would happen if the driver of that intensity more than doubled. What do you end up with then?
Now let’s look at something that is directly related to extreme weather — sea ice loss. In the current world, about .8 C worth of warming has resulted in about 3.2 C worth of warming in the polar regions. And this warming has resulted in a massive and visible decline of sea ice in which end summer volume values are up to 80% less than those seen during the late 1970s. This loss of sea ice has had severe effects on the Northern Hemisphere Jet Stream, both pulling it more toward the pole and resulting in high amplitude Jet Stream waves and local severe intensification of storm tracks. At 2 C worth of global warming, the Arctic heats up by around 7 C and the result is extended periods of ice free conditions during the summer and fall that last for weeks and months.
(Actual rate of sea ice loss vs IPCC model predictions. The most recent record low value achieved in 2012 is indicated by the dot. Image source: Assessment of Arctic Sea Ice/UCAR Report.)
The impacts to the Northern Hemisphere Jet Stream are ever more severe as are the impacts to Greenland ice sheet melt. Under such a situation we rapidly get into a weather scenario where screaming temperature differentials between the North Atlantic near Greenland and the warming tropics generate storms the likes of which we have never seen. Add in a 12% boost to the hydrological cycle and we get the potential for what Dr. James Hansen describes as “frontal storms the size of continents with the intensity of hurricanes.”
Greenland melt itself is much faster under 2 C of added heat and the ice sheets are in dangerous and rapid destabilization. It’s possible that the kick will be enough to double, triple, quadruple or more the current pace of sea level rise. Half foot or more per decade sea level rise rapidly becomes possible.
All this severe weather, the intense rain, the powerful wind storms and the intense droughts aren’t kind to crops. IPCC projects a 2% net loss in crop yields each decade going forward. But this is likely to be the lower bound of a more realistic 2-10 percent figure. Modern agriculture is hit very, very hard in the context of a rapidly changing climate, increasing rates of moisture loss from soil and moisture delivery through brief and epically intense storms.
The rapid jump to 2 C is also enough to put at risk a growing list of horrors including rapid ocean stratification and anoxia (essentially initiating a mass die off in the oceans), large methane and additional CO2 release from carbon stores in the Arctic, and the unlocking of dangerous ancient microbes from thawing ice, microbes for which current plants and animals do not have adequate immune defenses.
How do we avoid this?
In short, it might not be possible to avoid some or even all of these effects. But we may as well try. And this is what trying would look like.
First, we would rapidly reduce human greenhouse gas emissions to near zero. As this happens, we would probably want a global fleet of aircraft that spray sulfate particles into the lower atmosphere to make up for the loss of aerosols once produced by coal plants. Finally, we would need an array of atmospheric carbon capture techniques including forest growth and cutting, then sequestration of the carbon stored by wood in lakes or in underground repositories, chemical atmospheric carbon capture, and carbon capture of biomass emissions.
For safety, we would need to eventually reduce CO2 to less than 350 ppm, methane to less than 1,000 ppb, and eliminate emissions from other greenhouse gasses. A very tall order that would require the sharing of resources, heroic sacrifices by every human being on this Earth, and a global coordination and cooperation of nations not yet before seen. Something that is possible in theory but has not yet been witnessed in practice. A test to see if humankind is mature enough to ensure its own survival and the continuation of life and diversity on the only world we know. A tall order, indeed, but one we must at least attempt.
(California Snow Pack for January 18 2013 vs the California Snow Pack for January 18 2014. Note the near-zero snow cover for this drought-impacted region. Image source: NASA/Lance-Modis)
“We are on track for having the worst drought in 500 years.” — B. Lynn Ingram, professor of earth and planetary sciences at the University of California, Berkeley.
Not so with the American West. There the high amplitude Jet Stream pattern remained, keeping regions locked in warm, dry conditions throughout the winter of 2012-2013, on through the end of 2013 and into the early months of 2014.
Looking further back, it was not just these years that had delivered dry weather to the US West Coast. California, ground zero for the current climate change related emergency, has endured dry, hot weather ever since the Pacific Decadal Oscillation (PDO) went negative ten years ago suffering drought years with almost bi-annual frequency.
Now, as Dr. Ingram notes above, California is currently ramping up to its worst drought in 500 years.
A long emergency for California
We only have to scratch the surface for the symptoms of systemic climate crisis in California to crop up. California water authorities failed to honor contracts for the first time in 54 years. Sacramento, as of December was experiencing its worst drought in 130 years even as conditions continued to worsen through January and February.
According to the New York Times, as of February 1rst, 40,000 people were at risk of losing access to water within the next 60 to 120 days. And State officials warned that this number was likely to rapidly rise as The State Water Project announced on January 31rst that it did not have enough water to supplement the fading supplies of local providers to a total of 25 million customers. Meanwhile, State emergency planners were laying out contingencies that included shipping water over land by truck to parched communities.
The drought is also having a devastating impact on local farmers with about 1/3 of California’s farmland expected to lay fallow, at least 25,000 farm laborers expected to be laid off work, and agricultural businesses expecting losses to mount into the tens of millions of dollars. Already, livestock owners in both New Mexico and California, unable to support their animals, have been forced to sell, as fields that used to support four foot high grass are brown and cracked.
Tim Quinn, executive director of the Association of California Water Agencies noted:
“I have experienced a really long career in this area, and my worry meter has never been this high. We are talking historical drought conditions, no supplies of water in many parts of the state. My industry’s job is to try to make sure that these kind of things never happen. And they are happening.”
Climate change, climate change, and climate change
Far flung and dynamic changes to the Earth System appear to have resulted in a variety of factors that have amplified the California drought. First, increasing global temperatures have amped up the rate at which water evaporates into the atmosphere by about 6%, this increased rate of evaporation results in more extreme conditions when heat and dryness do occur. So a drought that may last a year is likely to be even more intense, due to enhanced evaporation, than a comparable drought that occurred 50 or 100 years ago.
And just such a blocking pattern has dominated the US West Coast for 11 months running. The result is extraordinarily intense dryness, even during the rainy season of November through March.
Sadly, according to climate models, we can expect this kind of dryness to intensify over the US Southwest as human caused global warming grows more extreme. A report conducted by PNAS in 2010 and authored by Seager and Vecchi confirmed other model findings that the US Southwest would continue to dry as the climate warmed — the upshot being that the wet season for the West would eventually evaporate.
Above, the PNAS drought model shows evaporation beginning to increase during the first two decades of the 21rst Century. Then, by about decade 2, precipitation rates rapidly fall and evaporation rates gradually rise through to 2100. The red line shows the compounding effects of evaporation increase and precipitation decrease over 24 separate climate model essays.
It is worth noting that on a positive, and slightly hopeful, note, the current blocking pattern over the US West Coast and related Pacific Ocean waters has weakened somewhat. This should allow some moisture to flow into the parched west over the coming days and weeks. And, in the forecast, we do see a proper storm or two emerging from this new pattern. Unfortunately, we’d typically expect about 20-30 storms of this kind during a typical winter season and with March bringing in the end to this year’s rainy season, along with the northward retreat of the moisture flow, it appears likely that California will have to endure at least another 6 months of dry conditions before seeing any hope of major storms returning next fall/winter. A remote potential to say the least given both long-term trends and current conditions.
‘Like a microwave on full blast drying the Earth:’ drought, drought, and more drought
“The extra heat from the increase in heat trapping gases in the atmosphere over six months is equivalent to running a small microwave oven at full power for about half an hour over every square foot of the land under the drought. No wonder wild fires have increased! So climate change undoubtedly affects the intensity and duration of drought, and it has consequences.”
Under such conditions, we would expect both drought and wildfires to proliferate. And, in fact, this is exactly what we are seeing. As major wildfires impacted both California and Arctic Norway during winter time, Brazil, Turkey, China, Argentina and Australia were also all experiencing some of their worst or most intense droughts on record.
Nearby Argentina also saw severe drought-related shocks in recent months as a December drought inflicted serious harm upon Argentina’s corn crop. In a typical year, Argentina produces about 32 million tons of corn. But this year’s drought is estimated to have wiped out about between 7 and 14 million tons of the crop. Argentina is the third largest producer of corn and with the US revising estimates down for its 2013-2014 crop, supplies of the grain are being drawn ever-lower. Though very intense, the December drought had abated by mid-January, providing a respite for other crops such as soybeans.
In Australia, drought conditions are now worse for some locations than at any time since 2003, a tall order since the 2003 to 2009 drought was Australia’s worst in 1,000 years. For Sydney, that means the lowest rainfall totals in more than 70 years. This particular drought hit both hard and fast with Australia seeing normal conditions before Christmas, but after, very intense heat and dryness resulted in a rapid scorching of farmlands, crops, and grazing fields. The dire drought situation has resulted in government relief funds being released to affected farmers. NSW Minister for Primary Industries, Katrina Hodgkinson noted to the Sydney Morning Herald:
“Seasonal conditions are now deteriorating at a rapid rate across a large portion of NSW and both the severity and speed at which this drought is moving is astonishing. Primary producers in some parts of NSW have simply not had the opportunity to prepare for another severe downturn in seasonal conditions so quickly after the Millennium drought broke.”
(A mostly full Lake Poyang as seen from Satellite on the left during May of 2012. A parched and almost completely dry lake Poyang as seen from Satellite during January of 2014. Image source: NASA/Lance-Modis.)
And, in China, the largest lake for that populous nation has now dried up. Poyang, a massive lake usually spanning 3,500 square miles has been turned into a sprawling field of earth parched and cracked by a combination of drought and water diversions resulting from the construction of the Three Gorges Dam. According to reports from The Guardian and Chinese News Sources, a drought stretching from 2012-2014 in the region of Poyang is now the worst in at least 60 years leaving lake refill almost non existent as upstream river flows to the lake were periodically cut off by water storage operations at the Three Gorges Dam. The result was an extreme lowering of lake levels and dry bed conditions that have driven farmers and fishermen in the region out of business.
Implications for world food security
Major droughts during 2011-2012 impacted many of the world’s primary agricultural basins, resulting in forward food supply dropping to as low as 72 days. Since that time, food supplies have slightly recovered but are well below previous levels last seen in the 1990s at 104 days. Food insecurity and failure to distribute food to the malnourished remains a priority at international agencies like the UN which has identified numerous countries including Cameroon, the Central African Republic, Somalia, Syria, Mali, Sudan and Nigeria, among others, as extreme risks for hunger and famine. Relief agencies have allocated billions of dollars to address this problem but the UN continues to identify climate change as a major threat to global food security with the potential to wipe out all previous progress moving forward.
The droughts in California, Turkey, Australia, China, Argentina and Brazil so far for 2014 put the world at risk for another bout of food insecurity later this year should major weather and climate related crop disruptions emerge in other primary food producers such as the bread baskets of the US, Russia, and Europe (The US, Brazil, China, Russia, and Europe are top food producers). It is worth noting that, in large part due to the ongoing southwestern drought, the US has revised a number of its crop projections downward for end 2014.
With polar amplification playing havoc with the Northern Hemisphere’s weather systems, with Australia sitting in a pool of expanding warm Pacific Ocean water that makes drought more likely there, and with the Eastern Pacific edging closer to La Nina, conditions warrant a continued monitoring of both weather and the state of world food supplies. The added global heat engine also impacts soils and crop growth in ways to which we are currently unaccustomed, resulting in more extreme instances of flash drought as well as flash flood. In this respect, the examples of Australia and Argentina are of particular concern.
Though global crisis has not yet returned, it lurks at the edges as drought, extreme weather and over-use of ground water supplies continues to threaten a wide swath of productive zones. So, at this point, the situation is one best described as tenuous with ongoing regional impacts over the Sahel region of Africa and in other sporadically vulnerable locales.
Back in January, on January 1rst in fact, the first cyclone of this year’s Eastern Pacific Typhoon season formed. It would be one of at least 52 tropical depressions, storms, and typhoons that would rake through this vulnerable region over the next 11 months — resulting in over 7,000 deaths and tying a record for the most storms set 49 years ago in 1964.
The typhoon season that would repeatedly rake the Phillippines with monster storms and disgorge the strongest cyclone — Haiyan — to ever make landfall came on, at least in part, due to anomalously hot Pacific Ocean waters. Throughout the year, a large swath of the Western Pacific remained between 2 and 5 degrees Celsius above the 1979-2000 average. This stretch of water reached 90 degrees Fahrenheit during the summer of 2013, contributing to the extremely hot air mass that set off temperature record after temperature record in southeastern China from late July through early August.
According to reports from NOAA, not only was this mass of water very warm, its warmth extended far into the depths of the Pacific. NOAA’s report: Deep Warm Water Fuels Haiyan Intensification linked the anomalously deep and hot water to Haiyan’s rapid intensification as well as provided a basis for understanding why so many cyclones had formed during the, very prolific, typhoon season of 2013.
(Anomalously hot and deep Pacific Ocean waters detected by NOAA sensor in early November)
NOAA noted:
The intensification of Super Typhoon Haiyan is being fueled by “ideal” environmental conditions – namely low wind shear and warm ocean temperatures. Maximum sustained winds are currently at 195 mph, well above the Category 5 classification used for Atlantic and East Pacific hurricanes. Plotted here is the average Tropical Cyclone Heat Potential product for October 28 – November 3, 2013, taken directly from NOAA View. This dataset, developed by NOAA/AOML, shows the total amount of heat energy available for the storm to absorb, not just on the surface, but integrated through the water column. Deeper, warmer pools of water are colored purple, though any region colored from pink to purple has sufficient energy to fuel storm intensification. The dotted line represents the best-track and forecast data as of 16:00 UTC on November 7, 2013.
It will only take the formation of one more cyclone to break the all-time record number of storms formed back in 1964. With 6 cyclones having formed since Haiyan ripped through the Philippines in early November and with Pacific Ocean temperatures remaining anomalously hot, it appears possible that 2013 will break this long-standing record.
For years, researchers have debated whether increasing ocean heat content due to human caused global warming will result in more numerous tropical cyclones. Heat is the primary driver for the formation and strengthening of these storms and with average global temperatures increasing at the rate of at least .2 degrees Celsius per decade, that driver continues to strengthen. At the very least, researchers agree that the strongest storms will likely be stronger. But tropical cyclone formation is complex and other factors, such as large areas of dust stirred up from expanding deserts, may also act to suppress storms in a warming world, at least in some basins.
One factor that has not been explored in depth is what appears to be a steadily growing length of hurricane seasons. In almost all basins, storms appear to be forming earlier and earlier in the year. Climatological peaks for typhoon seasons are still occurring at the usual time. But the warming oceans appear to be setting the stage for year-round tropical cyclone formation. A tropical cyclone typically needs water temperatures of at least 75 degrees (Fahrenheit) to form. And with pools of water at this temperature and above expanding even during what is typically winter it would seem that the basic ingredients for year-round storm formation are steadily being provided.
(Melt Puddles and Distant Open Water at North Pole Camera 2 on July 13. Image source: APL)
With the emergence then fading of a ‘warm storm’ in late June and early July, then a subsequent set of intermittent storms and sunny days, all occurring in warmer than freezing conditions, central Arctic surface ice melt has continued to proceed apace.
This melt is now plainly visible at North Pole Camera 2 were a number of near-camera melt puddles have been forming and growing over the past few days. You can see these melt puddles clearly in the above image provided by the Applied Physics Lab through its North Pole Camera #2. The puddles, which were at first in the front field of the camera, have now expanded to cover about 105 degrees of the view provided. Smaller, darker melt spots also appear to have invaded behind the markers set around the camera.
In the distance, in the left-hand field of view, a larger section of dark water appears to have opened as well. This darker, open section, which has been an intermittent feature since late June, seems to have grown of late, with larger gaps appearing in this more distant section.
Since early July, rapid extent and area melt have continued apace as a strong high pressure system formed over the Beaufort and a series of intermittent storms rushed through the Central Arctic via origins in the Laptev, Barents, Kara, and extreme North Atlantic. Central sea ice concentration has remained low due to damage during June’s PAC 2013 and now three melt tongues are plunging into the Arctic — one from the Chukchi, one from the Laptev and one from the Kara and a broad region all the way to the Fram Strait. More gradual melt is also proceeding from the Mackenzie Delta even as ice in the Canadian Archipelago gradually collapses. Hudson and Baffin Bays, as you can see in the above image provided by Uni Bremen are mostly cleared out. These conditions: three areas of rapid melt at the ice edge combined with continued low concentration, melting ice at the Arctic’s heart, represent high risk for further rapid melt through late July. This is especially due to the fact that many ice regions are now at risk of separation from the main ice pack or from surrounding by open water on three sides. Such circumstances usually enhance ice fragility and result in greater ice vulnerability to disruptive weather events come late summer. It’s a set of conditions we’ll explore more deeply in a blog I’m preparing for next week.
For now, though, it is sufficient to show that Central Arctic regions are still undergoing surface melt even though the forces driving rapid bottom melt and dispersal appear to have abated for the moment. We’ll also be keeping an eye on ECMWF forecasts which show a 985 or stronger low forming directly over the North Pole for a few days next week. Another warm storm potential that may have further impacts as sunlight has now had the opportunity to warm areas of water beneath the fractured ice.
Just weeks after Alberta experienced a record shattering rain event, a new storm began to form over Toronto, Canada. This storm brought with it a train of powerful thunderstorms that, one after the other, dumped torrential rain that would accumulate to nearly 5 inches in some areas and which would break the city’s all time record for rainfall within a 24 hour period.
As unusual as this event is, it is particularly abnormal for it to follow such a short time-span after the deluge that inundated Calgary and its surrounding regions. Human-caused climate change has created the conditions that make extreme weather of this kind increasingly more likely. Added heat energy creates instability in the atmosphere. The added heat and moisture increases the strength of the elemental forces that drive and enhance storms. And receding sea ice and land snow cover (during summer) have brought about dangerous changes to the Jet Stream that make weather patterns over a given region more likely to persist for long periods of time and that are more likely to link weather systems from north to south, creating the conditions for exceptionally strong storms.
It is in this context that record rainfall occurred over Toronto on July 8th. The set-up for this event involved the confluence of two weather systems — one from the north, and another from the south. These two streams of stormy weather and moisture came together in a flow over Toronto that was then ignited into a long strand of thunderstorms by a boiling atmospheric instability as northward streaming warm air collided with cooler Arctic air.
(Precursor to Toronto Floods, July 5. Image source: Lance-Modis)
In the above image we can see the Jet Stream, which had sagged for so long over the Eastern US and toward the Gulf of Mexico, now rushing along across southern Canada. It is indirectly visible via an accompanying band of clouds rushing across the top of this image. To the south, you can see a broad river of moisture flooding up from the Gulf of Mexico, behind the Appalachians, and up toward the Great Lakes. It is this river of moisture that dumped many inches of rain over the US Gulf Coast from July 3-6. This same river of moisture would rush northward to meet with a storm system brought along by a dip in the Jet.
(Toronto Flood, July 7th. Image source: Lance-Modis)
In this second image, we see the moisture flow from the Gulf of Mexico surging north and forming a head near the Great Lakes, just south of Toronto. From the north, a second large bank of cloud and moisture begins to move south as the Jet commences another dive toward the Eastern US. The stage is now set for the historic storm that drenched Toronto.
(Toronto Flood, July 8th. Image source: Lance-Modis)
In the last image we can now see the two flows of moisture combined into an immense cloud over the Toronto region. Note the elongated east-west orientation of the cloud flow as storm after storm sets up in a train-like pattern to drench Toronto. The meeting of two air flows — one from the Gulf of Mexico, another from the Arctic — combined to make this storm so powerful. And an anomalous orientation of the Jet Stream enabled such a storm to form.
In the end, the Toronto storms shut down the power grid to over 300,000 people, turned roads into rivers for a period of up to ten hours, flooded out rail lines and crippled the largest city in Canada. It also left many neighborhoods there looking like this:
All the result of a 100 year rain event following just weeks after a 100+ year rain event striking the Alberta region of Canada. The Alberta flood was the third most costly weather disaster in Canadian history at $3 billion dollars. Though not likely to rival the cost of the 2013 Calgary floods, yesterday’s Toronto flooding adds substantial damage to an already battered country.
Over the past month, warmth and energy have been building in the Arctic. All around, from Siberia to Scandinavia to Alaska, heatwaves have flared beneath anomalous long-wave patterns in the Jet Stream. Patterns, that in many cases have persisted for months. The Alaskan heat dome sent temperatures there to 98 degrees (Fahrenheit). Temperatures in Siberia flared to the low 90s. And heat built and flared again in Scandinavia and Northeastern Europe, sending Arctic temperatures first into the 80s and then to 92.
Now, with central sea ice weakened and with heat circling in from all around, the Arctic appears to be bracing for a period of rapid sea ice loss.
Part 1: The Monitors Start to Go Sharply Negative
The first hint that the Arctic may be at the start of a precipitous fall in sea ice came when the major monitors all went negative. Cryosphere Today, Jaxa, NSIDC — all these key monitors show Arctic sea ice coverage falling sharply over the past two days.
Cryosphere Today showed a substantial loss of more than 200,000 square kilometers of sea ice area in its most recent 24 hour period. Jaxa and NSIDC showed similar extent losses with NSIDC following a steeply declining curve to 10.6 million square kilometers and JAXA diving down to 10.1 million square kilometers.
You can vividly see this declining curve in the most recent NSIDC graph:
Together, these monitors begin to show what could well be the emergence of a potential ‘sea ice cliff’ resulting from rapid loss of ice during a time of escalating impacts. And these impacts appear to be emerging in rapid succession. Most notably, a Warm Storm now melts the central ice even as massive heatwaves threaten to inject hot air into the Arctic’s perimeter.
Part 2: PAC 2013 Now a ‘Warm Storm’
We find that even as these sharp sea ice declines began to emerge, temperatures in the Central Arctic Basin are now all above freezing. Meanwhile, a 995 mb low churns almost directly over the North Pole. This low is part of the same complex of storms that has remained in the Central Arctic since about May 26. Though storms, even strong, long duration storm events like this one, have been known to occur in this region during June, a persistent storm thinning and melting the Central Arctic Basin ice is unprecedented. And this is exactly what has been happening.
Now, it appears this storm has shifted into a new phase that is likely to further enhance central sea ice thinning and melting. The Warm Storm appears to have taken hold.
In a previous post, I defined a ‘Warm’ Arctic Storm as a storm occurring in the Central Arctic in conjunction with average atmospheric temperatures in the range of 0 to 6 degrees Celsius. We are now decisively in the lower end of that temperature range as you can see in the current DMI temperature measure:
Note the wide area of above freezing temperatures now dominating all but isolated portions of the Central Arctic. And, for reference, we have the position of our Warm Storm given in the DMI image below.
Here we can see our Warm Storm now hovering almost directly over the North Pole.
These Warm Storm conditions provide an added surface stress to the sea ice by burdening the ice will above freezing precipitation, winds, fog and air with higher moisture content. These forces add to the churning mechanism of the storm which tends to break the fresh water cap that protects the sea ice and pull up warmer, saltier water from below. It is a combined stress that has already greatly eroded and melted the Central Arctic’s sea ice.
A vivid modeling of current and projected impacts of this Warm Storm are graphically displayed in the US Navy CICE/HYCOM thickness monitor below:
In this vivid model history we can see our ‘Warm Storm’ turning a growing section of the Central Arctic sea ice into one enormous melt puddle even as it continues to shove sea ice along the north coast of Greenland and out through the Fram Strait. It is also worth noting the speed and violence with which edge melt is projected to proceed between now and July 5th. Hudson Bay, Baffin Bay, the waters of the Canadian Archipelago, The Kara Sea, The East Siberian Sea, The Chukchi, and even the edges of the Beaufort are all projected (in this model) to see rapid to extraordinarily rapid melt.
We can see the current Jet Stream configuration, which can well be described as a freaky hydra-head pattern with multiple rapid upper air flows converging on the high Arctic, in the image below:
In particular, we note the high amplitude Rossby Wave pattern emerging over the western US and reinforced by a second echoing pattern extending up over the Beaufort Sea. The wave height for this massive blocking pattern in the Jet is expected to jump northward over the coming days even as a terrific heat dome intensifies with a center near the ‘Devil’s Armpit’ (Hat Tip to X-Ray Mike over at Collapse) of the US (Southern California, Nevada, Arizona).
By Wednesday, we see extraordinary 35 degree Celsius (95 degrees Fahrenheit) average 5,000 foot temperatures at the heat dome’s heart in the US Southwest (translating into 105 to 123+ degree surface highs over a broad area), and a long pulse of hot air jumping all the way up to the Beaufort Sea where it appears near 80 degree (F) high temperatures could emerge near or even over the sea ice.
You can view this uncanny record hot air pulse in the ECMWF weather model forecast below:
Note the angry hot pink heat dome over the US Southwest and the long, hot arm extending from it and all the way into the Beaufort. It is also worth noting that a secondary, though somewhat less intense, heat surge also emerges above Scandinavia and extends deep into the Arctic from its opposite end, creating a kind of pincher of hot air keeping the Arctic in its grip.
By Thursday, this hot air gets wrapped into a 990 mb ‘Warm Storm’ that then goes traipsing through the Beaufort. Not a pleasant prospect, if one wishes to see sea ice preserved…
Worst Case Melt Scenario May be Emerging
So by late June, it appears that the worst case melt scenario — with a storm hollowing out and melting the Arctic sea ice from the center and powerful warm air pulses delivered by a mangled Jet Stream rapidly melting the sea ice from its edges — may be emerging. A start to a ‘melt cliff’ that occurred this week, therefore, may extend and rapidly advance over the coming days. Model ensembles seem to support this forecast even as atmospheric heat delivery to the Arctic ramps up. It is an extreme situation that is well worth monitoring.
The weather forecast for the American West is startling. An extreme blocking pattern that has persisted there since last year is now set to hit its highest amplitudes yet, allowing a massive heat dome to grow and sprawl out over the west for an extended period. The result will likely be a deadly heatwave that could send temperatures rocketing high enough to shatter Earth’s all-time record.
This blast-furnace heat is forecast to begin this weekend with temperatures expected to reach 126 to 129 degrees (Fahrenheit) in Death Valley, California. This range is very close to the all time high record Earth temperature of 134 degrees. So even a minor intensification of this predicted heat wave could result in a new Earth temperature record.
Other regions in the West are also predicted to experience record heat. Temperatures for both Phoenix and Las Vegas are expected to exceed 110 degrees (F) and could also shatter records for these two cities.
Overall, a broad swath from the American west and up into Canada is expected to experience temperatures between 10 and 35 degrees Fahrenheit above average. A visual representation of this incredible heat spike is provided by Weather Bell via Climate Central:
The cause of this predicted record heat is a highly anomalous jet stream. ECMWF northern hemisphere temperature and pressure forecasts show the emergence of an above 30 degrees Celsius ‘heat dome’ forming at 5,000 feet over a large section of the American West.
Temperature differentials on this map also outline the high amplitude wave pattern developing from the western US all the way up through Alberta, Canada. By Wednesday, July 3, this hot pulse has driven 15 degree Celsius (60 degree Fahrenheit) 5,000 foot temperatures all the way to the Arctic Ocean. Such a hot air invasion, should it emerge as predicted, could result in daily surface highs near 80 degrees directly adjacent to a region of the high Arctic even as 110, 120, or perhaps 130 degree temperatures bake Las Vegas, Pheonix, and Death Valley.
You can see this hot, oily knife plunging from south to north over the US and Canada in the ECMWF forecast below:
Dramatic and dangerous alterations to the Northern Hemisphere Jet Stream are a result of a combination of sea ice loss and loss of snow cover of in the extreme north during spring and summer months. During May of 2013, both snow cover and Arctic sea ice volume were the third lowest levels ever recorded. As sea ice and snow cover erode, it allows more warm air invasions into the Arctic the result is an increased waviness and slowing down of the Jet Stream. Under the up-swell of these large waves, dangerous heat and dryness become more common events. In the path of the down-slope, we can expect to see increased cloudy, cooler, stormy conditions.
So even as the American West bakes under temperatures that could, at their core, be the highest values ever recorded on Earth, the East and Central US are setting up for a dangerously unstable condition that may generate extraordinarily powerful storms. The heightening wave in the Jet will dig deep into the Arctic, tapping cooler air and instability before it makes a powerful dive into the moisture and heat laiden region from Minnesota, Iowa and Arkansas eastward. Powerful thunderstorms, hail, flooding, tornadoes, and in the case where streams of the down-rushing Jet converge, derechos are all possibilities given this powerful and unstable north-south flow.
Very dangerous and unstable weather from a damaged and increasingly riled climate. We should do well to not only implement a rational Climate Action Plan, but to add a number of goals and increased efforts. We’re living in the age of consequences and each year of delay begs for more dangerous conditions.
(Large fires in Alaska. Image source: Lance-Modis)
A week after a record heatwave set off highest ever temperatures in Alaska, massive forest fires are blanketing vast areas of wilderness.
More than 80 fires are now raging across the state. The largest include the Lime Hills Fire at 154,000 acres and the Moore Creek Fire at 126,00o acres. In total, nearly 400,000 acres have burned so far this summer. For reference, an average full fire season in the US results in around 3 million acres burned. So the 400,000 acres for Alaska alone represents an abnormally large area burned, especially so early in the fire season and for a region at or above the Arctic Circle.
Like Colorado, where blazes resulted in record damage during June, the largest of the Alaskan fires, Lime Hills, currently threatens a local community. As of Tuesday, the fire had moved to within a half mile of the town which is located on the upper Stoney River just west of Fairbanks. About 70 firefighters are working to ensure no structures are taken by the blaze.
Though not as hot as last week, temperatures still remain in the range of record heat for interior Alaska with some regions Tuesday showing temperatures near 80 degrees (Fahrenheit). Daily record highs for this area range in the high 70s for this time of year. So record-breaking temperatures have become a day-to-day event for this Arctic region.
Fires in Alaska are a direct result of the extreme record high temperatures there. And these temperatures are also linked to a long-period warming trend caused by human-spurred global warming. Increasing heat, dryness and wildfires in vulnerable regions are just one result of the climate change caused by an excessive and continuous burning of fossil fuels. May of 2013 was the 3rd hottest on record, according to NOAA’s National Climate Data Center. Overall, temperatures are about .8 degrees Celsius above temperatures when climate records started in the 1880s. This difference is equivalent to that caused by the Little Ice Age, but on the side of hot.
Also in May, global atmospheric CO2 levels hit a record 400 parts per million. This level of Greenhouse gas is enough to raise Earth’s temperatures another 2-3 degrees Celsius long-term or about half the difference between now and the last Ice Age, but also on the side of hot. Long term results of 400 ppm CO2 also include a 75 foot rise in sea level. Unfortunately, due to a failure by the world’s leaders to enact appropriate CO2 reduction policies, CO2 levels are set to rise to around 550 parts per million by mid-century, enough to bake in a total temperature increase of around 7 degrees Celsius long-term. A virtual fire age.
Between now and then, and without proper policy measures aimed at reducing the damage, we can expect gradual but continually increasing global temperatures with increasing instances of extreme weather events.
The current Arctic heatwave is just one example of the strange climate we are creating. Let us hope that policy makers have gotten the message. We need to get to work before we set off even more dangerous events.
Today, clouds parted enough over the Central Arctic to give us a visual of the ongoing damage inflicted by 2013’s Persistent Arctic Cyclone (PAC). And the damage, as we can see in the images below is extensive.
For comparison, I have provided this shot, taken on May 26th, just as the PAC was beginning to ramp up. Note how pristine and mostly crack-free the ice looks in this satellite shot. Though areas of leads and cracks exist, they are comparatively minor, small, and diffuse.
Today’s most recent Lance-Modis shot shows conditions that are radically different. Note the broad, black spider-web of cracks that has come to dominate this large region of the Central Arctic Ocean. The only places where these large, angry cracks aren’t visible is in areas still covered by dense cloud:
Uni-Bremen sea ice concentration assessments have now been showing confirmation of the storm’s thinning action for more than a week. Today’s concentration graphic provides yet one more validation of central area sea ice losses.
This is the wreckage 18 days of constant pounding has inflicted upon some of the Arctic’s most resilient sea ice. One doesn’t have to think too hard to imagine what another 18 days of such pounding may look like. The Navy CICE/HYCOM model run further on in the post gets us less than half-way there. And weather forecast models show PAC 2013 remaining in the Central Arctic at least until Wednesday of next week.
The current pressure map shows the cyclone centered near the North Pole. Incorporated in its circulation are two weaker storms — one near the Kara Sea, the other over the East Siberian Sea. Lowest pressures are in the range of 990 mb.
Over the past few days, warmer air has been flowing into the Arctic from the region of Alaska and Kamchatka. This warmer air is embedded throughout the Arctic and is, largely incorporated into the circulation of our cyclone. So a substantial portion of the Central Arctic shows above freezing temperatures at this time:
Model forecasts show this warm air influx continuing to grow over the next week with above freezing temperatures covering larger portions of the Central Arctic as time moves forward. Above freezing temperatures are rather common this time of year. What is less common is for cold-core Arctic storms to host such temperatures, even during summer time.
A Constant Influx of Storms
One of PAC 2013’s unique features is its ability to consistently gobble up smaller storms. Storm after storm has arisen from the south, only to be subsumed by the Persistent Arctic Cyclone. This constant infusion of energy from the south is, likely, one of the features that has allowed PAC 2013 to last as long as it has.
Model forecasts show this trend continuing until at least June 19th. At that time, the cyclone is shown to transition to the Canadian Archipelago, as weaker storms trail along through the Central Arctic behind it. This projected storm track brings PAC 2013 on a path directly through a region of the Arctic’s thickest ice just north of the Canadian Arctic Archipelago.
Throughout this period, PAC 2013 is expected to maintain a strength between 990 and 1000 mb — about the intensity of a moderately strong tropical cyclone, but diffused over a much larger area. Current projected storm track and strength show that it may pose a risk to fracture, disperse, and thin a section of ice that has been, thus far, left relatively unscathed.
Here is the ECMWF model forecast showing the storm’s predicted position on June 18th:
That puts a moderately strong 995 mb storm directly over the thickest part of the ice pack sometime next Tuesday.
Fram Strait Export
The constant counter-clockwise motion of PAC 2013 has also begun to have a substantial impact on the remaining thick ice near Greenland and the Canadian Archipelago. Since late May, this region has shown a thinning at the edges and a consistent motion toward the Fram Strait.
This motion is plainly visible in the US Navy CICE model history and forecast from May 23 to June 20 (posted below). Note the large front of greens and yellows (denoting thicker ice) pushing steadily toward the Fram Strait between Greenland and Svalbard.
It is also worth mentioning that the amount of thinning forecast for a region from the North Pole to the Laptev Sea is astounding. Later days in the model forecast show this large region of thinning starting to wrap around the North Pole in the direction of Svalbard. The US Navy projects this region to include large areas of 0.75 meter thickness or less opening up in this region by June 20th. Bands of thin ice seem to be forming a ring pattern emitting out from the North Pole. A stunning effect more reminiscent of disaster movie graphics than actual weather forecast models. Should this forecast thinning emerge, it will be nothing short of remarkable.
In conclusion, PAC 2013 continues. Though some models show the storm transitioning to the Canadian Archipelago by after June 20th, the storm appears likely to continue to impact one region of the Arctic or another for the time being. At 18 days, this is a very long-lasting storm, especially for early summer. Yet models show the potential for the storm to persist and continue to have impacts, having lasted at least 25 days by the end of some model runs.
Before we go into a round-up of today’s Arctic sea ice conditions and melt forecasts, it’s important to note a few things. The first is that the Arctic has suffered an amazing loss of sea ice since 1979. An 80% volume loss and a 55% percent area loss over the past 33 years is an ominous event that will continue to impact our climate for years and decades to come. It is also a signal of how little resilience remains to the ice.
The Arctic, as such, bears deep and abiding scars inflicted by human-caused climate change. The sea ice remembers well these scars. Less energy will be needed to melt the ice than was necessary thirty, twenty, or event ten years ago. And the wounds inflicted in 2012 may prevent the Arctic from ever recovering to any state similar to the cold, frozen environment we once knew. Instead, we’ve entered a period of lasting damage and rapid change. A period where an extreme lack of resiliency is visible in nearly all regions of the sea ice pack.
Signs now show a speedy and violent loss of Arctic sea ice integrity — over the entire ice pack.
Re-Strengthening Cyclone
One part of this story is an Arctic Cyclone (Persistent Arctic Cyclone 2013 or PAC 2013) that emerged on May 26th and has continued to plow through the dense ice at the Arctic’s center ever since. At its strongest, the storm showed pressures in the range of 975-980 millibars. Today, the storm deepened to similar levels:
The storm is now centered in the northern Laptev Sea, drifting close to an area thinned by warmer temperatures and early-season sea ice melt. Since the ice in this region is less resilient than the thicker ice of the Central Arctic, we can expect more visible thinning. Physical impacts from the storm — churning, mixing, upwelling and potentially above freezing surface precipitation — are all likely to erode sea ice in areas beneath its circulation.
The US Navy’s CICE/HYCOM model displays strongly enhanced melt and thinning projected for this region over the coming days:
Persistent Arctic Cyclone 2013 is forecast to churn through the Laptev sea ice on June 9-13 before returning to Central Arctic. The above thickness model shows current and projected impacts.
Note the large region of melting and thinning ice stretching from a swath directly north of Siberia, through the Laptev Sea and on toward the North Pole. The counter-clockwise motion of the storm is projected to pull the ice apart even as the physical forces of the storm, described above, further thin the ice. In many instances, we see the ice projected to thin to between 1.2 and .8 meters.
Meanwhile, an area directly under the North Pole is projected to break and thin further as PAC 2013 returns to the Central Arctic later in the forecast period.
ECMWF model forecasts show PAC 2013 moving to hover over the Canadian Archipelago by June 18th. The storm is expected to continue until at least June 20th, nearly a month after its entry into the Arctic on about May 26th.
Warm Air Building Around the Arctic
As the Persistent Arctic Cyclone of 2013 continues to rage near the Arctic’s heart, warmer air keeps funneling in around and behind it. Near Kamchatka, a northward bulge in the jet stream bore a bubble of warmer temperatures up into the Arctic. Over the past day or two, these average above freezing temperatures have spread to cover much of the Beaufort, Chukchi, and East Siberian Seas, a knuckle of this warmer air reaches almost all the way to the North Pole even as the region of below 0 Celsius temperatures stretches and thins.
This large bulge of warmer air also shows areas near the Mackenzie Delta and in the East Siberian Sea with average temperatures above 5 degrees Celsius and areas hugging the coast averaging above 10 degrees Celsius. This is a powerful warming that is likely to impact ice-covered regions.
Models show warmth in the area continuing through at least next week. Barrow Alaska, notably, is predicted to see high temperatures around 65 degrees Fahrenheit by this Thursday.
The see-saw motion of the Persistent Arctic Cyclone has now alternately drawn warm air in from Scandinavia and Kamchatka. It is worth noting that a region of hot air has again developed over North-Eastern Europe. These warmer temperatures, should they persist, are likely to be drawn into the Arctic when/if the Cyclone again shifts to the Canadian side of the Central Arctic.
A more current temperature map shows this warming as a display of hot pinks over North-Eastern Europe, with warmer air even extending into the Kara Sea. A cursory look also shows very few readings below the -2 Celsius freezing point of sea water. Yet one more sign that warmth is building.
It is also worth noting that the coldest reading on Greenland, now, is -1 Celsius, where warming temperatures there have fueled a burst of early season glacial melt. Melt values have spiked well above what is typical for June and entered territory usually reserved for July — the height of the Greenland melt season.
Melt areas for Greenland spiked to over 20% of the ice sheet surface over the past few days. Maximum melt area averages around 23% during mid July. So Greenland melt this year is already at least a month ahead of schedule and has more than caught up with slower melt experienced during May.
Last year, Geenland set new melt records with melt exceeding any period in at least the past 120 years.
Overall, conditions throughout the Arctic point toward a rapidly progressing melt season. Temperature measures and temperature and weather forecasts over the coming days are likely to continue to push more rapid sea ice melt. Sea ice edge melt and damage due to the ongoing Persistent Arctic Cyclone of 2013 are likely to be the greatest contributors. Large spikes in early season melt to record or near record values are certainly possible given current conditions.
Greenland melt, already proceeding more rapidly than normal, will also bear close watching. It may be possible that melt values will challenge records set in 2012. Should such an event occur, we will have yet more proof that current, very rapid, ongoing, and increasing Greenland melt is well outside the range of ‘normal.”
After a warm winter, the spring that followed has been a cool one for Greenland. An upswing in the jet stream that had warmed Baffin Bay and the western coast of Greenland through early April faded and ice sheet melt through May has been slower than average.
But over recent days warmer air has moved into Greenland, melting ice along its coastal edges. This warm air influx was driven, in part, by a heat-wave in Scandinavia that then spilled warmer air over the North Atlantic and into the Arctic. This region of warmer air also invaded parts of the northeast coast of Greenland.
As temperatures increased, so did melt rates. By June 4, pace of melt was again well above average.
Melt occurred most intensely along the eastern and northern coasts with lesser amounts showing along the edge of Baffin Bay. Overall, about 15% of the Greenland Ice Sheet was showing melt by June 4.
2013 Compared to Past Years
During 2012, record summer heating caused the entire Greenland ice sheet to melt for some days during July. This kind of melt hasn’t been seen for over 100 years but many scientists are now predicting that 2012 melt paces could be seen as often as twice per decade or more.
And Greenland’s pace of melt is accelerating. During the 2000s rate of Greenland ice melt is five times that of the 1990s. During the past 20 years, Greenland has melted more than in any comparable period during the past 10,000 years.
That’s not to say that every year will be a record year like 2012. At this point, there’s no way we can tell if 2013 will meet or exceed Greenland’s melt during summer a year ago. Usually, it’s not the case that you get back to back records.
So far, the weather pattern hasn’t been as conducive for Greenland melt this year. But, lately, the Arctic has been very unstable and the weather rather unpredictable. So it’s worth keeping a close eye to Greenland as summer progresses.
An Arctic cyclone that has persisted for nearly two weeks has now shifted to a region just north of the Canadian Arctic Archipelago, strengthening to a 980 mb low.
The low originated in the Beaufort Sea about two weeks ago. It transitioned to the central Arctic, remaining there for about a week, before finally moving to its current position over the Arctic’s thick ice.
Observations via Lance Modis satellite shots, CICE, JAXA, and Uni-Bremen, have shown a moderate but ongoing thinning of the ice pack beneath this persistent cyclone. Ice thinning appears to be driven by a combination of divergence, surface mixing in areas near the ice cracks, and by cyclonic forces that encourage upwelling of warmer waters beneath the ice.
As the cyclone is currently predicted to persist and strengthen, impacts are likely to continue and could potentially worsen over the coming days. These include:
Diverging sea ice.
Thinning sea ice via ocean surface churning and upwelling of deeper waters beneath.
Influxes of warmer air behind the storm.
Since the storm is projected to intensify and to last for such a long time, we’ll be taking a more in-depth look at the above melt processes, how they may unfold, and why this particular storm may continue to cause trouble.
How Ekman Transport and Mixing Can Erode Sea Ice
Sea ice traps a layer of cold water near the ice. This layer is usually colder than areas of water as close as 20 meters below by about one or two degrees C. So even in winter, contact with deeper water can enhance bottom melt on the ice. As seasons change to spring and summer, a persistent sun plunges through the ice, further heating this layer just below the cold surface. This, 3-5 degree C warmer, water packs a bit more punch to heat and melt the surface ice. Usually, this layer doesn’t come into contact with the ice. But winds, tides and ocean currents can all stir up these deeper, warmer, layers enhancing ice melt.
In particular, cyclonic action generates upwelling through a process called Ekman Transport that can shift this warmer layer toward the surface and melt the bottom edge of the ice.
During the Great Arctic Cyclone (GAC) of 2012, a University of Washington Study found that a combination of churning and upwelling resulted in 60,000 square miles (150,000 square kilometers) of additional melt.Now that’s a huge chunk of ice taken out by just one storm.
The University of Washington Study noted:
… the ice melted largely from warm ocean water churned up by the passing storm. Melting quadrupled during the storm, and the rate of ice loss doubled, the study found.
In the Arctic summer, ocean water becomes stratified from melting ice, according to a statement from the University. A layer of ice-cold fresh water sits just beneath the sea ice. But about 65 feet (20 meters) below the surface, there is a layer of denser, saltier water that has been gradually warmed by the sun’s rays.
However, this cyclone was both stronger than the current one and it occurred during August, when the sun had two months more time to heat ocean waters below the ice. Further, it occurred in a region where ice was far more fragile. These factors all enhanced the GAC’s ability to impact sea ice.
2012-2013 Cyclones Reveal Fragile Ice
In the current cyclone what we have seen is a more general erosion of the central ice. Impact has been significant and this particular cyclone is doggedly persistent, continuing to chew away the ice over very long periods.
Cyclone-induced thinning appears to have happened primarily via dispersion and through upwelling impacts to the ice bottom. CICE, JAXA, and Uni Bremen confirm a continued thinning. Cloud cover has obscured most visual sensors this afternoon, however. So we will have to wait for another day or two before we can see down to the central ice surface to confirm what these other measures are telling us.
Nonetheless, we can still take a look at current and predicted thinning via the US Navy’s CICE measure below.
Note the barreling action of the low making doughnut-shaped impressions and leaving thinner ice in its wake. During the last series of frames, CICE shows the thickest ice just north of the Canadian Arctic Archipelago (CAA) taking a hit. Since the low is now in that region, we should be able to observe if CICE predictions continue to bear out.
A-Team over at the Arctic Ice Blog has also provided confirmation by putting together this animation of JAXA images to record ice thinning and divergence in the region:
Note the rapid, counter-clockwise ice movement and expansion of cracks as the cyclone churns through the central Arctic.
Usually such impacts would not be so readily visible on the central ice. Some minor to moderate bottom thinning via cyclonic forces may have occurred in past years. The thicker ice of those years was better able to withstand such impacts. Further, the spreading of ice over larger portions of the Arctic tended to keep cold air in place longer, further reducing overall melt.
In this case, the extraordinarily thin condition of even the central ice enhances the impacts of all forces acting on it. So though these lows spread out the central ice, likely reducing the overall rate of edge melt, they do so at the cost of thinning the central ice, making it very vulnerable to melt as summer progresses. For this, somewhat early-season, storm to be showing enhanced thinning in the Arctic is yet one more visible proof of the ice pack’s fragility. And it is the primary reason we are talking about impacts to the central Arctic in early June and not impacts to traditional melt regions for this time of year like Hudson Bay.
Warm Air Pulse
A pulse of warm air following the storm pushed North Poll temperatures above freezing yesterday. Those higher temperatures currently remain in effect but are predicted to shift toward the Kara and Laptev Seas by tomorrow. This pulse has already enhanced ice thinning and melt near Svalbard. However, a layer of cloud riding over top of the warmer air has obscured much of the thicker ice.
You can see this column of cloud riding the warmer air in the Lance-Modis shot below.
In the wider shot, this kind of warm air and cloud influx can look a bit like a blow torch shooting up into the Arctic. If the air beneath the cloud is both warm and moist, it can have a similar effect on Arctic ice. Moist air carries more heat energy than dry air. So an influx of warm, moist air packs a bigger blow to the ice.
It’s an uncanny visual for a warm-air eruption caused by a fragmenting jet stream. You can view the wide-shot here.
Weather Forecast Shows Cyclone Hanging on Until June 14
ECMWF forecasts show the cyclone hanging on until at least June 14th. Should that happen, our cyclone, which Neven has dubbed the Small Arctic Cyclone of 2013 (SAC), will have lasted at least 20 days running. Some runs show the cyclone strengthening to 975 mb, just 9 mb short of the Great Arctic Cyclone of 2012. This would make the storm, at peak, a rather strong event, perhaps one worthy of a name upgrade to Persistent Arctic Cyclone of 2013 (PAC). And, if it ends up thinning the ice more than currently predicted it could end up becoming the Catastrophic Arctic Cyclone of 2013 (CAC).
We’re currently just witnessing thinning, not catastrophic thinning. So let’s hope it doesn’t come to that.
But since the forecast is for this storm to hang on for such a long time and to repeatedly move over regions of the central Arctic, we will have the opportunity to observe its impacts over the next two weeks. It is ample enough time to reduce much of the central ice to tiny fragments. A potentially very low resilience as the heat of July approaches.
The June 14 ECMWF forecast shows our cyclone as a double-barrel 995 mb low in the central Arctic north of the Kara and Laptev Seas, pulling warmer air over the Beaufort and CAA behind it.
We’ll keep a close watch on this storm. It’s not done by a long-shot and there may yet be a few surprises in store.
UPDATE:
Just wanted to share this image of the strengthening Arctic cyclone. Note the tight, cloud-wrapped formation at the center. Most of the area is covered in clouds but, upper left, we see a network of cracks forming in the central ice.
A moderate-strength cyclone that emerged about six days ago and is expected to last at least until Monday is slowly chewing away a large area of Arctic sea ice near the North Pole. Cyclonic action generated by the storm is now resulting in an unprecedented thinning of central Arctic sea ice. It is important to note that should this ice thinning continue, it could have major impacts on end summer sea ice this year.
The low that is causing the trouble moved out of the region of the Beaufort Sea, skirted East Siberia and had transitioned into the central Arctic Ocean by about May 24th. Since then, it has persisted, remaining nearly stationary with a slow drift back toward the Beaufort. Forecast maps show the low remaining in this region until at least Monday before it weakens and moves toward the Mackenzie Delta. Strangely, long-rage forecasts show it re-strengthening even as it returns to the central Arctic.
Minimum central pressure continues to hover around 990 millibars. This moderate strength compares to the much stronger Great Arctic Cyclone of 2012 which bottomed out around 960 millibars. However, the storm is quite strong for this time of year, when Arctic cyclones tend to be rare and weak, containing enough energy to generate winds that erode sea ice.
This erosion takes place via a pumping process by which the ice is pushed against the ocean surface by the cyclonic wind field. This motion, in turn, stirs up the underlying waters creating a warm, upwelling current. Since the forces occur over broad regions, powerful surface forces allow the upwelling to dredge deep, causing mixing between surface and lower layers. Tendrils and micro-currents of warmer water thus rise to contact the ice. This action can melt the sea ice from below, breaking it into smaller chunks, opening polynas, and riddling the ice with leads. If the storm grows strong enough, large wave action can devour whole sections of ice. But, in this case, the storm does not appear to be powerful enough to generate this kind of wave action.
Since 2012, we have already seen two major upwelling events. One, already mentioned, was the Great Arctic Cyclone of 2012. The second, involved strong off-shore winds during February and March which pushed ice away from shore and, in the region of Barrow Alaska, resulted in near-shore upwelling that temporarily melted ice even as it was pushed out to sea. The combined result was open water during winter.
We can see the storm’s current and projected impacts on the CICE model run posted at the top. CICE is projecting the development of a large area of thin and fractured ice near the North Pole in the storm’s wake even as a region of thick ice north of the Canadian Arctic Archipelago erodes. These projections show average thickness in a wide region falling from about two meters to less than one meter.
That’s very thin ice for North Pole regional waters.
Already, some impacts from the storm are visible in Lance-Modis shots of the region.
In the above shot, we can see the center of our moderate-strength cyclone near the middle-left portion of the image. To the right of the storm center, we can see down through the clouds to areas where the ice has fractured, revealing the dark blue waters beneath. Below the storm center and near the lower left-hand corner of the image is the North Pole. So what we are seeing is a broad area of leads and fractured ice with gaps measuring up to about 5 km wide within 200 miles of the North Pole. This kind of development is not at all usual for late May, much less late August.
CICE model runs show ice in this region continuing to thin, fracture and weaken as the storm passes.
As the storm moves away, it is expected to pull warm air in behind it, which could further weaken the ice. ECMWF weather forecasts show this warm air influx occurring by about June 4:
In the above image, we see 5 degree C temperatures plunging directly into the heart of the Arctic. A powerful late spring event should it emerge.
In the past, storms of this kind have had very little impact on sea ice. However, this year the ice is very thin and spread out. Most ice in the Arctic is showing a thickness of two meters or less. Records of past melt seasons show that two meter or thinner ice is unlikely to survive the melt season.
Furthermore, packs of much warmer air are drawn closer to the Arctic center by a wavy pattern in the jet stream. The result is that large north-south swoops draw warmer air up from the south even as they push Arctic air into more southerly regions. Europe, in particular, suffered due to this mangling of the jet stream. Ironically, a growing body of scientific evidence shows that these very changes in the jet stream are a result of loss of sea ice. So it appears that loss of sea ice is resulting in a snow-balling of forces that contribute to its ultimate demise.
The ultimate result is an Arctic-wide ice thinning impacting even the most central and protected areas. Even in this region of the central Arctic, where ice is usually much thicker, large regions of 2 meter or thinner ice dominate. You have to venture closer to Greenland and the Canadian Arctic Archipelago to find areas of ice thicker than 2 meters. However, as the recent evacuation of a Russian Arctic Expedition in that region shows, even the thickest ice is far more fragile than before.
The result of all this thin and broken ice is that it is much more vulnerable to surface conditions. A storm moving over thin and broken ice is much more likely to churn it up, breaking it and mixing it with the warmer waters underneath. Last year, we saw this process in action during the powerful Great Arctic Cyclone which emerged in August, churning up a large area of the Beaufort Sea, then drawing warm air in behind it, resulting in major sea ice losses.
At times when ice was thicker, moderate or powerful storms would not pose a threat for enhanced melt. But since 1979, the Arctic has suffered an 80% loss of sea ice volume.
This year, sea ice volume is currently at record low levels. Yet the ice pack is very spread out, boasting an area near 2002 values. This combination of wide coverage and low volume leaves the ice very, very thin and fragile. So now, even moderate cyclones like the one hovering near the North Pole can chew away at the ice.
If the CICE projections bear out, we’ll see the central ice pack greatly weakened in the wake of this storm just as solar radiance and warm air build into mid-June. At this point, such injuries to the ice make it more likely that rapid and catastrophic decline in coverage will begin to dramatically ramp up over the next few weeks.
I feel the Arctic sea ice pack could soon go POP under the right conditions.
Let’s see:
Thin, spread-out ice pack.
Persistent storm chewing away the central ice.
Large cracks and areas of open water riddling most of the ice pack.
Large polynas forming behind the ice edge.
Upwelling events eroding the bottom ice.
Loss of Arctic expeditions in the region of the ‘thickest’ ice.
June heat and constant, direct sunlight approaches.
Looks to me like a lot of the ‘right’ conditions are present.
In short, don’t let the high extent and area numbers fool you. The thin, spread out state of the ice leaves it more vulnerable, not less so. The sea ice is weaker and less resilient than it ever was. Only a cold summer and conditions favorable for ice retention are likely to prevent a record melt in either area, volume or extent. On the other hand, very bad conditions could result in near-total melt (under 1 million square kilometers end season area).
UPDATE:
Long-range weather models show the cyclone sweeping down toward the Mackenzie Delta, drifting back toward the Canadian Arctic Archipelago and finally returning to the Central Arctic by mid-June. Such a prolonged storm event would likely have a continuous weakening affect on the ice. Lower temperatures in the storm’s region would be more than countered by active wave energy and tapping of warmer, deeper waters which will have a tendency to erode the ice from beneath. Furthermore, warmer air is shown to follow in the wake of this storm, which may enhance melt through regions of already weakened ice.
In any case, this is a situation that bears close watching. A month-long, or more, storm harrying the Arctic could have quite an impact.
Earlier this month, John Cook of Skeptical Science published a ground-breaking study in the scientific journal Environmental Research Letters showing that 97% of scientists agreed that global warming is being caused by humans. This study received far-ranging acclaim both in the media and in a number of scientific journals for both its thoroughness and its accuracy. The study is now considered to be the definitive work on scientific consensus on the issue of human-caused climate change.
Over the years, an increasing consensus among scientists that humans are causing an ever more visible and damaging global warming has served as a warning to the world’s public. Sadly, this message has been confused — primarily by monied interests who spend massive amounts to spread doubt on the issue of human caused climate change. The result is that only about half the public believes there is a scientific consensus that humans are causing global warming. In one example, The Heartland Institute, which receives large sums to operate PR campaigns on behalf of oil companies, recently engaged in a campaign to misinform the American public by directly targeting teachers and school children.
The most recent example, however, takes aim at the 97% study itself. According to reports from DeSmogBlog, a non-profit PR firm, which receives most of its money from oil companies like Talisman Energy and operates under the dubious name Friends of Science, has been issuing attack statements directly aimed at creating doubt in the validity of the 97% report. These statements appear to be crafted to generate exactly the kind of misunderstanding the 97% report reveals.
‘Friends of Science’ asserts:
Detailed analysis shows that only 0.5% (65 of the 12,000 abstracts rated) suggest that humans are responsible for more than 50% of the global warming up to 2001, contrary to the alleged 97% consensus amongst scientists in the Cook et al study. Citing fear mongering and faulty methodology Friends of Science reject the study and President Obama’s tweet as careless incitement of a misinformed and frightened public, when in fact the sun is the main driver of climate change; not human activity or carbon dioxide (CO2).
It is important to note that ‘Friends of Science’ did not reveal their methodology to support this statement. Frequent requests for this methodology among the media have been met only with silence. Equally telling is the fact that the statement attempts to politicize the issue by harping on President Obama’s tweet rather than seeking to logically refute the 97% paper. Finally, the organization leans on the typical climate change denier claim that the sun is the primary driver of present warming. A claim that has been dis-proven over and over again in the scientific literature, should ‘Friends of Science’ care to read it. Or they could simply go argue with NASA whose instruments show that though solar irradiance is declining, the Earth is still accumulating more heat than it radiates out into space. Clearly, based on these statements alone, it’s obvious ‘Friends of Science’ doesn’t even know the science they’re purportedly talking about.
On the other hand, the 97% percent study is entirely transparent in its own methodology. In short, John Cook’s survey asked the scientists who authored the papers what the consensus position of those papers were.
From the 97% study methodology:
Nobody is more qualified to judge a paper’s intent than the actual scientists who authored the paper. To provide an independent measure of the level of consensus, we asked the scientists who authored the climate papers to rate the level of endorsement of their own papers. Among all papers that were self-rated as expressing a position on human-caused warming, 97.2% endorsed the consensus. This result is consistent with our abstract ratings, which found a 97.1% consensus.
In addition, the entire database of the 97% study’s methodology is available as part of the study’s publication. So from ‘Friends of Science’ we have a statement issued that is unsupported, that directly goes against the scientific findings of major organizations like NASA, and that directly refutes the claims made by scientists about the papers they authored.
Not very scientific. And not at all friendly to science. But you can bet that the denier blogosphere will go nuts over this ‘Friends of Science’ canard.
Last month’s Arctic sea ice cracking event has left the Beaufort ice pack particularly vulnerable to rapid transport. This mobility can be seen in the above image sequence provided by Arctic Sea Ice blog poster: A-Team.
The sequence reveals very rapid motion in the freshly broken ice by tracking the largest crack’s rate of movement. According to A-Team’s back of the napkin analysis, this crack is moving at a rate of 11.7 kilometers per day. Buoy measurement of sea ice motion also shows very rapid movement of Beaufort ice, especially at the ice edge.
Rapid ice motion is yet one more indicator of the Arctic’s current fragile state. Record low or near record low sea ice volume, area and extent, nearly constant above average air temperatures, above average ocean temperatures, more volatile Arctic weather, and the continued transport of warmer, stormier air masses into the Arctic via blocking patterns completes a context of rapid change. You can read more about this ongoing climate phenomena here.
Signs of increasing melt
Spring sea ice melt also showed signs of picking up pace today with both the Japanese Space Agency (JAXA) and Cryopshere Today showing drops in both sea ice extent and area. Sea ice area showed a daily drop of about 50,000 square kilometers. This rate of loss is a bit faster than usual for this time of year which tends to show mostly gradual melt. But the big loser, according to JAXA, was sea ice extent which appears to have fallen by about 100,000 square kilometers in one day. This new JAXA estimate is preliminary. So validation will have to be made for such an apparently precipitous fall so early in the season. If validated, this will show a very significant loss of sea ice for a date so early in the year. And, if such a trend were to continue, it would be nothing short of devastating. As noted before, the figure is preliminary and subject to correction. So let’s not get too worried yet.
Weather conditions in the Arctic remain far warmer than average for this time of year. Temps throughout most of the region range between 2 and 10 degrees Celsius above average with local spikes at 15 degrees C above normal. Our favorite weather spot — Nuuk, Greenland — showed a high temperature today of 54 degrees Fahrenheit. This is 28 degrees Fahrenheit above average and likely at or near a record high for today.
Strong negative arctic oscillation (AO) has, once more, taken hold. AO values have returned to the negative 3.5 range with a strong area of high pressure forming over the Beaufort. This high is expected to promote rapid sea ice motion over the East Siberian Arctic Shelf as well as in the region of the Fram Straight. The North Atlantic Low has backed up over eastern Canada and remains locked into position near Hudson Bay. This low continues to pump warm air up into Baffin Bay and a region surround Nuuk.
Overall, slow to gradual melt should continue throughout the Arctic. However, as April proceeds there is some increased risk of anomalous events as the potential for disruptive weather rises toward mid-month. April is usually a slow melt month. But the continued fragile state of the Arctic sea ice must also be taken into account. We’ll also keep an eye on those strong melt numbers coming from JAXA. Should they validate, April could turn out to be a very volatile month.
On March 15, 2013, Arctic sea ice extent appears to have reached its annual maximum extent, marking the beginning of the sea ice melt season. This year’s maximum extent was the sixth lowest in the satellite record. NSIDC will release a detailed analysis of the 2012 to 2013 winter sea ice conditions in early April.
So here we are, 9 days into the melt season. Par for the course, we have sea ice melt continuing in most key measures today. Here is a visual of the sea ice extent data from NSIDC:
As you can see, NSIDC extent measures take a rapid dive right to the edge of the -2 standard deviation line. This is a pretty steep decline rate so early in the year and we’d expect it to pause now and then. With current major ice sheet fracturing and storms churning up the ice edges in the Barents and Sea of Okhotsk, these measures will bear close watching.
Fracturing and Rapid Ice Motion
Speaking of fracturing, it is certainly worth taking another look at the very splintered mass of thick ice north of Greenland, the CAA, and Alaska. The most recent satellite shot from the Canadian Weather Office is almost tragic in its poetry. A view down through the clouds provides some stark contrast for all those cracks and leads that have opened up over the past month:
This image provides a static shot of an Arctic in rapid transition. The cracks you can clearly see, however, provide a hint to how volatile even the early spring Arctic has become. What the US Navy CICE map shows (analysis provided by A4R) is that a broad section of thick, multi-year ice is now on the move. It is possible that this new motion will further crack an already fractured system, creating even more leads and melt avenues for spring and summer warming. The CICE motion forecast is below. Again, something that bears close watching:
Lots of features in this Navy ice motion model worth discussing. The first is the motion of thick ice moving away from Greenland and the Canadian Arctic Archipelago (CAA). This is the motion I mentioned above which may result in further fracturing of the thick ice. Other features show rapid movement of ice out the Fram Straight. Fram is, essentially, the graveyard of sea ice, so rapid transport out the Fram is not good for overall ice health. Moving further south, we can see a pretty rapid east-to-west flow in Hudson bay. At this time of year, Hudson is still ice clogged. But we might end up with thinner ice on the east end as a result.
Next come the low pressure systems. The first, rather weak, system appears just north of western Canada and eastern Alaska. This system seems to be combining with a high pressure near Greenland to lift thick ice away from Greenland and the CAA. The second appears in the Bering Sea and appears to be doing a decent job mixing the thin ice there. Finally, a strong low in the Sea of Okhotsk is turning thin ice in that region into a big blender.
Slight Cooling Continues, Temps Still a Bit Above Average
A gradual cooling trend that began a few days ago appears to have bottomed out today. That said, temps still remain mostly above average throughout the Arctic. Taking a look at the global temperature composite provided by NOAA shows much of the warmth concentrated over Greenland, Baffin Bay, and the CAA with other pools of warm air concentrating over the East Siberian, Laptev and Barents Seas.
Overall, conditions still appear to favor slow, overall melting with erosion of sea ice in the Bering and Okhotsk Seas somewhat offset by ice attempting to expand east of Svalbard. Rapid ice transport out the Fram Straight and thick ice lifting away from Greenland and the CAA may create further weaknesses in the ice that could have greater impacts later in the season. We should have a better view of any possible impacts come tomorrow.
A historic US Drought that began in Texas in 2011, receded for a brief time, and then expanded to cover as much as 65% of the continental United States still troubles much of the country. Currently, according to reports from the US Drought Monitor, more than 53% percent of the contiguous United States still suffers from some level of drought.
Dryness persisted across much of the western US during winter. However, beneficial rains and snows did alleviate some drought in the center of the country. These drought conditions put the US wheat crop at risk throughout much of winter. While concern remains that wheat harvests will be below average, precipitation in parts of Iowa and other portions of the mid-west may have mitigated some of the damage.
Kansas, Nebraska, Oklahoma, Texas, South Dakota, New Mexico, Colorado and Wyoming are still feeling the drought’s worst effects. Texas has been forced to tap into its emergency fund as it enters its third year of drought. Water shortages have led to the lowest cattle stocks for the state since 1952 and sparked an ongoing conflict over water with New Mexico. Texas and New Mexico’s conflict over water is now awaiting a resolution from the US Supreme Court.
Unfortunately, current forecasts by NOAA indicate persistent and intensifying drought in many of the hardest hit areas. While Nebraska and North Dakota may see some relief, much of Kansas, Oklahoma, Texas, New Mexico, Colorado and Wyoming remain under the gun. Further, forecasts indicate that conditions could worsen in Texas, Arizona, and California, while also spreading into much of Florida.
It looks like the next three months will see much of the US continuing to suffer from drought. Although the heat and dryness are not as severe as 2012, impacts are likely to remain high for hardest hit states. Overall, agriculture may not take as heavy a blow in 2013 as in 2012, but serious challenges will remain for many of the nation’s farmers. On the bright side, improvement appears likely through much of the US grain states of Iowa, Minnesota, Arkansas and Indiana. So, hopefully, improvement in these regions will help balance continued and increasing trouble in the west.
Taking into account the Texas drought of 2011, the historic drought of 2012, and the current drought, large portions of the US are now entering their third year of drought. A combination of a warming globe and weather patterns favorable for drought likely contributed to last year’s damage. In 2013, weather patterns that would normally contribute to drought have moderated somewhat but the persistent, long-term impacts of global warming remain. And these changes are predicted to result in a drying of the Southwestern states of the US to continue long-term.
“We don’t have many modern precedents for what the models are suggesting,” ~NOAA
* * * * * * * *
There’s a monster forming off the East Coast. It comes in the form of a late season hurricane, Sandy, the 19th of 20 storms so far this season. It comes in the form of an Atlantic Ocean abnormally hot for this time of year, hot enough to fuel this unseasonably powerful storm. And it comes in the form of a second strong storm, this one born of the Arctic, sweeping down from the north.
The concern? That these three weather phenomena — an Atlantic Ocean heated 5 degrees above average by human caused global warming, a powerful hurricane fueled by that same warming, and a winter storm intensified by growing extremes in temperature differences could all combine into a storm worse than the so-called ‘Perfect Storm’ that harried the Northeast and ravaged shipping lanes back in 1991.
The timing of the possible conjunction of these storm occurs this weekend and extends into the middle of next week. Uncomfortably close to election day. Which begs the question — was it so wise for Mitt Romney and Republicans to deny climate change? And was it a good choice for Obama to decide not to publicly press the issue during the debates? Yes, the oil companies are rich and powerful and spend lots of money in an all-too-human attempt to morph public opinion to their ‘special,’ and increasingly damaging, interests. But what about Mother Nature? What about her say in all this heat-causing carbon dioxide being pumped into the atmosphere? Never a good bet to ignore her.
As Brad Johnson over at ClimateSilence.org noted: “Sandy is yet another reminder that the candidates should stop competing over who can poison the weather faster with increased oil, gas and coal production.” Of course, Brad did fail to mention that under President Obama, alternative energy production has doubled, Obama set CAFE standards to increase to 55 mpg, and that he has been the strongest Presidential advocate yet for policies that reduce the impact of climate change. All that said, publicly competing over who would increase fossil fuel production the most certainly did not send the right message.
And the forecast is for something very close to Brad’s version of ‘poisoned weather.’
Here is the current satellite view of Sandy. It shows a massive storm currently located over the southern Bahamas. Its maximum sustained winds are now 105 miles per hour and it is strengthening over the hot waters of the Gulf Stream. Sandy is powerful enough to lash central Florida with rain bands and gusty winds from more than 400 miles away. If you look at the massive and extensive structure of Sandy, you will see that its feeder bands stretch as far south as South America and about 800 miles northeast into the Atlantic.
This is a massive, massive storm. And it is poised to combine with a powerful winter storm sweeping down from Canada and grow even larger. The merging of these storms is expected to inject energy into Sandy, spreading out its tropical storm wind field over a radius of 300 miles. This is expected to push a powerful storm surge over the mid Atlantic and Northeast coastlines starting this weekend and extending into mid-week. This event coincides with full moon high tides and, according to Jeff Masters over at Weather Underground, could be a 1 billion dollar storm.
Somewhat troubling is the fact that the most reliable models are predicting Sandy could make landfall in Delaware with a 940 mb central pressure. This is an extraordinarily low pressure for a storm so far north. Jeff Masters, however, doesn’t believe that particular prediction will bear out. He still expects an immensely powerful storm, just not quite that powerful. Comparisons have been made between this storm and the ‘Perfect Storm’ of 1991. That said, this particular storm combination may be even stronger than the one that formed in 1991. Furthermore, it is moving along a path that makes it much more likely to directly impact the US East Coast.
So the Perfect Storm appears to have been just a prelude to increasingly dangerous weather, growing worse and worse as more and more greenhouse gasses are pumped out.


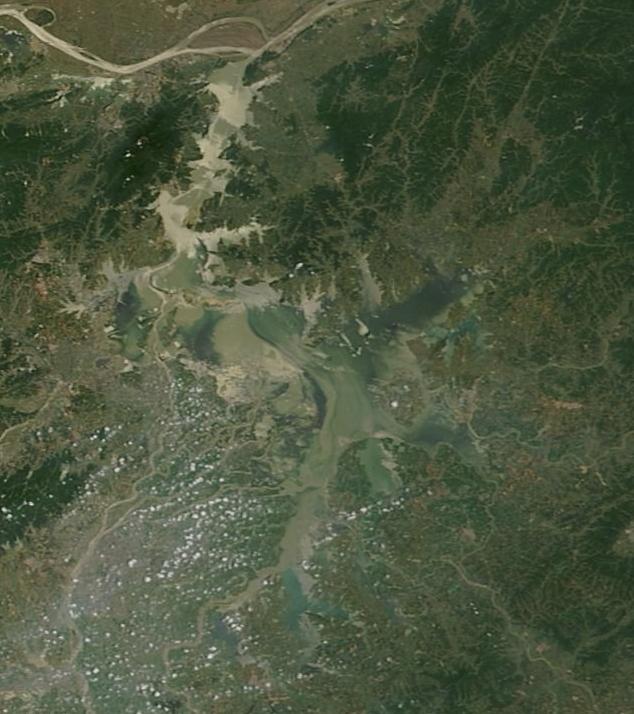


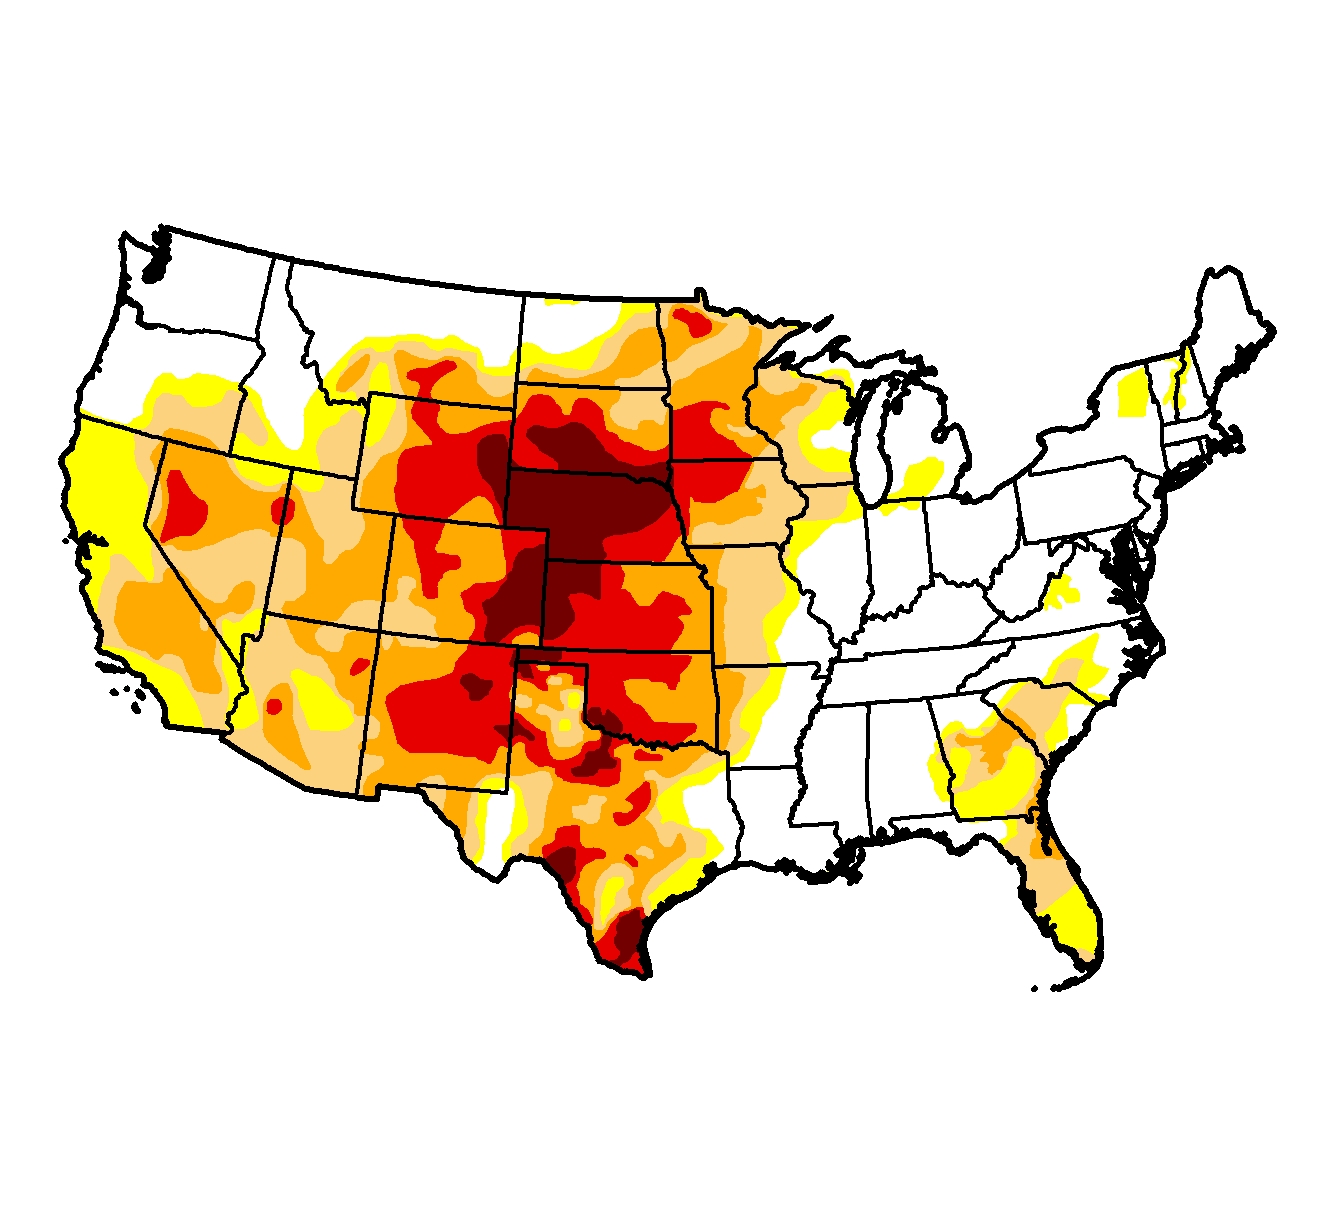


