It seems that every time a snow storm or burst of cold weather roars out of a less stable and warming Arctic, the news media is all a-buzz. Perhaps this is due to the fact that these events are abnormal in their own right. Perhaps because they are more and more the extreme punctuations and back-blasts of a larger warming climate. Perhaps it is due to the fact that cold events are steadily becoming more of a nostalgic novelty even if, when they do arrive, they can come on with a fierce intensity.
(The overall trend for winter is one of warming. This despite the fact that more extreme Jet Stream patterns due to polar amplification can still produce bursts of cold weather. Note that regions furthest north are warming the fastest. Image source Climate Central.)
In the larger trend of warming and related climate change signaled extremes, the U.S. fall and winter of 2017-2018 is no exception.
The Northeast, by comparison, which has seen the bulk of news coverage for recent briefer, less consistent, generally less intense cold events, has, at most, seen temperatures ranging 2-3 C (3.6 – 5.4 F) below average. In other words, the peak warm anomalies are beating out the peak cool anomalies by about 3 C — or 2 to 1 on the basis of intensity overall.
(Most of the U.S. has been much warmer and much drier than normal during the Fall and Winter of 2017-2018 with western heat and drought as the prominent feature. Image source: NOAA.)
(Though a handful of regions are experiencing cooler than 30 year average temperatures on February 7 of 2018, most of the globe today is much hotter than normal. Note that cold snaps, where they do occur appear to be concentrated in the Northern Hemisphere mid-latitudes. Also note that none of the major climate zones are experiencing below average temperatures even as much warmer than usual conditions are concentrated at the poles. These are all signatures of a warming world. Image source: Climate Reanalyzer.)
Despite a general overlooking of the context and causes for mid latitude weather extremes as identified by climate science, perhaps the most under-reported weather and climate change related story of the Winter of 2018 is the return of drought. Presently, more of the Continental U.S. is under drought conditions than not. And we are now experiencing, as a nation, the largest drought footprint in four years.
This is notable due to the fact that four years ago — 2014 — the U.S. west was experiencing one of the worst droughts in its history with California in the grips of a six year long extreme drought period. In other words, it would take both widespread and intense drought conditions to begin to compare to the 2014 drought situation either in extent or intensity.
With California receiving so much rain last winter (2016-2017) it is also notable how rapidly drought conditions have returned. California exited a drought emergency just a little more than a year ago. Now, a similar situation is again looming. Snow packs there are swiftly diminishing — and are presently just 27 percent of average for a normal February. Fire hazard never really went away following the record blazes of spring, summer, and fall of 2017. And concern over water reservoirs is again an issue on the minds of city and state emergency planners.
As is the case in climate change related impacts on Cape Town, South Africa’s own dwindling water supply half a world away, warming related concerns are a serious issue now for California and the U.S. West. And the fact that the most populous state in the U.S. may again be facing a similar crisis so soon after the 2012-2017 drought is a major piece of weather and climate news that everyone should be reporting. It’s part of a larger and ongoing climate crisis that a few flakes of snow or even a few severe cold snaps across the Northeast can’t really even hold a candle to. Especially when a jet stream riled by an Arctic forced to warm through human fossil fuel burning is the common thread running between both the eastern cold snaps and the western heat and drought.
Unseasonable warmth across the American West and overall dry conditions across the South is causing drought to expand throughout many parts of the United States.
According to the U.S. Drought Monitor, most of the southern half of the United States is presently experiencing abnormally dry or drought conditions. Meanwhile, an intense drought that has remained in place over the Dakotas and Montana for multiple months continues to persist.
Severe drought conditions are now present in the south-central U.S. with exceptional and extreme drought expanding through Arkansas, Oklahoma, Texas, Louisiana and Missouri. Deepening drought in California and Texas are notable due to the fact that Southeast Texas recently experienced record rainfall due to Hurricane Harvey and California experienced a very wet winter and spring period from 2016 to 2017. Somewhat milder drought is also spreading through the Southeast.
A strengthening La Nina in the Equatorial Pacific is helping to generate a drought tendency for the Southern U.S. However, various climate change related features including above normal temperatures and a persistent high pressure ridge in the West are lending intensity to the rising drought regime.
(U.S. 30 day average shows much warmer than normal conditions for the lower 48 with extreme warmth prevalent over the American West. Image source: Global and Regional Climate Anomalies.)
Over the past 30 days, temperatures for the U.S. as a whole have been 1.52 C above average (see image above). Much of this excess heat has been concentrated over the West, with mountain and Pacific regions seeing between 4 and 5 C above average temperatures.
Linked to the western heat and drought is a strong and persistent high pressure ridge. One that has hit a very intense 1041 hPa pressure as of Monday afternoon over the U.S. Mountain West.
(Very intense high pressure ridge over the U.S. west is presently locking in both warmer than normal and drier than normal conditions. Image source: Earth Nullschool.)
Present drought is nowhere near as intense as it has been during recent years. Especially in California which during 2017 has experienced a bit of a respite. However, with La Nina gaining traction in the Pacific, with global temperatures now in a range between 1.1 and 1.2 C above 1880s averages, and with persistent ridging again taking hold over the U.S. West, the risk of a return to intense drought — especially for the Southwest — is increasing.
We know that climate change pushes the weather toward extremes, but this is getting ridiculous. In California, in less than a span of 24 months, water levels at a key reservoir have shifted from record drought to a flood that’s now endangering the state’s water supply system. Unfortunately, it’s these kinds of extreme shifts that we’ve come to expect from human-forced climate change.
(2011 to 2016 included the driest period on record for California producing extreme water stress for the state. Image source: The US Drought Monitor.)
A 2015-2016 El Nino brought hopes of rain. It also brought concerns that when the rains did finally arrive, they would come as deluges. This concern was driven by the fact that the warming atmosphere now holds an unprecedented amount of moisture. With much of that extra moisture bleeding off of the Pacific Ocean and with El Nino producing a tendency to both intensify the Pacific storm track and to aim rivers of moisture at California, these concerns appeared to be at least somewhat valid.
But, for the most part, the rain held off — increasing concerns that a drought that had already lasted for five years could continue. That an odd weather pattern called the Ridiculously Resilient Ridge might be a semi-permanent feature spurred by warming in the Arctic and a related movement of the Jet Stream northward.
Followed By Record California Flooding
The Jet Stream did flatten and the rains did eventually come, however. And when they did, it was at the oddest of times — when El Nino had long since faded and a weak La Nina — which typically brings drier conditions to the U.S. West Coast — was in full bloom. By January of 2017, the pattern had switched. And when it switched, it switched hard.
A massive river of moisture began to flow from the Philippines all the way to California during December of 2016. The atmospheric river linked up with a raging storm track running 6,000 miles across the Pacific from Japan to the U.S. West Coast. And this combined moisture flow and vigorous storm pattern has pummeled the U.S. West Coast for the better part of six weeks.
(Throughout the winter of 2016-2017, a powerful, 6,000 mile long, river of moisture has produced a succession of strong storms running into California. This weather/climate feature is occurring in a record warm/moist atmosphere. The result has been that conditions in California have shifted from extreme drought to extreme flood. Image source: TPW Version 2.)
…by one important measure, there’s been more rain and snowfall in the 2016-2017 water year than any other season on record, to date. The California-Nevada River Forecast Center uses an eight-station index in the North Sierra to quantify the region’s precipitation. As of Feb. 12, these eight stations have received 68 inches — 226 percent of normal.
Weather Extremes Damage Critical Water Infrastructure
The Lake Oroville Dam had never seen so much water flowing into its backing reservoir since its completion in 1968. By January, Dam operators were already releasing considerable flows of water through its primary spillway to reduce pressure off the 800 foot tall structure trapping water within the reservoir. By February, more than 55,000 cubic feet of water per second was sent raging down the spillway in an effort to keep water levels below the over-topping line. Unfortunately, the spillway structures supporting the Dam have likely never seen so much continued stress from strong water outflows related to record high water levels. And as of last week, the powerful floods of water released from the Dam had damaged the primary spillway. The spillway’s concrete apron had eroded and initially produced a 300 foot wide sink hole near the top of the spillway that later expanded.
(Lake Oroville forced to use emergency spillway resulting in severe stress to key California water infrastructure. Video source: KCRA.)
Concerns about how an expanding sink hole in the reservoir’s wall could, in the worst case, breach the Dam wall and result in a catastrophic failure spurred operators to shut down and reduce water flows through the primary spillway. The abatement resulted in water levels at Lake Oroville rising to above 901 feet. This triggered an automatic over-spill into a second emergency spillway (the first time this has happened in the Dam’s history). But over-topping water also produced severe erosion — igniting more concerns of structural failure. And on the weekend of February 10th -12th, nearly 200,000 people were evacuated from the Dam’s outflow zone as a potential catastrophic structural failure could cause a 30 foot wall of water to rush through numerous downstream communities.
Over recent days, rainfall in the Oroville region abated — providing a brief window for repairs and reducing stress to the Dam. Round-the-clock emergency repairs in the form of bags of boulders used to buttress the Dam appeared to have shored up the Dam. Meanwhile, water levels within the Dam earlier this week were dropping by 4 inches per hour. Mandatory evacuation orders were lifted. And downstream residents began to trickle back in.
(More heavy rain on the way is likely to continue to produce a touch and go situation for the Lake Oroville Dam. If heavy rain continues through spring melt, the Dam could face considerable additional challenges. Image source: NOAA.)
However, the underlying weather conditions that caused so much damage to the Lake Oroville Dam have not yet changed. February and March are typically California’s wettest periods. And the massive river of moisture feeding into a powerful Pacific storm track continues unabated. Over the next 7 days, NOAA predicts that as much as twelve and a half inches of rain could fall on the Lake Oroville region.
Harmed by Drought, Harmed by Flood
So much rainfall will again likely necessitate considerable water outflows from the Dam’s damaged spillways — producing more stress to the already burdened structure. In addition, the arrival of warmer weather come March and April will add snow melt to the already considerable rainfall inflows coming into the Oroville system. To be clear, most experts still think that the overall risk of losing Oroville due to a complete failure of the Dam remain low. However, such a loss would be catastrophic to California.
(As the climate warms, it produces more record hot weather — which spurs increasing instances of drought. In addition, when precipitation does fall, it tends to come in the form of more heavy precipitation events where the rain that does fall, tends to fall more intensely over a shorter period. As a result, the human forced warming of the Earth is producing a general tendency toward more extreme instances of drought and flooding. Image source: NOAA/UCAR.)
The Lake Oroville reservoir provides drinking water to 23 million residents in California and irrigates 750,000 acres of farmland. In the outside worst case event where the Dam does fail, it would produce a water crisis for numerous residents and communities in addition to any damage caused by severe downstream flooding. But even if the Dam holds through the Spring, extreme deposition of sediment from heavy water flows running into the reservoir will also likely pose challenges to water access.
It’s a case of too much or too little. From 2011 through 2016 drought threatened Lake Oroville’s water supplies. Now it’s flooding. And unfortunately, with climate change, we can expect the weather in many regions to take on extreme characteristics or switch hard from one extreme to the other — as has been the case with California.
A river of moisture arises from the Pacific Ocean and links up with a procession of enormous storms that bring heavy surf, flooding rains, and mountain snows to the U.S. West. It’s a weather narrative that one usually associates with a strong El Nino during winter time. But the powerful El Nino ended last year and it failed to bring the expected rains. Meanwhile, in early 2017, during a La Nina year in which typical trends would tend to point to drier conditions for the U.S. West, a procession of severe storms is now slamming into California.
El Nino Pattern During a La Nina Year
So what the heck happened? What could possibly cause such a crazy weather flip-flop in which record drought conditions extend through a time of El Nino but severe and extreme rains come with the onset of La Nina?
The answer appears to be that a record warm ocean combined with a strongly positive Pacific Decadal Oscillation to produce a powerful river of moisture aimed directly at California. And when the associated storms arrived it was with an extreme intensity — setting off numerous flash flood events.
(Water vapor models show an atmospheric river running out of the Western Pacific — crossing that vast ocean before engorging storms slamming into the U.S. West Coast on January 17 of 2017. This is a severe weather feature more typical of an El Nino year that is now occurring during a period of weak La Nina conditions. The difference being that rivers of moisture running into California typically issue over Hawaii. The present ‘Pineapple Express’ is coming all the way from the Philippines. Image source: Earth Nullschool.)
This week, NOAA expects another batch of powerful storms to come blasting out of the Pacific. Sections of Southern California are predicted to get hit with around 9-13 inches of rain over the next seven days while the north receives another 10 to 15 inches. These are notably severe rainfall totals for California. And NOAA model predictions have tended to range higher over the past 24 hours.
(NOAA 7-day precipitation forecast indicates a severe rainfall event for the U.S. West Coast with heaviest amounts hitting parts of Northern California. Image source: NOAA.)
Very Warm, Moist Pacific; Positive Pacific Decadal Oscillation
There’s been very little weather and climate discussion as to why heavy rains are falling in California during a year when the odds stacked against such an event would tend to be higher due to La Nina. The elephant in the room at this time is a major excursion of global surface temperatures in the range of 1.2 C above normal during 2016. A notably severe climate change related insult to the Earth system. Such extreme atmospheric warmth will tend to hold more water vapor aloft in suspension. As a result, when the rains do fall, they will tend to be heavier and come more in the form of downpours and deluges than as moderate or lighter precipitation.
(This sea surface temperature anomaly map shows that despite La Nina, the Pacific Ocean, on balance, is much warmer than normal. These warmer than normal sea surfaces are pumping out a considerable amount of moisture — which is helping to feed the powerful storm systems running into the U.S. West Coast. Image source: Earth Nullschool.)
To this point, despite a La Nina blanketing the Pacific’s central Equatorial region in cooler than normal waters, most of the Northern Pacific is considerably warmer than normal. And all this extra warmth is helping to pump a lot of water vapor into the atmosphere above the ocean zone. A feature that is not typically consistent with La Nina, but one that is consistent with a considerably positive Pacific Decadal Oscillation acting in conjunction with overall global warming. Positive Pacific Decadal Oscillation (PDO) values are associated with above normal sea surface temperatures in the Eastern and South-Central Pacific. Positive PDO tends to produce longer and strong El Nino events. And it is also associated with strong storm tracks running from west to east along the 40 N latitude line.
Storm Track Runs All the Way to U.S. West Coast
To this point, it’s worth noting that PDO has been in a positive range for the past three years running. But it wasn’t until recently that a persistently strong storm track stretching all the way to the U.S. West Coast has developed. During past years, strong storms veered north into Alaska and Canada, deflected by powerful ridges over the U.S. West.
(The crazy, wavy jet stream with a strong storm track hitting California and a ridge riding up into Central Canada is rather changed from the Ridiculously Resilient Ridge blocking pattern that helped to spark severe droughts along the U.S. West Coast during 2013-2015. Now, severe flooding rains are the rule of the day. Under human-caused climate change, we can expect weather patterns to tend more toward extremes. For the U.S. West Coast extreme drought has been replaced by heavy rains. Image source: Climate Reanalyzer.)
Assisting the process of storms running toward the U.S. West Coast was the removal of a hot blob of water off coastal Washington and Oregon as a zone of somewhat cooler than normal waters formed. These cooler waters extended from just off Northern Japan to south of the Aleutians and on toward the U.S. West Coast. This zone is providing a dipole temperature anomaly between the cooler than normal surface waters in the north and the warmer than normal waters in the south. As a result, the Jet Stream has a nice slot along which to produce a powerful, flat storm track. These two features — a strong temperature dipole between the 40 and 50 degree latitude lines and a very warm Pacific producing copious amounts of moisture south of the 40 degree latitude line — are the key ingredients that appear to be fueling the powerful West Coast storms in a counter-La Nina fashion.
In contrast to the 2013 to 2015 period, high pressure ridging along the U.S. West Coast is not now strong enough to deflect the storms running across the Northern Pacific. In other words, it appears that the influence of the Ridiculously Resilient Ridge and hot Ocean blobs off Washington and Oregon during 2013 to 2015 is has now faded out. However, the new climate and weather trends driving this most recent influx of heavy rainfall to the U.S. West Coast are almost as odd and notable.
Jeff Goodell, an American author and editor at Rolling Stone, is noted for saying this: “once we deliberately start messing with the climate, we could inadvertantly shift rainfall patterns (climate models have shown that the Amazon is particularly vulnerable) causing collapse of ecosystems, drought, famine and more.”
We are in the process of testing that theory. In the case of drought, which used to just be a regional affair but has now gone global, Goodell appears to have been right on the money.
****
According to a recent report by the World Meteorological Organization, the Earth is on track to hit 1.2 degrees Celsius hotter than pre-industrial temperatures during 2016. From sea-level rise, to melting polar ice, to extreme weather, to increasing numbers of displaced persons, this temperature jump is producing steadily worsening impacts. Among the more vivid of these is the current extent of global drought.
The Four-Year Global Drought
During El Nino years, drought conditions tend to expand through various regions as ocean surfaces heat up. From 2015 to 2016, the world experienced a powerful El Nino. However, despite the noted influence of this warming of surface waters in the Equatorial Pacific, widely expansive global drought extends back through 2013 and farther.
(The Global Drought Monitor finds that dry conditions have been prevalent over much of the globe throughout the past four years. For some regions, like the Colorado River area, drought has already extended for more than a decade. Image source: SPEI Global Drought Monitor.)
In the above image, we see soil moisture deficits over the past 48 months. What we find is that large sections of pretty much every major continent are undergoing at least a four-year drought. Drought conditions were predicted by climate models to intensify in the middle latitudes as the world heated up. It appears that this is already the case, but the Equatorial zone and the higher latitudes are also experiencing widespread drought. If there is a detectable pattern in present conditions, it is that few regions have avoided drying. Drought is so wide-ranging as to be practically global in its extent.
Widespread Severe Impacts
These drought conditions have noted impacts.
In California alone, more than 102 million trees have died due to rising temperatures and a drought that has lasted since 2010. Of those, 62 million have perished just this year. Drought’s relationship to tree mortality is pretty simple — the longer drought lasts, the more trees perish as water stores in roots are used up. California has, so far, lost 2.5 percent of its live trees due to what is now the worst tree mortality event in the state’s history.
(It’s not just California. Numerous regions around the world show plants undergoing life-threatening levels of stress. In the above map, vegetative health is shown to be moderately stressed [yellow] to severely stressed [pink] over broad regions of the world. Image source: Global Drought Information System.)
The California drought is just an aspect of a larger drought that encompasses much of the North American West. For the Colorado River area, this includes a 16-year-long drought that has pushed Lake Mead to its lowest levels ever recorded. With rationing of the river’s water supplies looming if a miraculous break in the drought doesn’t suddenly appear, states are scrambling to figure out how to manage a worsening scarcity. Meanwhile, reports indicate that cities like Phoenix will require executive action on the part of the President to ensure water supplies to millions of residents over the coming years, should conditions fail to improve.
(Siberian wildfires burning on July 23, 2016 occur in the context of severe drought. Image source: LANCE MODIS.)
In the upper northern latitudes, the primary upshot of drought has also been wildfires. Wildfires are often fanned by heat and drought in heavily forested regions that see reduced soil moisture levels. Thawing permafrost and reduced snow cover levels exacerbate the situation by further reducing moisture storage in dry regions and by adding peat-like fuels for fires.
Drought and wildfires in or near the Arctic justifiably seem odd, but when one considers the fact that many climate models had predicted that the higher northern latitudes would be one of the few major regions to experience increases in precipitation, that oddity turns ominous. If the present trend toward widespread Arctic drought is representative, then warming presents a drought issue from Equator to Pole.
(Lakes and river beds dried up across India earlier this year as the monsoon was delayed for the third year in a row. Image source: India Water Portal.)
India this year experienced similar, but far more widespread, water shortages. In April, 330 million people within India experienced water stress. Water resupply trains wound through the countryside, delivering bottles of potable liquid to residents who’d lost access. A return of India’s monsoon provided some relief, but drought in India and Tibet’s highlands remains in place as glaciers shrink in the warming air.
Shifting north into Europe, we also find widespread and expanding drought conditions. Thissituation is not unexpected for Southern Europe, where global climate models show incursions of desert climates from across the Mediterranean. But as with northern Russia and North America, Northern Europe is also experiencing drought. These droughts across Europe helped to spark severe wildfires in Portugal and Spain in the summer, as corn yields for the region are predicted to fall.
(During November, drought spurred wildfires that erupted along the Amazon Rainforest’s boundary zone in Peru. Image source: LANCE MODIS.)
Ongoing drought and extreme weather have created local impacts to food supplies in various regions. However, these impacts have not yet seriously affected global food markets. Drought in Brazil and India, for example, has significantly impacted sugar production, which in turn is pushing global food prices higher. Cereal production is a bit off which is also resulting in higher prices, though not the big jumps we see in sugar. But a Food and Agricultural Organization (FAO) Index for October of 2016 (173 approx) at 9 percent higher than last year’s measure for this time of year is still quite a ways off the 229 peak value during 2011 that helped to set off so much unrest around the globe.
(Rising food prices during 2016 in the face of relatively low energy prices and significant climate-related challenges to farmers is some cause for concern. Image source: FAO.)
That said, with energy prices falling into comparatively low ranges, relatively high (and rising) food prices are some cause for concern. Traditionally, falling energy prices also push food prices lower as production costs drop, but it appears that these gains by farmers are being offset by various environmental and climate impacts. Furthermore, though very widespread, drought appears to have thus far avoided large grain-producing regions like the central U.S., and central and east Asia. So the global food picture, if not entirely rosy, isn’t as bad as it could be.
Conditions in Context — Increasing Evaporation, Melting Glaciers, Less Snow Cover, Shifting Climate Zones
With the world now likely to hit 1.5 C above pre-industrial temperatures over the next 15 to 20 years, overall drought conditions will likely worsen. Higher rates of evaporation are a primary feature of warming, meaning more rain must fall just to keep pace. In addition, loss of glacial ice in various mountain ranges and loss of snow cover in drier Arctic and near-Arctic environments will further reduce river levels and soil moisture. Increasing prevalence of extreme rainfall events versus steady rainfall events will further stress the vegetation that aids in soil moisture capture. Finally, changes to atmospheric circulation due to polar amplification will combine with a poleward movement of climate zones to generally confuse traditional growing seasons. As a result, everything that relies on steady water supplies and predictable weather patterns will face challenges as the world shifts into a state of more obvious climate change.
Around the world, global warming is starting to have a serious impact on rainfall in the subtropics and middle latitudes. The tropical atmospheric circulation known as the Hadley Cell is expanding toward the poles. This expansion is causing clouds and storms to move further north. And as a result, regions in the middle latitudes are starting to dry out.
A changing climate means less rain and lower water supplies in regions where many people live and much of the planet’s food is produced: the mid-latitudes of the Northern and Southern hemispheres, including the U.S. Southwest, southern Europe and parts of the Middle East, southern Africa, Australia and Chile.
Such a fundamental shift in global weather patterns due to human-caused climate change is expected to reduce the food and water security of numerous nations. The World Resources Institute recently warned that food and water crises were imminent as a result. And, apparently, these kinds of changes to the world’s weather are already generating profound shocks in parts of the U.S.
Colorado River and California Droughts Expected to Persist
For the Colorado River, this combined warming and movement of clouds northward has produced a 16-year-long drought. Hotter average seasons result in greater rates of evaporation. So even if rainfall averages remain, grounds, lands and rivers are drier. But the Hadley Cell’s expansion has also moved rain bearing weather systems north.
It’s a compounding drying influence that has pushed Lake Mead, the nation’s largest reservoir, to record low levels. And states dependent on the great river’s water supply for farming and industry are now involved in negotiations to avert a water crisis in 2018. Forecasts predict a 50 percent possibility that Lake Mead’s water levels will fall below its mandatory rationing line. Such an event would result in water cut-offs for Arizona and Nevada.
(Over recent years, the U.S. has experienced numerous severe and long-running droughts. These worsening drought conditions have impacted everything from Colorado River levels to wildfires, to the health of forests, to commerce on the Mississippi River, to the productivity of state agriculture. As human fossil fuel burning continues, atmospheric changes will force rainfall toward the poles which will tend to further worsen drought conditions in middle-latitude regions like the lower 48 states of the U.S. Image source: Drought Monitor.)
In an attempt to prevent crisis in the coming months, California and other Colorado River states are attempting to cut water consumption now. Such a planned regional belt-tightening would help to avert conflict over the Colorado River’s dwindling stores and smooth out any losses over time. But, sadly, climate conditions are only likely to continue to worsen — increasing the risk of mandatory rationing for 2019, 2020 and beyond.
In California, a five-year-long drought that is the worst in state history now threatens to enter its 6th year. Rains during 2016 did help to reduce the severity of drought conditions for some parts of the state. And during recent days, a series of Pacific storms has helped to deliver moisture to some northern and central regions. However, with record warmth settling in over the Arctic and with a La Nina developing in the Pacific, long range forecasts indicate a high risk that California will experience a warm, dry winter. Such predicted conditions would result in a persistence of the present drought with continued impacts to the state’s forests and agriculture.
Southeastern Drought Expected to Expand
(Drought conditions are expected to worsen across the US Southeast this fall and winter. Drought in the Colorado River region is expected to persist or worsen. Drought in California and in parts of the US Northeast is expected to persist. Image Source: Climate Prediction Center.)
Further east, a flash drought that has settled into the US south is expected to worsen over the coming months. Abnormal warmth in the range of 5-15 degrees (F) above average for the region during the past month has combined with dry weather to spur severe to extreme drought conditions over a six state area. Now, parts of Tennessee, North Carolina, South Carolina, Georgia, Alabama and Mississippi are under the gun — with drought zones expected to persist or expand through at least early February.
US Drought Conditions to Worsen as the Globe Warms
In total, more than 120 million people in the lower 48 states are experiencing drought. And the systemic impacts of multi-year, persistent droughts are widespread and growing. This drying is consistent with the impacts associated with a warming climate. And, unfortunately, such worsening of droughts is likely to continue until atmospheric warming is halted and/or reversed.
During 2013 to 2015 a similar warm-up over this same region of water occurred. Such extreme heat at the ocean surface generated mass loss of sea life. Numerous species from plankton to krill to copepods to starfish and many more on up the food chain were impacted. This great ocean warming also sparked losses of ocean oxygen off Oregon and Washington, pushing waters there into low-oxygen and anoxic states. These states, though they do not support advanced ocean life, tend to support anaerobic microbes that produce various toxins (including hydrogen sulfide gas). At the same time, atmospheric circulation was also impacted, resulting in unprecedented drought conditions for California as a ridiculously resilient ridge of high pressure settled in.
(Region of the northeastern Pacific about the size of the state of Washington shows ridiculously hot sea-surface temperatures in the range of 4 C above average. Such once-in-a-thousand-years ocean-surface heat has now occurred for three out of the past five years. As end 2016 nears, this unprecedented blob of hot ocean-surface waters appears to be returning. Image source: NOAA ESRL.)
Such a terrible blow to ocean health combined with ever-more-extreme atmospheric conditions are the very hallmarks of a heating climate. As a result, the events associated with the 2013-2015 hot blob will likely, in future years, be seen as one of the warning shots across North America’s bow — an indication that climate change-related impacts were about to seriously worsen.
Hot Blob Re-Forms as La Nina Splutters
Now, after a one-year hiatus, the hot blob is back and northeastern Pacific sea-surface temperatures are again on the rise. A previously-predicted La Nina is abruptly spluttering out, apparently crushed by a periodic warming of the northeastern Pacific called the Pacific Decadal Oscillation (PDO). This natural variability-related feature is combining with climate change-induced ocean warming to again push ocean surface temperatures into unprecedented ranges.
(The northeastern Pacific hot blob is a climate change-related feature that contributes to record heat, drought and wildfire risk for California. Over the coming week, the re-formed hot blob appears ready to plunge the state into 90 to 1oo degree (F) conditions — which will intensify wildfire risk for the state. Image source: Pivotal Weather.)
With the PDO again firing up, the hot blob re-forming, and La Nina starting to splutter, we can expect global temperatures to remain closer to the record-hot levels achieved during 2015 and 2016. This is bad news in that 2017 through 2022 might see another record-hot year coordinate with El Nino, which would push even closer to 1.5 C and 2 C climate thresholds — a clear sign that the age of fossil fuel exploration and burning needs to end as swiftly as possible if livable climate conditions are to be maintained.
Nearer-term, if this heat in the northeastern Pacific remains in place, we can expect worsening hot and dry conditions for the U.S. west coast even as sea life in the affected region again falls under threat. With global temperatures now hitting a range of 1.2 C or more above 1880s averages, there is risk that this event could match or even exceed the related harmful impacts seen during the 2013 to 2015 timeframe.
(Unusual high-amplitude Jet Stream ridging over the U.S. west coast like that predicted for Sunday in the GFS model run is associated with both extreme sea-surface temperatures in the northeastern Pacific [the hot blob] and sea-ice loss in the Arctic, both caused by global warming due to fossil-fuel burning. Note the numerous additional powerful ridge and trough formations running downstream of this unusual Jet Stream feature. Image source: Earth Nullschool.)
Climate Change Links Again Non-reported by Media
Despite an obvious relationship between global warming and extreme regional heating events like the hot blob, some prominent media sources continue to link the formation of the hot blob to natural variability without mention of climate change. To do so fails to tell the whole story. Without that 1.2 C warming of the Earth since the 1880s due to our rampant burning of fossil fuels, we would not be seeing so much heat piling up in the northeastern Pacific. As such, the PDO has been put into a kind of climate change hyperdrive. And that’s what’s creating conditions under which these big, dangerous ocean hot blobs continue to grow.
Rising temperatures. Deepening drought. Worsening wildfires. Such are the new climate realities for the State of California in a record-hot world.
*****
Yesterday, amid 100-degree heat and blustery winds, and on the back of a devastating drought nearing the close of its fifth year, a dangerous wildfire sparked in the Cajon Pass in San Bernardino County. Originating near Interstate 15 at 10:30 AM Tuesday, the blaze fed on the heat, strong winds, and bone-dry brush. In just two hours, the fire had exploded to 1,500 acres in size. Fanning out, it began to threaten homes and buildings within this well-known section of southern California.
(Tuesday feed tracking the early hours of the Blue Cut Fire provided by CBS News on Youtube.)
By early afternoon, emergency officials were scrambling to get ahead of the fire. More than 750 firefighters were mobilized as neighborhood after neighborhood emptied before the gigantic walls of smoke and flame. Sheriffs hurried from door to door, urging people to leave or notify next of kin. Residents spilled onto roadways shrouded by darkness as towering pillars of black burst into the skies above them. Joining together in long trains of cars, they formed a press of 82,000 fleeing the fire. By evening, homes along Highway 138 were engulfed, a local McDonald’s burned, and the famous Summit Inn on historic Route 66 was consumed to its foundations.
As of late Tuesday, the fire had swelled to 15,000 acres; Governor Jerry Brown declared a state of emergency. Numerous structures including multiple ranches and communities had been surrounded or invaded by fire. Tracey Martinez, Public Information Officer for the San Bernardino County Fire Department, made this announcement:
“We know that we’ve lost structures, it’s unknown how many at this time. This fire is still raging out of control.”
(Train passes in front of a section of the Blue Cut Fire in San Bernardino County, California on Tuesday. Image source: CALFIRE.)
Throughout the night, the fire continued to engorge even as more emergency personnel rushed to the scene. Burning embers, lofted on the updraft created by the fire, rained down upon the region. Spot fires ignited as the main body of the blaze expanded. As of early morning on Wednesday the fire had spread to 30,000 acres. At least 1,300 firefighters, 152 engines, 18 fire crews and ten air tankers were involved in fighting the blaze by that time. Despite this enormous effort on the part of emergency personnel, the fire was still zero percent contained.
(Predicted west coast temperatures for Friday afternoon show readings in the upper 90s and 100s stretching into northern California, Oregon, and Washington. It’s exactly the kind of heat and dryness that can increase fire danger. Image source: Earth Nullschool.)
Now, with global temperatures hitting near 1.2 degrees Celsius above 1880s averages, the pattern of persistent and worsening drought over the U.S. west has become clear. The Blue Cut Fire emerged in this context. And though this region of San Bernardino County has long faced fire risks, the danger, along with the heat, is on the rise.
A potential record southwestern heatwave is building — predicted to hit peak intensity by the middle of next week. But, already, higher than normal temperatures and strong southerly winds are lighting off severe wildfires throughout the drought-stricken US West.
Fires Prompt Evacuations, Declarations of Emergency Across US Southwest
(A crown fire southeast of Albuquerque forces the residents of 50 homes to flee as the governor of New Mexico declared a state of emergency Wednesday. Satellite image source: LANCE MODIS.)
Homes in Utah were also blanketed by smoke and haze as fires threatened. In Iron county, 40 mile per hour winds stoked yet another explosive blaze, cutting off Bumblebee Road and forcing 20 residences to be evacuated. As of last report, the fire was 400 acres in size, but this is likely to be a low estimate as 80 firefighters are now attempting to contain the blaze.
Southwest Drought Fuels Wildfire Near Santa Barbara Oil Refinery
It’s a rash of wildfires fueled by above normal temperatures and an endemic and steadily worsening drying of the region. Ongoing conditions related to human-caused climate change. And California has seen the worst of it. There, extreme drought has now lasted for three years. And in all of the past nine years, California has only seen two non-drought years.
(Dry US West. Dry conditions expanded to cover much of the US West this week ahead of a powerful and potentially record heatwave. Coincident with human-forced warming, an expansion of drought is expected in the US West. A condition that has born out in the form of worsening drying conditions for this region of the US over the past 2-3 decades. Image source: US Drought Monitor.)
In the south, near Santa Barbara, rainfall totals again fell short of average this Winter. Another dry season in a very dry decade that has provided ample bone-dry vegetation as fuel for wildfires.
Hundreds of campers were evacuated from the burning ridge as firefighters rushed in. The oil facility has now been emptied of non-essential personnel and more than 500 firefighters are attempting to erect a defensive line in order to contain the blaze. Currently, there appears to be no severe threat the fire will ignite fuels within the Exxon facility. But 40 mile per hour winds are predicted for later today and the nearby fire could be poised for more explosive growth.
(Fire rages near Exxon Mobile oil processing facility in Santa Barbara, California on Wednesday. Firefighters had a brief respite as winds died down Thursday morning. However, fire conditions are expected to rapidly worsen by Thursday afternoon with the return of strong sundowner winds. Image source: Pete Demetriou.)
Dangerous Infrastructure — Oil Facilities Vulnerable to the Fires of Climate Change
This is the second time that a large oil facility has been threatened this year by a wildfire. In Canada, the Fort McMurray Fire forced the evacuation and shut down of large tar sands production facilities as barracks for oil workers succumbed to that massive blaze.
Human caused climate change is increasing instances of wildfires around the world through the combined forces of increased drought, rising temperatures, and more intense rates of evaporation. And in what could well be called an ironic twist of fate, the very fossil fuel infrastructure that is causing the warming is also quite vulnerable to the fires it has helped to light off.
If we were to use a metaphor, we could compare it to playing with fireworks on a 100+ degree (F) Fourth of July day in a big puddle of gasoline. In other words, this is the very definition of irresponsible. And the potential for tragedy here is enormous. Fossil fuel facilities contain massive amounts of volatile explosive compounds. Explosions at refineries due to accidents are among the most powerful manmade (if unintended) violent outbursts on Earth. And the very use and production of that fuel makes it more and more likely that a wildfire will set off a very real manmade firestorm at one of these many massive facilities.
(US fire danger map shows high to extreme potentials for wildfires across large sections of the country. Fire risk is likely to intensify over the coming week as a record heatwave is predicted to build across the country. Today’s outbreak, therefore, may just be the start. Image source: US Fire Service.)
It’s just one more example of how dangerous and irresponsible the global fossil fuel industry has become. And in this instance they are increasing risks to life and property not just to those who live anywhere near an oil or gas facility — but for anyone living pretty much anywhere at all. In other words, the fires are getting worse because we are burning fossil fuels. And the very fossil fuel facilities that are causing this problem are threatened.
An understanding of basic reality. Accepting that reality as true. And responding to that reality in a mature, adult manner. One would think that these qualities would serve as the given assumed prerequisites necessary for someone to serve as President of the United States. But in these most basic of qualifications for sanity, honesty and much less for serving as any kind of leader of worth and effectiveness, Donald Trump has demonstrated that he is both sorely and entirely lacking.
(According to the US Drought Monitor, 86 percent of California is now suffering under drought conditions. Conditions that have dominated the state since 2013 and that during 2015 inflicted the most intensely dry conditions California has ever experienced. Image source: US Drought Monitor.)
Though strong El Ninos typically bring increased levels of rainfall to California, this year’s powerful event failed to provide even normal rainfall over more than half of the state. This failure of rains during a year when above average precipitation would be expected is but one more blow in a long, long series. But worse is likely still to come as a La Nina — a condition traditionally associated with dry weather in California — is on the way. And further on down the pipe, more warming due to the human burning of fossil fuels that Trump supports means that drought conditions will only continue to intensify unless a miraculous effort is somehow undertaken. Under these stark conditions, many observers are now wondering if the California drought will ever come to an end.
Lake Mead Hits New Record Low
Upstream along the Colorado River, there’s still more to be concerned about. For a waterway that 25 million people depend upon is now entering its 16th year of drought. The river feeds one of the US’s largest reservoirs — Lake Mead. But the giant, man-made lake keeps hitting record low levels year after year. A great white ring shows the previous high water mark from decades past over the now greatly shrunken reserve. Water officials are today relegated to making increasingly dubious assurances that the reservoir will be able to meet needs next year (2017) or maybe the following. But the future on into the early 2020s is ever less certain.
(NASA Earth Observatory shows the extraordinary shrinkage of Lake Mead from 2000 through 2015. Also note the very rapid growth of water-hungry Las Vegas directly to the west of the imperiled reservoir. Image source: Earth Observatory.)
As of last week, Lake Mead’s water levels had fallen below 1074 feet above sea level. This represents just 37 percent of the reservoir’s capacity. If levels remain below 1075 feet through to January 1, a number of required water restrictions will ripple through the Colorado River system forcing states like Arizona, Nevada and California to endure cutbacks. It’s a situation that may not happen this year, but one that grows more and more likely each following year as the Colorado River continues to dry out.
In total, more than 25 million people depend upon Lake Mead’s water. And the drought along the Colorado River that is shrinking the lake combines with endemic drying in California to create a context of ongoing and worsening water resource stress over the US Southwest. A drying driven on by the human-forced warming of our world and by the very fossil fuel burning that Trump is preparing to double down on should he be elected President.
It’s a worsening reality that will call for hard choices and bold efforts if the communities of this threatened US region are to survive and prosper. A set of choices requiring a firm grasp of the tough new realities now settling in and a willingness to chose renewable energy systems that will not worsen water stress and that will not continue to enflame an already tough climate situation.
But the presumptive leader of the republican party brazenly spouts ignorance of even a simpleton’s understanding of the powerful and dangerous climate forces now at work. A bald lack of basic knowledge that would put tens of millions throughout the US Southwest at risk due to what is sure to be a devastating resource mismanagement, an ill-timed return to dangerous fuels, and an utter lack of climate disaster preparedness should Trump be elected. A serious deficiency in the kinds of urgently needed national leadership skills in the current day coupled with a denial of simple realities that should cause pretty much everyone to question whether the man possesses even the most rudimentary qualifications for serving as President of the United States.
Writing about human-forced climate change isn’t easy. And, lately, year after year, I’ve grown to dread these three words more and more — Summer is Coming.
This year, it’s worse. The gateway of Equatorial-to-Polar heat transfer was thrown wide open as one of the strongest El Ninos on record blazed through the Pacific. As a result, Winter temperatures in the Arctic hit levels that were likely never seen by any human that has ever lived in a settlement resembling a town or a city. And one of the paths over which this heat ran was Western North America. A region that is now experiencing a number of early warning signs that trouble is on the way.
*****
What was perhaps the strongest El Nino on record is now fading in the Equatorial Pacific. It was an event that many hoped would provide significant relief to a drought-stricken California. An event that many hoped would crush a hot zone of Northeastern Pacific waters dubbed ‘The Blob’ — providing a new skein of cooler and far more familiar ocean surfaces. An event that many hoped would return at least some sense of normalcy to the US West Coast by restoring snow packs, reservoirs and flattening the Jet Stream while re-establishing a typical west-to-east storm progression.
(Ridiculously warm sea surfaces remain in place off the US West Coast. There, sea surface temperatures are in the range of 1-4 degrees Celsius above typical 1961 to 1990 readings. Such warm seas will tend to aid in ridge formation through Alaska and Western North America as Spring progresses into Summer. During recent years, a synergy has tended to develop between these abnormally warm waters, the warming and melting Beaufort Sea to the North, and the development of brutish, hot high pressure systems over the region. Image source: NOAA/NCEP.)
Unfortunately, many of these hopes have failed. The California drought remains firmly entrenched. Sea surface temperatures off the US and Canadian West Coasts remain abnormally high. And record-shattering heat and extreme weather is again settling in over Western North America during Spring. Though heavy rains and snows across Washington and Oregon during Winter have replenished higher elevation snowpacks there, an overall tendency for much warmer than normal conditions remains. And far to the north, the early break-up of Beaufort Sea Ice hints that any hopes for a return to flattened Jet Stream patterns may well be in vain.
This isn’t to say that the Summer of 2016 will be an exact mirror to that of 2015. More that newly established and climate change related trends promoting extreme warmth, southwest drought, Arctic wildfires, abnormal ocean heat and thunderstorms in the far north remain in place and are likely to have a continued and often disturbing impact this year. Perhaps even more-so after a recent Winter of record Arctic heat and a long period of abnormal warmth that has prepped a wide zone for potentially very severe warming-related weather in the months to come.
And already, it seems that weird Spring and Summer weather associated with a human forced warming is starting to settle in.
It was an abnormal display that left many onlookers, including to city mayor stunned. “Um, there’s lightning. In Yellowknife. In April.” A flabbergasted Mark Heyck tweeted yesterday evening.
April thunderstorms are a more typical feature of the Great Plains of the US during this time of year. And it wasn’t until recently that human-forced global warming began to make these powerful storms a more frequent possibility for this near-Arctic region even during Summer. How unusual thunderstorms used to be for this region is driven home by the fact that tribes indigenous to the area didn’t even have a word in their language to describe them. For the early to middle spring period, it’s a 1 in 30 year event to see a thunderstorm over Yellowknife even when taking into context a very warm 20th Century. So back then it was basically a once or twice in a lifetime happening. But that was before a record global heating driven by fossil fuel burning settled into its warmest levels since the peak of the Eemian more than 115,000 years ago. Now, it’s pretty certain that such events will continue to become more common.
Yesterday’s Seattle high temperature reading was an amazing 31 degrees (F) above average for this time of year and a full 4 degrees (F) above the previous all-time record for the month of 85 degrees set on April 30th in 1976 — or nearly two weeks later in the season. Monday was also the second day in a row of above 80 degree temperatures. If today’s readings rise to their predicted values of 84 (F) then it will be the first time ever in April that there were three unbroken days of 80 degree or above in that Pacific Northwest City.
(Extraordinary spate of above 90 degree temperatures breaks out in Northwestern Washington yesterday. These are never-before seen readings for a region that typically experiences much cooler weather in the upper 50s (F) during this time of year. It’s unprecedented for April. Something that is an upshot of a severe and outlandish human forced warming that is resulting in more and more freak weather events cropping up around the globe. Image source: The National Weather Service and The Capital Weather Gang.)
The weird Seattle heat was accompanied by extraordinarily high temperatures running into the 90s throughout Puget Sound and over much of Northwestern Washington. Bellingham and Olympia experienced warmest ever April temperatures as well with thermometers hitting 83 and 88 (F) respectively. And in some locales, the proverbial mercury climbed to as high as 96 degrees (F) or about 39 degrees above typical April temperatures for the region.
To say such hottest-ever temperatures are disturbing would be an understatement. Though the region received strong rains and snows throughout Winter, record heat in this range will tend to push replenished mountain snows to rapidly melt and nearby forests to flash-dry. An area celebrating this year’s influx of moisture could thus soon find itself facing fire hazard and drought as Spring progresses into Summer.
Even a Strong El Nino Can’t Shake California from the Grips of Extreme Drought
Still further to the south, persisting and possibly worsening drought for the Spring and Summer of 2016 appears to be the likely conclusion. El Nino rains primarily funneled north into Oregon and Washington this year as very warm near coastal waters conspired with record low sea ice levels in the Arctic to pull the Jet Stream and related storm track northward. And though Northern California did receive some of El Nino’s snow pack and reservoir replenishing rains and snows, Central and Southern California have been left mostly bereft. And as a result, most of the state remains in the grips of extreme or exceptional drought — the worst levels we have a measure for.
(Conditions of extreme or exceptional drought still cover most of California. With ground water greatly depleted, snow packs below average, and reservoirs below average, a likely hotter than normal Summer followed by a predicted La Nina will tend to worsen drought conditions for the State and possibly for Arizona and New Mexico as well. A Strong El Nino was the best chance for California to receive drought-alleviating moisture. And it appears that opportunity has now passed. Image source: Climate Prediction Center.)
Taking these measures into account, it appears that California received overall below average moisture amounts during the El Nino Winter of 2016 with normal levels of moisture falling on the northern 2/3 of the state and with the southern 1/3 receiving far less than normal precipitation over the past 90 days. As strong El Ninos typically bring above average amounts of precipitation to California, 2016 levels falling below even an average marker should be serious cause for concern. Closer to average, but still below average rains and snows, are nowhere near enough to bust what has been the worst drought in state history. More to the point, it appears that the current drought has settled in to a semi-permanent state with no end in sight entering its fourth year.
(The continuation of the California drought and the failure of a strong El Nino to deliver even normal levels of Winter moisture to the state are a part of an ongoing, climate change induced trend of western drying that has been growing in intensity since the 1980s. NCAR earlier this year found that California was losing, on average, about 6.5 percent of its pre-1980 average precipitation per decade. Image source: NCAR and Climate Progress.)
National Weather Forecasters at NOAA now predict an increasing likelihood of La Nina coming later this year. A moderately strong cool Kelvin Wave now rippling beneath the Pacific is beginning to surface in the Equatorial waters just to the west of Central and South America. If these cooler surface waters fan out along the path of the trade winds as predicted, it will likely be yet one more bit of bad news for California. La Nina, which may be in full swing by this Fall, tends to bring drier conditions to California. With the State’s groundwater still greatly depleted, with snowpacks still well below average, with reservoirs below average and with the State likely to face a warmer than typical Summer, this should be viewed by West Coast policy makers and residents alike as ominous news.
Conditions in Context — Severe Events Related to Human-Forced Warming Abound, Much Hotter Than Normal Summer Likely on the Way
Based on observations of overall trends, it appears that this Summer has been prepped for some obnoxiously extreme conditions. Never-before-seen Arctic Winter temperatures, record low sea ice, persistent pooling of hot water at the surface in the Northeastern Pacific, persistent development of strong ridges and record early season heatwaves over Western North America, the blocking of El Nino moisture from California by a northward shift of the storm track, the appearance of odd convective weather patterns like thunderstorms in the far north during April, and due to the fact that 2016 is shaping up to be the hottest year on record by a long shot globally all contribute to an overall pattern setting Western North America up for another weird Summer of freakish weather.
(We have never seen Winter heat like this before over Western North America. This set-up creates a dangerous preparation that results in a heightened risk of seriously severe Summer extreme weather events like heatwaves, droughts, wildfires and thunderstorms ranging well into the far north. Note a similar preparation for Western Russia and North-Central Siberia. Image source: NASA GISS.)
Much higher than normal temperatures predicted over the US West, Northwest, Central, Northern and Western Canada, and Alaska are likely to result in increased risk of wildfires, heatwaves, drought, and related severities. Thunderstorms ranging far into the north where the permafrost thaw zones are now expanding bring together an unprecedented combination of new fuels for fires and more intense ignition sources in the form of Arctic thunderstorms. Possible early melt and low albedo related accumulation of abnormal warmth in the Arctic could exaggerate these extremes even outside of the high ranges which NOAA models are now predicting. And the pole-ward progression of El Nino related heat in the shift toward La Nina should propagate strongly along the now well-established pathway of the Northeastern Pacific and the North American West.
Such new weather and climate tendencies will almost certainly continue to result in weather events that residents will find odd and freakish. To this point, if you observe an extreme heatwave, instance of wildfire, or other instance of extreme weather in your area over the West this Summer it has almost certainly been given a serious amount of added oomph by the expanding number of climate change related conditions affecting your region.
Today the globe is feeling quite a bit of backlash from a human-warmed sea surface and atmosphere. As it ends up, Dr. Kevin Trenberth was right. Deep ocean warming set off by heat-trapping fossil fuel emissions and building up through the first two decades of the 21st Century did re-surge from the depths to haunt us in 2014, 2015 and 2016. In that wrenching global climate system shift to the hot side of natural variability, a titanic El Nino emerged. It was one of the top three strongest such events in the modern record. One that by NOAA’s measure appears to have tied the extreme event of 1998 at its peak intensity.
(Sea surface temperature departure from average in the benchmark Nino 3.4 zone shows surface ocean heat anomalies for the 2015-2016 El Nino equaled peak 1997-1998 values. Image source: NOAA/CPC.)
Expected Heat, Drought, and Storms Together With a Few Ominous Surprises
The predicted patterns and potential worse-case events (such as heatwave mass casualties, coral bleaching, and sea ice loss) were also contrasted by a number of surprises. The first and perhaps most ominous was the failure of El Nino to bust the California drought. Though the West Coast of the US did experience a number of storms, the pattern was more typical of normal Winter moisture for the Northwestern US even as drought continued throughout the Southwest. Moisture instead tended to split fire-hose fashion — with storms either cycling northward into Alaska, the Aleutians, or the Bering Sea, or south over Southern Mexico or Central America, up across the Gulf and on out into a particularly severe storm zone forming in the North Atlantic.
(Over the last 30 days the southwest drought re-emerged as a blocking pattern again began to take hold over Western North America and the Eastern Pacific. Image source: NOAA/CPC.)
This continued loss of moisture for the US Southwest despite a record El Nino is particularly apparent in the Climate Prediction Center’s most recent precipitation anomaly measure for the last 30 days. Here we find that large parts of Central and Southern California have received just 10 to 50 percent of typical rainfall for this period. Coupled with 1-3 C above average temperatures for the month, this loss of rainfall during what would typically be California’s wettest period has come as a disappointment to many who were hoping a strong El Nino would help break the state out of a crippling drought. Now, the window for late Winter and early Spring rains is starting to close even as the blocking pattern appears to be strongly re-established in both the present weather pattern and in the forecast model runs.
But perhaps the biggest surprise coming from this El Nino year was a set of weather events in the North Atlantic that were likely more related to climate change. There, severe storms hammered a flood-beleaguered UK as a greatly distorted Jet Stream heaved Equatorial heat and moisture northward — rushing it up over a ridiculously warm and apparently backed-up Gulf Stream before slamming it on into a likely Greenland ice melt-outflow related cool pool. There the heat and moisture collided with cold to produce the epic storms that then vented their fury upon the UK.
(December 29th saw temperatures rise above freezing at the North Pole — the first time temperatures have warmed so much for this high Arctic region so late in the year. Image source: Earth Nullschool.)
As El Nino Fades, Equatorial Heat Tends to Move Pole-ward
Though we may see these two events — the failure of El Nino to provide heavy rains to the US West Coast, and the massive northward pulses of storms, heat and moisture hitting the North Atlantic — as unrelated, the twain patterns appear to be linked to an ongoing polar amplification. Overall, heat within the Arctic has tended to weaken the Northern Hemisphere Jet Stream over these two zones. And even during El Nino, when the Jet would have typically strengthened, we have continued to see high amplitude wave patterns forming over these regions.
But as El Nino weakens and the Equator cools, the Jet Stream would tend to slow even more. Such an atmospheric state would tend to further exaggerate already significant Jet Stream wave patterns — transferring still more low-Latitude heat poleward. In addition, the ocean gyres tend to speed up as El Nino fades or transitions to La Nina. The result is an amplified pulse of warmer waters emerging from southern Latitudes and entering the Arctic.
It’s for these combined reasons — tendency to amplify south to north atmospheric heat transfer into the Arctic post El Nino and tendency to flush warmer waters toward Arctic Ocean zones during the same period that it appears we are entering a high risk time for potential new sea ice melts and possible related Greenland land ice melts during 2016 and 2017.
(Northeastern Pacific Hot Blob remains at high intensity even as its size is predicted to expand through July. Meanwhile, very warm sea surface temperatures are predicted to remain in place off the Eastern Seaboard. The net effect of these two hot blobs may be to shove the Jet Stream far northward over North America during the summer of 2016 — potentially increasing the risk of widespread and potentially record heat and drought. Predicted very warm sea surfaces in the region of the Barents and Greenland seas — in excess of 3 C above average for a large region — is also cause for concern. This is not only due to risk for sea ice loss through this zone, but also due to its potential to set off blocking pattern and heat dome formation over Eastern Europe and Western Russia. Image source: NOAA/CFS.)
El Nino to Weaken and Then Return; or is a Shift to La Nina Now Under Way?
Related to a polar and ocean warming-enhanced tendency to generate high amplitude Jet Stream waves — as well as associated persistent heatwaves, droughts, and floods — is the heat balance of the Equatorial Pacific. Strong El Ninos, or even a tendency to remain in or near an El Nino state, has historically aided in the breaking of new record global high temperatures when linking up to the greenhouse gas warming trend. Meanwhile, the shift toward La Nina has tended to enhance a range of global heating related issues including record rainfall events and large injections of heat toward the poles in the drop off from El Nino to La Nina.
The cause for increased risk of major precipitation events is due to the fact that El Nino is providing a massive moisture bleed into the atmosphere at times of peak intensity. With the current El Nino topping out near record levels and with global temperatures at above 1 C higher than 1880s averages, global atmospheric moisture levels are hitting new record highs at this time. If global temperatures subsequently drop by around 0.1 to 0.2 C during a transition into La Nina (into a range about 0.9 to 0.8 C hotter than 1880s values) then the atmosphere will be unable to keep a larger portion of that extra moisture in suspension and it will fall out as precipitation — primarily wringing out where the major trough zones tend to set up. We should be very clear here in saying that the drought risk related to a global warming intensification of ridge and heat dome formation is not reduced during such instances — just that the risk of extreme precipitation events is enhanced.
(During 2011, as the 2010 El Nino faded into La Nina conditions, a high amplitude wave in the Jet Stream set off record heat, drought and wildfires over Russia even as Pakistan was hit by a month-long deluge that was the worst rainfall event for the region in the last 1,000 years. La Nina’s tendency to wring excess water out of the atmosphere can enhance the risk for such events to occur in a warming climate state. Image source: NASA.)
As for risks to sea ice, we’ve provided some of the explanation above. However, it’s also worth noting that the mobility of heat poleward tends to be enhanced during the periods when El Nino drops off toward La Nina. During these times, Equatorial heat tends to propagate in wave fashion toward the Poles — especially toward the Northern Hemisphere Pole which has already lost its strong Jet Stream protection warding away warm air invasions.
These two factors are major issues when considering whether La Nina or an ENSO Nuetral state will appear post El Nino during 2016. But there is a third — rate of global temperature rise. Though the primary driver of global warming is a massive human fossil fuel emission, the response of the world ocean system can significantly wag the rate of atmospheric temperature increases on a decadal time scale. If the ocean tendency is for La Nina, this would tend to somewhat suppress the overall decadal rate of temperature increase — and we saw this during the 2000s. But if the ocean tendency is to produce El Ninos (in a switch to a positive Pacific Decadal Oscillation, as appears to be happening now), then the overall pace of global atmospheric temperature increase would tend to be enhanced.
( IRI/CPC consensus model runs show a drop off to a weak La Nina by late in the year. However, CFS model runs [image below] have shown a tendency to predict a resurgence of El Nino conditions by Fall. Image source: NOAA/CPC.)
To this point we find that the official model forecast consensus published by NOAA (IRI/CPC figure above) shows a transition to ENSO neutral states by May, June, and July which then proceeds on to a very weak La Nina by Fall. In such a drop off, we would likely still see record global high temperatures during the period of 2016 (in the range of 1.03 to 1.15 C above 1880s values).
However, the late 2016 and 2017 tendency for temperatures to recede from new record highs would be somewhat enhanced (likely dropping below the 1 C above 1880s mark in 2017 or 2018 before again making a challenge to the 2015-2016 record with the potential formation of a new El Nino in the 3-5 year time-frame of 2019 through 2021). It’s worth noting that this scenario shows an increased risk of a stronger warm air pulse heading toward the Northern Polar zone together with added fuel for extreme precipitation events as global temperatures would tend to drop off more swiftly from late 2015 and early 2016 peaks.
(CFSv2 model run — shows El Nino continuing on through the end of 2016. Over recent months, the CFSv2 series has shown a high accuracy. However, NOAA’s current forecast preference is for the IRI model set predictions [previous image above]. Image source: NOAA/CPC.)
In contrast, the CFSv2 model forecast from NOAA (above image) shows El Nino only weakening through to July and then re-strengthening in the October-November time-frame. This CFS model scenario would result in higher atmospheric temperatures in 2016 — practically guaranteeing a lock on an unprecedented three back-to-back-to-back record warm years for 2014, 2015, and 2016. But such a scenario — implying that the Pacific Ocean had entered a new period of El Nino tendency — would also tend to keep atmospheric temperatures nearer to the newly established record highs.
Under the CFSv2 scenario, we may expect annual average global temperatures to rise as high as 1.08 to 1.2 C above 1880s values during 2016 (a very extreme departure and one uncomfortably close to the 1.5 C warming mark). These extreme values would, perhaps, recede to around between 0.9 and 1.1 C during 2017 so long as the second El Nino pulse did not remain in place for too long. However, if the bounce back toward El Nino conditions was strong enough in late 2016, there would be an outside chance that the globe may experience not 3, but an absolutely obnoxious 4 back-to-back record warm years.
(During 2015 global annual temperature rocketed to above 1 C hotter than 1880s values. There’s at least an even chance that 2016 will be hotter still. Considering the considerable heating tendency imposed by a fossil fuel-forced warming of the world, how much worse can it get during the 21st Century’s second decade? Image source: NASA GISS.)
Meanwhile, the warm air pulse heading toward the poles may be somewhat muted under this scenario. A statement that should be qualified by the fact that we’ve already seen a substantial amount of El Nino heat heading poleward during the present event. In addition, potentially heavy rainfall events may not receive the added oomph of a decent global temperature drop to wring out more moisture. A statement that requires the further qualification that overall atmospheric moisture loading is enhanced by rising global temperatures — so comparatively less heavy rainfall is a relative term here.
“A transition to ENSO-neutral is likely during late Northern Hemisphere spring or early summer 2016, with a possible transition to La Nina conditions by fall.”
However, it’s worth re-iterating that the CFSv2 model forecasts have been quite accurate in predicting the path of the current record El Nino to date.
For those who follow weather, it’s a rather strange and disturbing story.
A powerful Pacific Ocean storm forms about 500 miles south of the Aleutian Islands. Heavily laden with rains, strong winds, and trailing a long squall line, the system takes aim at the US West Coast. It’s a burly beast of a thing. Pumped up by an enormous bleed of moisture rising off of one of the mightiest El Ninos ever seen. An instance of extreme Equatorial heat that’s been firing off since October.
(Another Pacific Storm is deflected northward by increasingly persistent high pressure systems as the US Southwest swelters under unseasonable warmth. GFS climate reanalysis by Climate Reanalyzer shows this disturbing weather pattern again and again in the February forecast. In short, it doesn’t look like the California Drought is going to end anytime soon. Image source: Climate Reanalyzer.)
The towering El Nino-fed storm clouds chug east, steaming along toward what appears to be an inexorable collision with California, Oregon, and Washington. But, at the last moment, the storm slams into a heavy pile of atmospheric heat. Warm air building over the US Southwest and nearby ocean zones has shoved the upper air steering current called the Jet Stream pole-ward. The great storm is sucked up into this atmospheric train, delivering its rains along an arc from Washington State on northward.
And so the seemingly impossible has happened. A powerful El Nino’s rains and snows — usually bound directly for California, Oregon and Washington — have been diverted by a new kind of atmospheric pattern associated with climate change.
El Nino’s Rains Gone or Just Taking a Break?
Ever since late January, strong ridges have tended to develop over Western North America. By February 4th, the National Weather Service (NWS) had begun to report on the pattern — describing it as El Nino taking a 5-10 day break. But the ‘break’ had already begun to show up on January 26th — about ten days prior to the February 4 NWS announcement. And now, on February 10, we’ve seen two full weeks of warm, dry weather settling in over California and the US Southwest. Meanwhile, long range model forecasts indicate that the ‘break’ from El Nino conditions will continue through at least February 16th.
(Temperatures in the upper 60s to upper 80s is predicted for a large sections of California and Arizona on Tuesday, February 16th. It’s the kind of hot, dry air that brings back memories of recent years when formations of strong, ridiculously resilient ridges pushed California into one of its worst drought episodes on record. Image source: Climate Reanalyzer.)
It’s all just terrible timing. First, California snow packs during December and January began to recover due to strong, El Nino associated, storm systems barreling in. However, now during what should be the peak of the Southwestern rainy season, we have what could be a month long pause in storms hitting the region. It’s as if the rainy season is being hollowed out. And not just any rainy season — a strong El Nino rainy season which should have been far, far rainier than most.
Last week, Climate Central and Peter Gleick — a climate expert at Pacific Institue — made the following warning:
…seven days of sustained warmth could melt as much as 30 percent of California’s snowpack. The hot, dry weather is exactly what baked in exceptional drought in California over the past four years. Some signs indicate the heat is driven in large part by climate change, but the role of the ridiculously resilient ridge is still an area of active investigation.
Well, by tomorrow seven days will have come and gone. But the end to the anomalous warm, dry spell is still nowhere in sight.
California Drought Really Hasn’t Budged
Meanwhile, a four-year-long California drought appears to be making a strong run at year five. In fact, if you look at the US Drought Monitor, you’ll find that a large swath of the West is currently suffering under moderate to exceptional drought conditions.
(Severe Drought remains in place over the US West. El Nino appears to have lost at least some of its ability to deliver heavy rains as an intensifying regime of human-forced warming pushes typical weather patterns further and further off-kilter. All bad news for an area that has been suffering from one severe drought after another since the early 2000s. Image source: Drought Monitor.)
Quite frankly, it’s insane that we’re still seeing these conditions during a monster El Nino. These droughts should be rolling back as the storm track intensifies and hurls severe weather at the US West Coast. But that’s not what’s happening. At least not consistently. Instead, we keep getting these extreme ridge patterns in the Jet Stream over western North America. We keep getting these very warm, very dry spells of weather during the wet season. And now, we have California Snowpack melting away in February of all times.
A Ridge-Trough Pattern That’s All-Too Likely Related To A Human-Forced Warming of the Arctic
The fact that these weather patterns emerged after the warmest January and lowest sea ice extents on record for the Arctic is a point that should not be missed by weather and climate analysts. It appears that what we are seeing is yet more evidence that polar amplification is driving a consistent high amplitude bulge in the Jet Stream over Western North America together with severe periods of warmth, dryness and snowpack melt during Winter. The hot side of a dipole pattern that is also setting up more extreme storm potentials as cold air is driven out of the Arctic along a deep trough over the Eastern US, slams into a record hot Gulf Stream, and then sets off a series of atmospheric bombs along a storm track running all the way across the North Atlantic and into Western Europe. Yet more evidence that what happens in the Arctic doesn’t stay in the Arctic.
It’s an El Nino year. One of the top three strongest El Ninos on record. The strongest by some NOAA measures. And we are certainly feeling its effects all over the world. From severe droughts in Southeast Asia, Africa, and South America, to Flooding in the Central and Eastern US, Southern Brazil, and India, these impacts, this year and last, have been extreme and wide-ranging. During recent days, Peru and Chile saw enormous ocean waves and high tides swamping coastlines. Record flooding and wave height events for some regions. All impacts related to both this powerful El Nino and the overall influence of human-forced warming by more than 1 C above 1880s temperatures on the whole of the hydrological cycle.
Amped up by a global warming related 7 percent increase in atmospheric water vapor (and a related increase in evaporation and precipitation over the Earth’s surface), many of these El Nino related impacts have followed a roughly expected pattern (you can learn more about typical El Nino patterns and links to climate change related forcings in this excellent video by Dr Kevin Trenberth here). However, so far, some of the predicted kinds of events you’d typically see during a strong El Nino have not yet emerged. A circumstance that may also be related to the ongoing human-forced warming of the globe.
Storm Track Not Making it Far Enough South
Particularly, there has been an absence of powerful storms running in over Southern California then surging on into Arizona, New Mexico and West Texas. During strong El Nino events, heat and moisture bleeding off the super-warmed Equator have typically fed powerful storms racing across the Pacific. These storms have tended to engulf the entire US Pacific Coast from San Diego through to Seattle. However, much of the storm energy is often directed further south toward Central and Southern California.
(A massive Pacific storm being warded off by high pressure systems over the US West Coast on Tuesday, January 26th. Image source: Earth Nullschool.)
These storms tend to run over regions that are typically much drier. So strong El Ninos of the past have often generated abnormal and memorable storms and rains. But this year there has been, mostly, an abscense of such events. Storms have slammed into Northern California, Oregon, been deflected back into the coasts of Canada and Alaska, or even been bottled up near the Aleutian Island Chain.
But today, a high pressure cell dominates the western US, warding off a powerful storm system. The storm, howling just south of Alaska and pushing out average 60 foot wave heights and hurricane force winds across the Pacific, is predicted to rebound toward Alaska where it will become bottled up in the Bering sea and push above freezing temperatures into the Arctic Beaufort Sea during Winter. The storms and rains will steer far away from Southern California and even much of California altogether.
Rainfall Patterns Have Tended Toward the North, Contrary to NOAA’s Seasonal Predictions
(NOAA precipitation quantities prediction for the coming week is indicative a continued northward shift of the Pacific Storm track. Image source: NOAA.)
It’s a pattern more reminiscent of some strange ridiculously resilient ridge (RRR) than that of a strong El Nino. And though storms later this week are again predicted to slam into the Northwest and weekly rainfall totals are expected to rise to near 1 inch for parts of Southern California, the path of these storms and related moisture flows are quite a bit further north than one would expect for a year in which strong El Nino was the dominant feature.
The moisture flow, instead, so far has tended northward across the upper and central tiers of the US even as the El Nino related moisture bleed toward the Gulf and East Coasts has remained quite intense. Such observed weather is both contrary to what we’ve tended to know about Strong El Nino and to NOAA’s seasonal forecasts which had predicted much more rain for the southwest than what we’ve seen so far.
(NOAA three month outlook is more in line with traditional strong El Nino forecasts bringing strong storms in through the southwestern US. We currently do not see a prevalence of that particular pattern. Image source: NOAA’s Climate Prediction Center.)
Polar Warming + Hot Blob Tugging the Storm Track Northward?
Since weather patterns related to El Nino are an aspect of global atmospheric dynamics — teleconnections between the influence of an excess of hot air and heavy rainfall at the Equator and of large scale atmospheric wave patterns downstream, you have to wonder if there isn’t some kind of influence competing with El Nino on a global scale. One with enough oomph to nudge the Pacific Storm Track northward.
(The Hot Blob is still a dominant feature of ocean waters in the Pacific Northwest. Is its influence helping to pull the Pacific Storm Track northward during a strong El Nino year? Image source: Earth Nullschool.)
The first likely suspect is the pool of still much warmer than normal sea surface temperatures lurking off the US West Coast. Though somewhat diminished from their peak during 2014 and 2015, the waters in the hot blob off California, Oregon, Washington, Canada and Alaska are still in the range of 1 to 3 C above average. A very large region of significantly warmer than normal ocean surfaces that wasn’t present during the 1982-83 and 1997-1998 super El Ninos. And much of the warmest anomalies are now centered much further to the north along the coast of Alaska.
But the second potential player is likely even more significant. And that would be an ongoing and extreme warming of the northern polar region. Heating at the Pole generates less thermal gradient between the higher Latitudes and the Equator. And such a lessened gradient would tend to impact the strength of the circumpolar winds that drive weather systems and storm tracks. In particular, the overall warming of the globe would tend to pull these storm tracks northward even as the loss of thermal gradient would tend to enhance wave patterns in the Jet Stream.
(Polar Amplification shown as very intense in the January 26 Climate Reanalyzer graphic. Is Polar Amplification helping to shove the Pacific Storm Track northward even during a record strong El Nino year? If so, it’s bad news for long term moisture levels in the US Southwest. Image source: Climate Reanalyzer.)
Perhaps also specifically related to this ongoing polar amplification, we find that two warm slots — one over the Barents and far North Atlantic east of Greenland and another over the Bering — have tended to develop during recent Winter years. These slots have often served as staging areas for warm air invasions of the Arctic. But what they also represent are regions of water that have been freshly liberated from their sea ice coverings. As such, these vast regions of water serve as heat transport and ventilation zones. And all this extra heat energy may be sucking the related North Atlantic and North Pacific Storm tracks into what may well be described as an oceanic and atmospheric trap.
If such a situation where the case, we’d tend to see a dipole of warm east, cold west in the storm trap regions. And that’s exactly what we’ve seen more and more of with Greenland and Siberia serving as the backdrops to reinforce this tendency. Thus setting up the stage for cold air slots cutting through Northeast Siberia and Northeast Canada and warm, wet air slots over Alaska and the UK.
The question to be asked is, then, are these new influences related to human-forced warming also now doing battle with El Nino for control over the Pacific Storm Track? And has that influence increased enough to dramatically nudge that track northward? We may find the answer to that question in what happens to the direction of powerful Pacific Storms over the next few months. But early indications seem to be that polar warming and the related hot blob may have thrown a wrench in the kinds of El Nino storms that we’ve been used to.
What does a Monster El Nino look like? In two words — climate change. And by the end of August climate change’s Monster El Nino may have spawned two strong tropical cyclones and hurled their powerful remnant systems into the Arctic.
The 2015 Monster
The Equatorial Pacific is cracking wide open. Heat, at near new records for August, is oozing out. In the Nino 3.4 zone last week, the heat bleed hit a new intensity of + 2 degrees Celsius above average. That puts our current El Nino easily in the running for one of the top three strongest. And the warming there is expected to continue through at least October — possibly setting up conditions in which the 2014-2016 El Nino is the most intense and perhaps longest-running such event ever seen.
(Our Monster El Nino and three hot blobs — one off California, one off the Pacific Northwest, and one in the Bering and Chukchi — just keep getting hotter and hotter. The extremity of heat covering this section of the Pacific Ocean is simply extraordinary. And the fact that it keeps building may have some serious impacts on Pacific, Arctic, and North American weather patterns. Image source: Earth Nullschool.)
Unlike typical El Ninos, the high heat anomalies are not isolated to a band along the Equator. They extend upward across a vast pool that encompasses practically all of the Northeastern and North-Central Pacific. All of the Bering Sea and a chunk of the Arctic Ocean as well. It’s as if the typical El Nino heat has developed a great chimney that runs over thousands of miles from Equator to Arctic. One that encompasses millions of square miles of much warmer than normal ocean surface. An entire zone that, for the ocean, is a blistering 1-5 degrees Celsius hotter than ‘normal.’
The Warming World’s Intense El Ninos’ Dance With Polar Amplification
Scientists have long warned us about this. Warned us that increasing global temperatures through ongoing fossil fuel burning could greatly amplify the intensity and the frequency of strong El Nino events. A recent paper published in Nature has continued this line of research finding that, under human-forced global warming, the frequency of strong El Ninos is doubled. And, right on queue, the 2014-2016 El Nino is shaping up to be one of the nastiest, if not the nastiest such event we’ve yet experienced.
But it’s not just a question of the intensity of heat boiling out of the Equatorial Pacific. It’s also a question of how a strong El Nino behaves in a world that has been forced to warm by 1 degree Celsius. According to Dr. Jennifer Francis, a significant portion of that extra heat has tended to focus in the Arctic. And this extra Arctic heat has, among other things, gone to work weakening the Jet Stream. In some regions, as we see today over the entire Northeastern Pacific, the tendency has been for powerful high amplitude ridges to form. The ridges often extend all the way into the Arctic — developing pathways for yet more heat to hit the high polar zones.
Like El Nino, the ridge over the Northeastern Pacific is involved in an ocean-atmosphere dance. It’s a dance that includes widespread and abnormally warm water (see hot blob strengthens). And it’s a dance that includes the powerful impact of a Monster El Nino stalking the equatorial zones.
El Nino Hurls Twin Typhoons at the Arctic
Last week, this atmospheric dance included the formation of two tropical cyclones. Feeding off the powerful convection rising up over the Equatorial Pacific, these massive cyclones gathered intensity from the easterlies rushing in to feed the El Nino. They steamed north and westward. By today, Typhoon Goni was threatening the Philippines and Taiwan with 125 mph sustained winds. Meanwhile, Super Typhoon Atsani’s 150 mph sustained winds were tearing through Pacific Ocean waters east of Guam.
(GFS model forecast graphically displayed by Earth Nullschool finds typhoons Goni and Atsani running into wall of the Ridiculously Resilient Ridge by Tuesday. It’s an atmospheric heat bleed from El Nino to Arctic that, according to long range forecasts, has a risk of carrying these strong storms with it. Image source: Earth Nullschool.)
Over the next few days, the typhoons are expected to turn north and eastward. Goni is predicted to skirt the Philippines, Taiwan and Japan. Atsani is expected to remain over open waters to the east of Japan. Both are heading toward the hot, northward moving airs on the backside of the Ridiculously Resilient Ridge.
Currently, the Ridge is positioned over the Northeastern Pacific Ocean hot pool just south and east of the Aleutians. It’s a strong and very deep high pressure system that’s expected to maintain in the range of 1035 to 1040 mb over the coming days. It’s dredging up the hot El Nino airs of the Equatorial Pacific and flinging them all the way to the Arctic Ocean.
Atsani is expected to plow into the back of this atmospheric wall of hot airs and to then follow the warm flow northward — approaching the Bering Sea edge by next Thursday as a powerful 960 to 970 mb extra-tropical low with Goni’s remnants following in its wake.
(Forecast sea level pressure map for Thursday, August 27th show Atsani’s powerful remnants on a track for the Bering Sea and Alaska or the Arctic Ocean. Image source: Climate Reanalyzer.)
If Atsani’s remnants enter the Bering as predicted, it will then either track through Alaska or enter the southern Chukchi and Beaufort Seas. At that point, the strength and disposition of the Arctic high will determine its final path. If the high recedes closer to Greenland and the Canadian Archipelago, Atsani’s extratropical system could be projected into the Arctic Ocean proper as a late season cyclone threatening the sea ice. If the Arctic high is more centrally located, Atsani’s remnants would plow down into the facing trough over Western and Central Canada — bringing with it some very stormy weather.
A Very Odd Storm Track
As with last week, we continue to see this odd tendency for a storm track to develop from the Western Pacific through to the Bering Sea, Alaska, and the Arctic itself. It’s a teleconnection-driven atmospheric dance between a powerful summer El Nino, the hot blob of water over the Northeastern Pacific, and the Ridiculously Resilient Ridge riding over top. With such a pattern so firmly entrenched, there’s a risk that this storm track will maintain well into Fall and, perhaps, persist into Winter with Alaska as the destination for Pacific storms. Under such a pattern there is little hope for drought-busting weather to reach California. Which would mean a continuation of terribly dry conditions there unless our Monster El Nino can somehow squash the extraordinarily dogged RRR.
Meanwhile, for the Arctic, the risk of powerful storms plowing through weak, late season ice is looking a little bit less like an outlier event and more and more like a possibility for end August. So we’ll have to keep a close watch on Atsani, Goni, the RRR and the Arctic High.
(Atmospheric El Nino Index by WSI shows a very strong atmospheric response is unfolding. But long range weather maps, long range NOAA forecast shows an atypical pattern for El Nino. Image source: WSI.)
They say that a picture can paint a thousand words. How about a graph that exceeds 100 El Ninos? It may not jump out at you at first, but that’s what we’re looking at above.
This graph, provided by Weather Channel Affiliate WSI (and based on atmospheric data collected by NOAA) represents intensity of atmospheric response patterns to El Nino. Typically, this means cloudiness at the Central Pacific Equator, the propagation of near equatorial westerlies, atmospheric wave propagation in the Jet Stream, and storm track amplification. In other words, teleconnections.
On the left side of the above graph, we see positive and negative numbers indicating standard deviation correlation to an ENSO neutral state. Push into 2 standard deviation range either high or low and you’re getting about a typical El Nino or La Nina response from the atmosphere. And ever since June we’ve been in the 3 standard deviation or about top 10 percent of El Nino response range.
That’s a pretty strong ocean to atmosphere signal. But it pales in comparison to what’s being predicted. Looking ahead, the Euro weather model then pushes us all the way up to a 4 standard deviation event (or top 1 percent of atmospheric response rates) by early-to-middle August. This is an extreme response to El Nino. One that could have some amazing impacts come Fall, or possibly sooner (see North Atlantic storm discussion below), especially when we take into account some of the added impacts of human caused climate change. Should such a response emerge, both the US Southeast and Gulf Coast could be in for some extremely severe storms.
(A rather deep trough for Summer-time swings down through the Eastern US. Image source: Climate Reanalyzer.)
For the US, such a strong atmospheric response to El Nino forcings would tend to indicate a powerful trough digging in through the Eastern half of the country, even during summertime. And while we do see a rather strong trough for this time of year setting up over and extending down from the Hudson Bay region of Canada, we do not see an overall suppression of summer-time heat and potential for greatly increased precipitation that would typically occur under such a pattern, as yet.
Instead and somewhat oddly, the pattern has kicked energy out over the ocean — fueling the North Atlantic storm track and powerful oceanic cold core cyclones at a time when such events should be rare. Yesterday, a gale hammered Scotland and Ireland, kicking up seas west of England into a frenzy of 30 foot swells. To say this event is odd for summertime is a bit of an understatement. Sans tropical storms swinging north, the higher Latitude regions of the Atlantic are typically calm this time of year.
Winter-Type North Atlantic Gales During Summer
But living in typical times we are not. Greenland melt is ramping up. And so we see the start of a Heinrich Event-like cool pool in the North Atlantic. Call it a baby Heinrich or a precursor or whatever you like. But it’s there. And it’s anomalously cool. And it’s going to influence the weather regardless of whether we like it or not. It’s an event related to both fresh water flow into the North Atlantic and an associated decline in the strength of the Gulf Stream. This odd summer North Atlantic storm generation is then, perhaps, due to a teleconnection between the strong atmospheric signal of El Nino and the underlying signal of human-forced climate change. Such a teleconnection would tend to shift the El Nino related trough a bit eastward and result in an amplified North Atlantic storm track. Which is exactly what we are seeing.
(It looked like a North Atlantic winter storm. But this screen capture of 30 foot swells due to a powerful gale off England was taken late last night [August 3rd]. For those familiar with typical summer patterns for the North Atlantic this should be a moment that inspires head-scratching. One with an uncanny similarity to patterns predicted in a recent paper by Dr. James Hansen. Image source: Earth Nullschool.)
NOAA long range forecasts are also picking up the signal of powerful storm track intensification over the Gulf Coast and the Southeastern US. Such a prediction hints at a strong storm track running diagonally across the Atlantic from Florida to England and aligned with a trough edge running through that broader region. It’s a pattern that could put England in the firing line for severe winter storms yet again. For the US, the upshot is powerful storms slamming a region from Texas through the Carolinas from September through February. Florida, Coastal Georgia and the U.S. Gulf Coast are particularly hard-hit in the forecast. But we also shouldn’t rule out some strong bombs impacting the Mid-Atlantic region before they tear off across the ocean.
No Significant Drought Relief for California?
Sadly, the atmospheric response to El Nino is not pushing forecasts for a wet winter for the US West Coast. Monsoonal moisture hits the US Southwest during September and October, but barely touches California in the forecast. The moisture pattern then retreats eastward. Heat and dryness are particularly focused in the region of Washington, Oregon, Idaho and Montana. Abnormal warmth is also predicted to remain in place over Alaska.
(NOAA long range forecast finds little drought relief for the US West Coast this winter even under the influence of a predicted powerful El Nino. Image source: NOAA CPC.)
This pattern appears to indicate that the NOAA models are calling for the Ridiculously Resilient Ridge and the hot Blob of water off the US West Coast to mostly remain in place. An overall very bad forecast considering El Nino’s predicted intensity and the currently indicated strength of atmospheric response. It may be that cooling in the North Atlantic associated with Greenland melt and Gulf Stream weakening is having such a powerful impact on the Jet Stream that El Nino cannot over-ride — instead solidifying the Pacific Ridge to Atlantic Trough fixed atmospheric wave and dumping its teleconnection influence into the firing range that the North Atlantic is steadily morphing into.
To this point, it’s worth noting that long range model forecasts of this kind can carry with them a rather high error bar. The ocean-atmosphere forcing of the predicted super El Nino will likely result in some rather dramatic wrenchings of the climate system. And for such an El Nino to fail to over-ride the West Coast block would have some very serious added impacts on down the line.
(Please support publicly funded, non-special-interest based science, like the fantastic work provided by NOAA and NASA, without which this report and the reports provided by Climate Reanalyzer, Earth Nullschool, and WSI would not be possible.)
(MODIS satellite shot of wildfires erupting over a sweltering Southwestern Alaska on Sunday, June 21. Wildfires in permafrost regions of the Arctic like Alaska are particularly concerning as they are one mechanism that returns ancient sequestered carbon to the Earth atmosphere. A sign of a feedback set off by human warming that will worsen with continued fossil fuel emissions. Image source: LANCE-MODIS.)
Deadhorse, at the center of North Slope oil fields above the Arctic Circle set an all time record high of 82 degrees Fahrenheit (28 Celsius) on Sunday. That’s 3 degrees hotter than the previous all time record high of 79 degrees (26 C) set on August 16, 2004. The hottest reading for June at that location was a 68 degree (20 C) measure set in 2007. So, basically, Deadhorse just shattered the all-time record for June by 14 degrees (F) and the globally record hot summer of 2015 has only now gotten started.
Other locations experiencing new records for just Sunday included Kotzebue, which set a new all time record highest low temperature of 62 degrees (17 C). This reading broke the previous all time high minimum mark of 56 degrees (14 C), set in 1987. Bethel and Yakutat both tied their daily high minimum temperature records at 54 and 52 degrees (12 and 11 C), respectively.
And yesterday was just one day in long period of record heat for the State. Last month’s NOAA analysis showed temperatures fully 7 degrees Fahrenheit (4 C) above average. It’s a record heating that is now setting off severe wildfires all over Alaska. According to the state’s Wildland Fire Information Center, the relentless heat and dryness has turned spruce, hardwoods, brush, and tundra into dry fuels vulnerable to any ignition source. Over the past week, ignition has come in the form of lightning — with most of Alaska’s 2015 wildfires set off by nature’s spark.
As a result we are seeing nearly double the number of fires during June compared to a typical year. Fires that have already destroyed 30 structures, forced evacuations, and tapped Alaska’s firefighting resources to its limits.
Wildfires Burning in the Rainforests of Washington as Major Heatwave Approaches
Record hot temperatures and wildfires, unfortunately, are not just an issue for Alaska. They’re a prevalent concern all up and down Western North America. A zone that has seen several years of record hot temperatures and dryness. Extreme weather events fueled by such global warming-linked phenomena as a Ridiculously Resilient high pressure Ridge over the Northeast Pacific that has kept heatwave and drought conditions firmly entrenched throughout much of the region for months and years. An atmospheric condition that is also linked to a hot ocean surface water ‘Blob’ in the Northeast Pacific (which is itself implicated in a growing number of marine species deaths).
(Paradise Fire burning near a drought-shrunken creek in the rainforests of Olympia National Park, Washington. Image source: NPS and Wildfire Today.)
This week, the added heat also generated wildfires in unusual areas like the rainforests of Washington State’s Olympic Peninsula. Driest conditions since 1951 have resulted in a great deal of fire resiliency loss for forests in the region (1951 was the year of the historic Five Forks Fire, one of the worst ever to impact Washington State). Already, a rare early summer wildfire (called the Paradise Fire) has burned through 417 acres of forest.
Firefighters are doing their best to contain the blaze. But the record heat and dryness are multiplying fuel sources. Fires are enabled by dried lichens growing high up in the trees. When flames touch the lichens they rapidly ignite sending sparks to other lichen-covered tree tops. In this way, flames can leap rapidly from tree to tree under current conditions.
It’s very unusual to see fires in this rainforest zone. And when ignitions have occurred in those very rare cases, they have typically flared during late Summer and early Fall. So this June burning has fire officials very concerned — especially given the nearly unprecedented fire hazard conditions throughout the State. Conditions that are predicted to rapidly worsen as an extreme heatwave is expected to build through the coming weekend.
(A major heatwave is predicted to invade the US West and Northwest States this weekend. Washington and Oregon are predicted to experience temperatures more typical of desert sections of California and Arizona. Image source: Climate Reanalyzer.)
Temperatures over large stretches of Washington and Oregon are expected to climb into the 90s and 100s, possibly reaching the 110s (Fahrenheit — Celsius range from 33 to 45) by Sunday. For these typically cool, wet States, this brutal heat blow, should it emerge as predicted, will set off a spate of all time record high temperature readings, deepen drought conditions extending northward from California, and heighten fire conditions that are already in the range of worst ever experienced for sections of these States.
California Experiencing “Worst Fire Conditions On Record”
Moving further south along the U.S. West Coast we come at last to the drought hot zone that is California. A State that is now enduring its fourth year of drought. A drought that tree ring studies show is likely the worst such event in 1,000 years.
We measure the fuel moisture content of all of the vegetation -the brush and the trees and we track that over the course of time and compare it month to month each year. And we put it through formulas and determine how much energy and how much heat it will put out when it’s burning. And we have seen -we saw it last year and we will see it again this year- we’ll be reaching records for potential heat output for times of the year that would normally not be burning in those conditions.
(Large wildfire burns in forests along the slopes of Sierra Nevada Mountains whose peaks are now entirely devoid of snow cover. Note that remaining glaciers are shown turning a dull brown in the June 21 MODIS satellite shot.)
So far this year over 1,100 wildfires have already ignited throughout the State. That’s nearly twice the typical number of 650 blazes popping up by this time of year. Exacerbating this stark context is a state water resource crisis compounded by non-existent Sierra Nevada snowpacks and dead trees that now number in the millions.
This is not Normal, Nor Should We View Widespread, Related Events in Isolation
Record and unusual Alaska, Washington, and California wildfires this season are, thus, not occurring in isolation, but as an inseparable feature of ongoing climate trends related to human-caused global warming. In this case, heatwaves are related to visible and extreme record ocean and atmospheric temperatures that have been ramping both globally and in the regions affected over past years and decades. And the fact that 2015 is continuing as the hottest year on record globally should also not be viewed as separate from the events witnessed all up and down the North American West Coast. Events that were largely predicted in many global climate models assessing the impacts of human based greenhouse gas warming on this vital national and global region.
We’ll end here by considering this thought — it’s only June, yet up and down the North American West Coast we are experiencing some of the worst heat, drought, and fire conditions ever recorded. It’s only June…
* * * *
UPDATE NOON EST, JUNE 23, 2015: Satellite Imagery confirms that, over the past 24-48 hours, the wildfire situation in Alaska has continued to worsen. Widespread and large fires running throughout southwestern, central, northeastern and eastern Alaska today expanded and multiplied:
(Fires flared to dangerous size across Alaska on June 22nd and 23nd. Image source: LANCE-MODIS)
These rapidly proliferating fires cover a diagonal swath stretching about 800 miles from southwest to northeast across the state. The fires are burning through Alaska’s permafrost zone and current intensity in the satellite image is similar to some of the worst Arctic fires we’ve seen during recent years. A substantial number of these fires feature smoke footprints indicating 5-10 mile active burn fronts. Smoke plume size is now large enough to become caught up in the Jet Stream and impact visual features of skies across the Northern Hemisphere.
Based on these satellite shots, it appears that Alaska is experiencing a heightening and very severe fire emergency — one that shows little sign of abatement over the next few days.
According to the California Government, State snowpack levels are now at 1 percent of average. That’s not just the lowest ever recorded. That’s about as close to zero as one can get without actually hitting zero.
“I don’t think the American public has gripped in its gut what could happen. We’re looking at a scenario where there’s no more agriculture in California.” — Stephen Chu in a public press release six years ago.
Warming seeped into the region, driving snow packs higher, or off the mountains entirely. Critical stores through dry summer months, these zones of mountain snow and ice serve as aquifers for human beings, shrubs and trees, and local animals alike. Their dwindling alone left the region more vulnerable to drought conditions.
But further-reaching changes — warming in the nearby ocean, and a recession of sea ice in the Arctic — also tilted the odds toward drought. Heating in the near shore waters of the Northeastern Pacific served as a kind of barrier to storm systems running across the wide ocean. Loss of sea ice in the Bering, Chukchi and Beaufort Seas provided a heat stress to that Arctic region. The net result was conditions that preferentially enabled the development of dry high pressure systems along the North American West Coast. A condition many have come to call — the Ridiculously Resilient Ridge.
As the climate continues to warm, these conditions — local, regional, and global — enforce a kind of tilting toward drier and drier conditions. Conditions that models show may result in worse droughts than even the one we are seeing now. Droughts that last, not for four years, but for ten years, twenty years, thirty years or more. It’s a problem we’re just starting to deal with now. But if you think this is bad, warm the world by another 0.5 C, or 1 C, or 2 C and you probably really don’t want to see what’s in store.
The chances of a 35-year or longer “megadrought” striking the Southwest and central Great Plains by 2100 are above 80 percent if the world stays on its current trajectory of greenhouse gas emissions.
California Hitting Water Limits
But the current drought, though not yet a ‘megadrought,’ is more than bad enough. Aptly called epic, the powerful and ongoing lock on California moisture has wrung out aquifers, pushed snowpacks to below 1 percent of usual levels for springtime, greatly depleted ground water supplies, and forced an additional 25 percent water rationing across the state.
Stresses to water supplies — not only for California, but for many other states as well — are mounting. Key Aquifers, like Lake Mead in Northern Arizona, are hitting levels where downstream rationing may be required. A shock that would send impacts rippling on through the entire US Southwestern water supply.
(Nearly 50 percent of California is now under the most severe drought conditions we have a measure for. A total of more than 37 million people in California alone are impacted by drought at this time. Image source: US Drought Monitor.)
Expert climate spotter Andy in San Diego has been providing situation discussion in this forum on the drought there for weeks. Of particular concern are water levels at Lake Mead — which are fast approaching the line where water rationing to various locations across the Southwest goes into effect as a requirement by law.
Lake Mead is at 1078.79. [Approximately] 4 ft from the start of cutoffs. It appears Arizona gets [rationed] first at 1075 in some documentation, Nevada in others. Outflows from Mead were … shut off Saturday & Sunday. Starting Saturday, outflows from Lake Powell were cranked up by about 1000 [cubic feet per second]. … At this point, inflows to Powell are being sent downstream to Mead immediately. I see a bit of gambling here hoping for decent inflows to Powell in Late May through early July. Unfortunately, snow pack above Powell is pretty much non existent. Powell is at ~44% full pool. Mead is at ~38%. This will be an interesting summer, it appears that all of the Hail Mary’s have been used for 2015 already. (some edits for clarity)
Since Andy’s update yesterday, Lake Mead levels had fallen further to 1078.55 feet — just 3.5 feet above levels where rationing requirements begin.
12.5 Million Dead Trees Could Fuel Epic Fire Season
As key US aquifers hover over mandatory rationing levels, impacts to wildlife across California are growing more and more extreme. Anyone having watched Neil DeGrasse Tyson’s amazing Cosmos series may have noted dessicated, browned grasses and fields in the background of some shots. The reason for this is that many of Tyson’s narrations were filmed on location in California. And, at the time — in 2014 — California’s epic drought was really starting to bite deep.
How deep had not yet become apparent. But new reports out yesterday began to shed light on what is an amazingly stark situation.
According features in the Washington Post and elsewhere, more than 12.5 million trees perished in California alone last year due to extreme drought conditions. Encompassing more than 1 million acres, it’s a swath of forest the size of Rhode Island — now filled with withered trees. Key plants necessary for a variety of life and land supports including moistening the air, anchoring the soil, and providing homes for communities of creatures.
(USDA photo shows swaths of dead trees in California pine forest. Image source USDA via CBS Local.)
Research indicated that not only did the heat and drought stress the trees. But the warm conditions favored the invasion of tree-devouring beetles. Wood-devouring insects that thrive in the hot, dry conditions put in place by the ongoing drought.
The dead trees are bad enough. But put them smack dab in the worst drought on record for California and they are an extreme fire hazard.
Since late 2013, fire season has never really ended for California. It’s flared and dwindled, but wildfire burning has continued regardless of season due to both extreme heat and drying. Summer months are the worst times, though, and this year’s very extreme conditions has California fire planners very worried.
At issue are all the millions and millions of dead trees. Sitting in the sun, dried and wrung of all moisture, they’re essentially large stacks of kindling. Fuels that could rapidly ignite given even the smallest spark.
Cambria, Calif. is under an emergency fire declaration. There’s no actual fire, no smoke, but here’s the situation broken down by Cambria Fire Chief Mark Miller. If a fire started today under the circumstances that exist……In the first 20 minutes, it would be six acres, and there would be two houses involved.
US Agriculture Under Threat
But not only is California now a fire-vulnerable land of browned, snowless mountains, rapidly dwindling water supplies, and dessicated, dying, beetle devoured plant life. It is a place that hosts the heart of US produce production. A vital source of food for the US and for the world that is now under threat.
Central Valley California, according to a new report in Think Progress, is the production hub for more than 90 percent of the United States’ fresh fruits and vegetables. It’s a condition that arose from a combination of slick marketing, a host of unique micro-climates suited to practically every form of vegetable, and a domination of (mostly corn and soy) mono-cropping throughout the productive regions of the Central US. Essentially, mono-cropping in the plains drove the majority of produce farmers to the West Coast.
And, as result, most of the fresh vegetables Americans enjoy are all grown from one basket. A basket that is now baking under a merciless California sun. Everything from lettuce to avocados to tomatoes to almonds to oranges, and so many more, are now at risk.
(The majority of California agriculture is irrigation-based — supplied by aqueducts like the one shown above. Aqueducts like this one also add flood risk due to enhanced potential of extreme rainfall events due atmospheric heating combined with land subsidence due to ground water depletion. Image source: Public Herald.)
Fully 80 percent of California’s water supply goes to food growers. It’s a stream of vital water that proceeds from California aquifers to farmers and then directly to your dinner table. A stream that Governor Jerry Brown has refused to cut at any cost. But despite increasingly draconian water rationing to other sectors, farms are still feeling a hit. In 2014, nearly 500,000 acres of cropland lay fallow. A number that could more than double by the end of this year. With so much of California’s water evaporating, with so many wells running dry, even water protected for farm use takes a hit.
But the fact that we may need such a reorganization, together with the fact that the current California drought is an early, easier outlier of what is to come, highlights our vulnerability. Warming of the Earth System is already shocking the US and global food system to such a degree that it is calling into question the future of US produce production.
Strong El Nino is No Cure
Among many, hopes are that a strong El Nino may deliver a drought-breaking flood of moisture by the end of this year. And while there is growing indication that a monster El Nino may be developing in the Pacific, such an event would be no cure for poor climate-changed California. In fact, such an event could produce floods that further impact agriculture — stripping denuded landscapes and flushing vital soil nutrients down streams and into a eutrophying ocean.
The ground there is baked, subsided. The pores in the earth closed up, creating a tablet effect for water ponding. The fires have stripped trees and brush from hillsides, resulting in landslide hazard.
And the kind of rainfall a 2.5 to 3 C anomaly event (that some models are indicating) could generate would be extraordinary (especially when we add in the extra atmospheric moisture loading from overall human heating of 0.9 to 1 C above 1880).
For California, it looks like the option for ending epic drought is epic flood. And, with human caused warming, more drought will almost certainly follow any flood.
As of October 4, the State of California had entered its 4th year of a raging drought that shows no sign of abating. A drought that a growing number of studies are linking to human-caused climate change. A drought that appears to be readying to level a terrible blow at residents, communities and farmers living in the increasingly dessicated Central Valley region.
It is a massive loss of water with far-reaching impacts including greatly reducing the flows of the San Joaquin and Sacramento Rivers.
The loss of ground water is primarily due to increasing rates at which both communities and farmers are tapping well water supplies to make up for the massive deficits of the ongoing drought. Overall, more than 600,000 wells feed individual homes, small communities and farms throughout the Central Valley. As wells dried up, residents and growers in the region turned to deeper and deeper drilling — tapping water further and further underground.
The result is a very rapid depletion of the aquifer water store. A depletion starkly visible to NASA satellite sensors. A race for the last remaining drops of an ever-shrinking pool of water.
(Lake Oroville at full in 2011 [top frame] and nearing bone dry during August of 2014 [bottom frame]. Image source: Paul Hames, California Department of Water Resources and Justin Sullican, Getty Images.)
More ominously, however, is the fact that many Central Valley residents are already at the point where wells won’t produce at all. By mid-September, towns like Porterville and Seville saw hundreds of residents without running water. In hardest hit Tulare County, 1,000 of the region’s 7,300 residents had lost access to running water due to well failure. In this most extreme of cases, victims of water shortage were forced to haul bottled water to homes from local stores or relief centers set up by firefighters and state emergency personnel.
Tulware may well be California’s canary in the drought coal mine as recent reports find that as many as 100,000 wells — about 1/6th of all the wells in the Central Valley — could go dry by mid October without a bout of well-replenishing rains. And with heatwaves rising under a powerful blocking high pressure system that has dominated the California climate for nearly two years now, the likelihood of such rains appears to be starkly low.
(Blocking high keeping California dry is plainly visible in the October 12 European Model weather forecast. Image source: ECMWF.)
Weather forecasts continue to show the emergence of ridiculously resilient high pressure systems over California and the near shore Pacific. Rain-bearing low pressure systems continue to be deflected northward into Alaska and British Columbia. Such forecasts indicate that October may well be a very difficult month for the water-strapped State. And with ridging continuing to be the dominant influence, it appears California may be facing another water-poor late fall and early winter going forward.
This is an event that is more extreme than any in the observed record, and our research suggests that global warming is playing a role right now. — Stanford Scientist Noah Diffenbaugh
****
Last week, a strong storm over-rode a powerful high pressure ridge that has been deflecting moisture-loaded weather systems northward and away from the US West Coast for the better part of two years. Though some precipitation did grace the northern and mountain stretches of the drought-stricken state of California, it is no-where near enough to alleviate an epic 21+ month long drought. A drought borne of a blocking pattern that began during the winter of 2012-2013 and now threatens to extend to the end of 2014 and, possibly, beyond.
In the wake of the storm, the powerful ridge reasserted — again delaying hopes that a parched California would at last begin to receive at least a normal allotment of rain.
(Euro Model forecast shows the ridiculously resilient ridge [RRR] strongly in place off the US and Pacific Northwest coasts in the October 6 run. Image source: ECMWF.)
It is a high pressure ridge based blocking pattern that has become so persistent that researchers at Stanford University have given it a new name — the ridiculously resilient ridge or Triple R. And the Triple R, according to those same researchers has climate change based origins.
The atmospheric conditions associated with the unprecedented drought currently afflicting California are “very likely” linked to human-caused climate change.
Researchers used a combination of climate models and statistical techniques to determine that large, persistent high pressure systems of the kind that have been locking California into perpetual drought are more likely in the presence of high concentrations of greenhouse gasses. They found that the ridge, which has generated year-round wildfires in California and at its peak intensity during January of 2014 stretched from Hawaii all the way to coast of the Arctic Ocean north of Alaska, was a kind of new species of extreme weather far more likely to occur in a human-warmed world.
(January 23 of 2014 weather pattern showing a moisture flow diverted from Hawaii to Alaska by the Triple R west coast blocking pattern. Image source: NASA.)
The anomalous strength of the ridge also likely played a role in the powerful polar vortex disruptions that were commonplace throughout the winter of 2014. As the ridge shoved more warm air into the polar zone north of Alaska the cold core of the polar vortex was displaced south and eastward over the Canadian Archipelago and Hudson Bay — driving extreme weather events over the central and eastern US as well as across the Atlantic and on to the UK.
The Researchers found that ridging was the overall and anomalous tendency of the pattern in this region of the northeast Pacific. They observed that the ridge remained strong throughout the winter of 2013, weakened during the summer of that year, then flared into an extreme intensity by January of 2014. Since that time, the ridge has swelled and spluttered, occasionally letting a storm or two pass but still serving as a kind of brutal sentinel to weather systems that would typically make their way to California.
The results of such a human-caused disruption of the climate are all too visible in the most recent US Drought Monitor.
(Despite tropical storms and the occasional weakness in the Triple R allowing a brief influx of moisture, 100% of California is still suffering from drought conditions with 58% percent of the state under the most extreme level of drought. Image source: US Drought Monitor)
A drought event that is the most extreme in the observed record and that is now linked to climate change by at least three major studies.
From the Stanford Study’s authors:
“We’ve demonstrated with high statistical confidence that the large-scale atmospheric conditions, similar to those associated with the Triple R, are far more likely to occur now than in the climate before we emitted large amounts of greenhouse gases,” Rajaratnam said.
“In using these advanced statistical techniques to combine climate observations with model simulations, we’ve been able to better understand the ongoing drought in California,” Diffenbaugh added. “This isn’t a projection of 100 years in the future. This is an event that is more extreme than any in the observed record, and our research suggests that global warming is playing a role right now.”


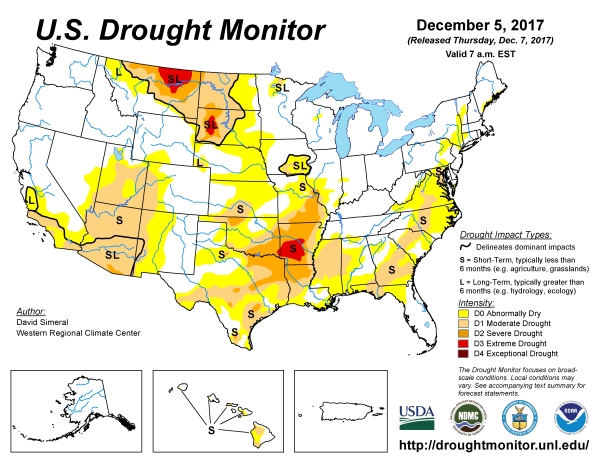
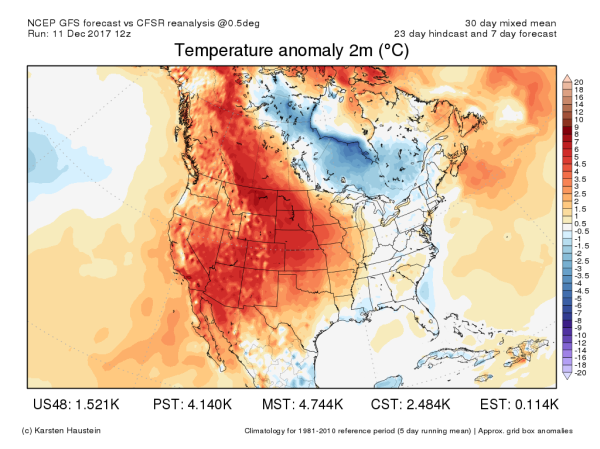
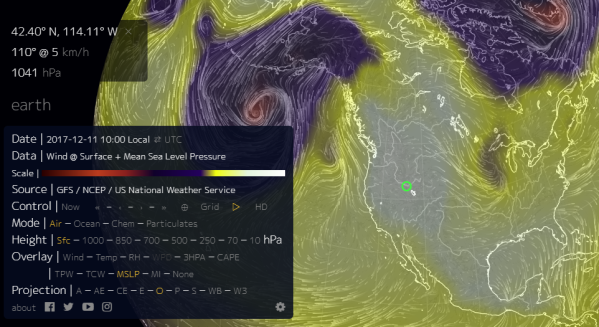


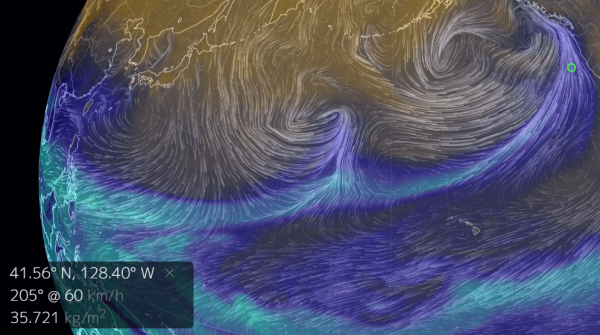

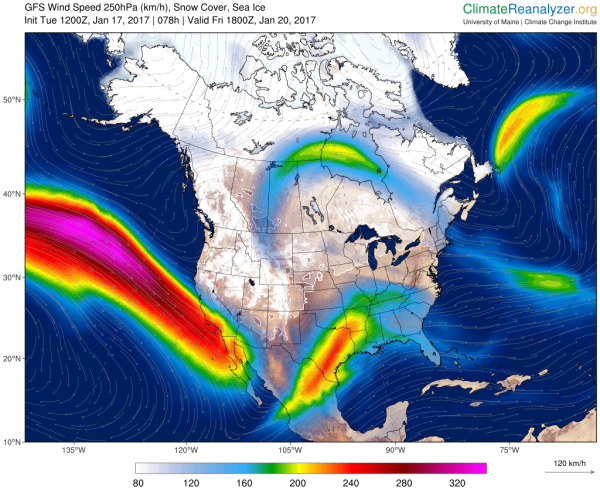


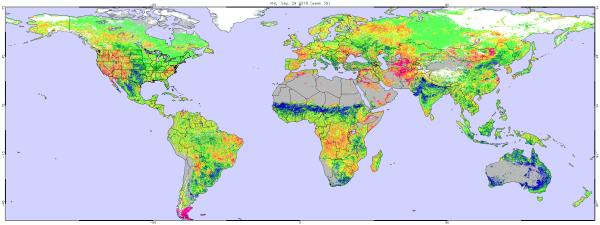
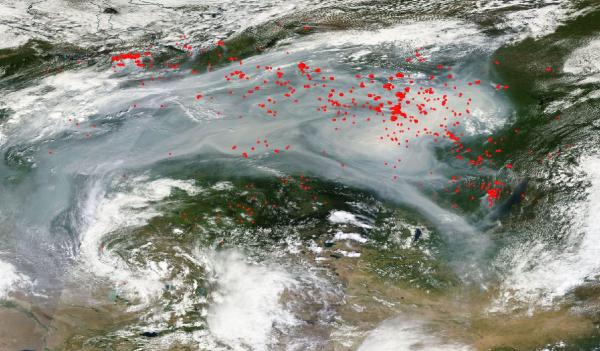


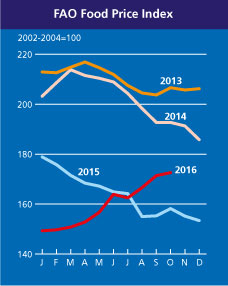

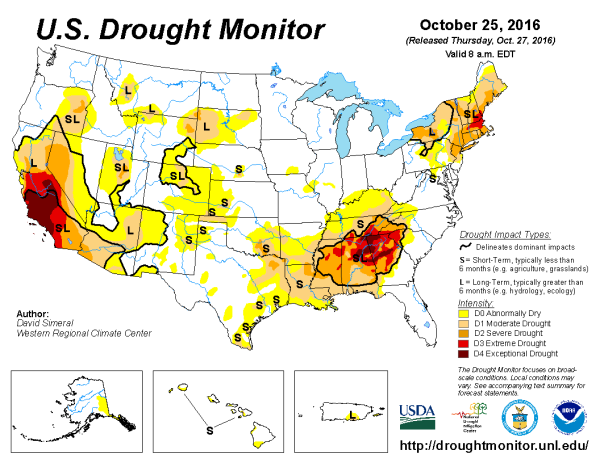
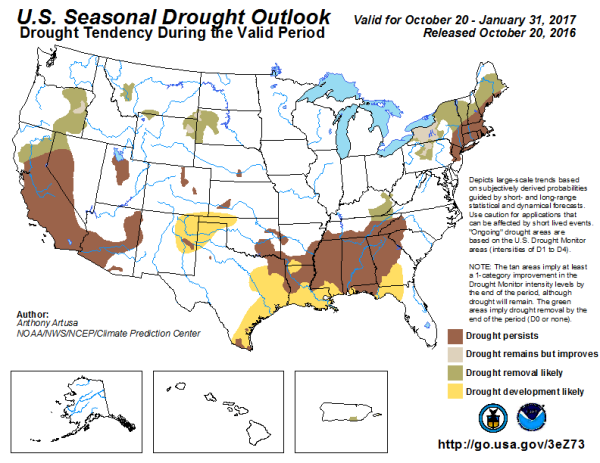


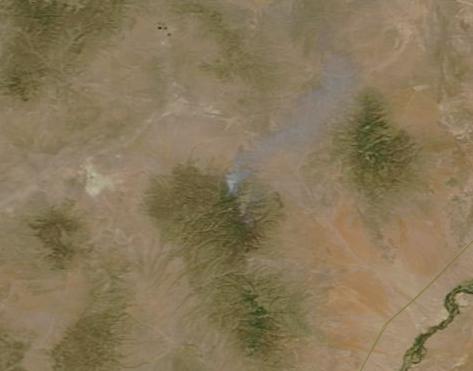


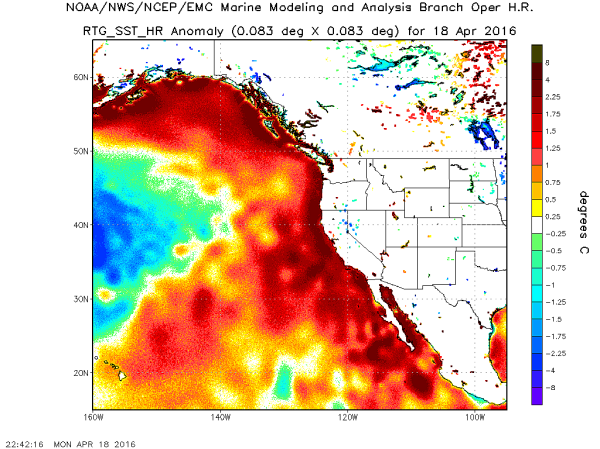
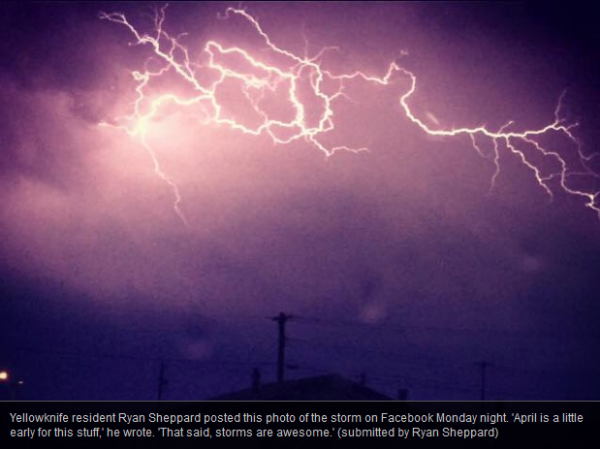
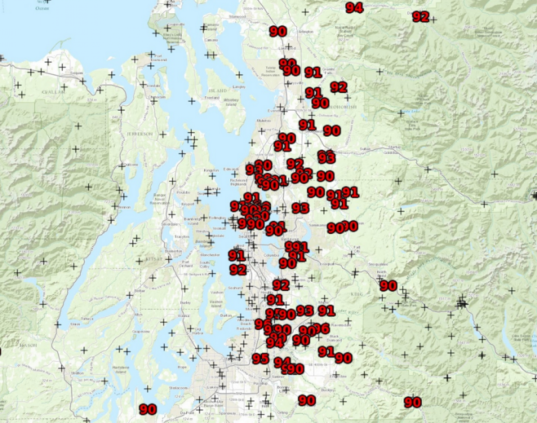
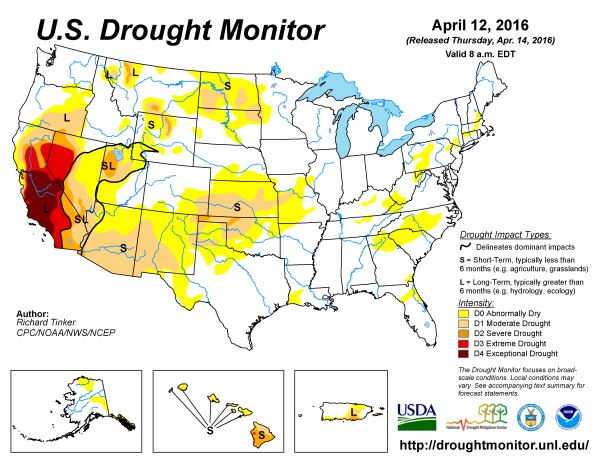
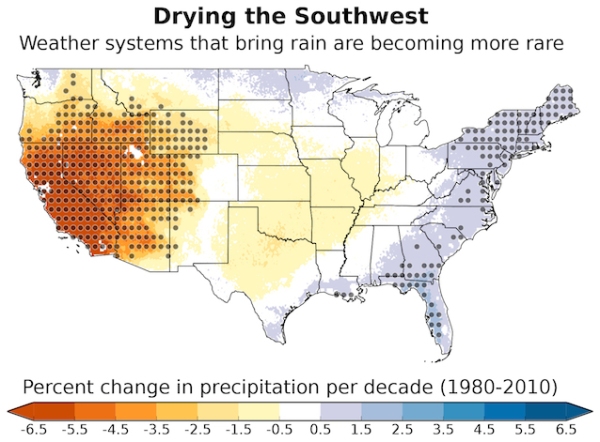
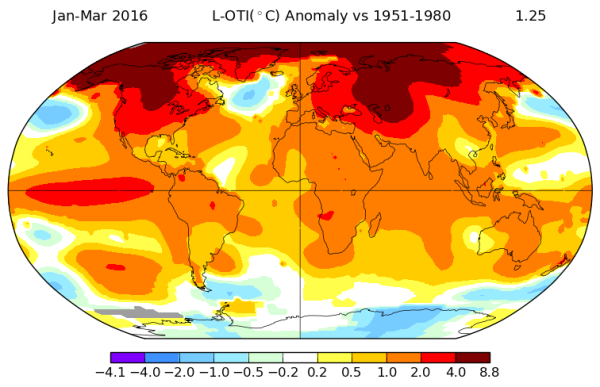


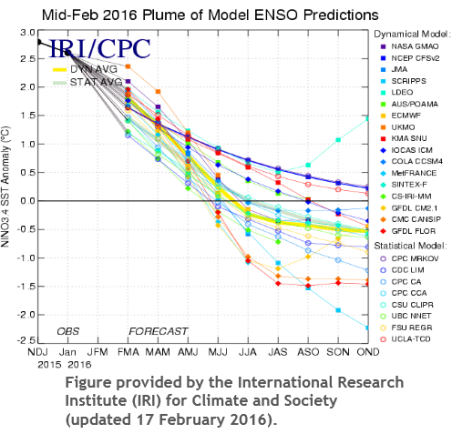


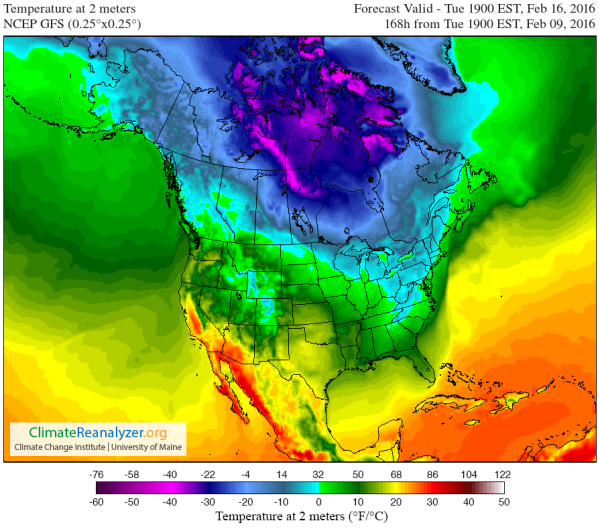
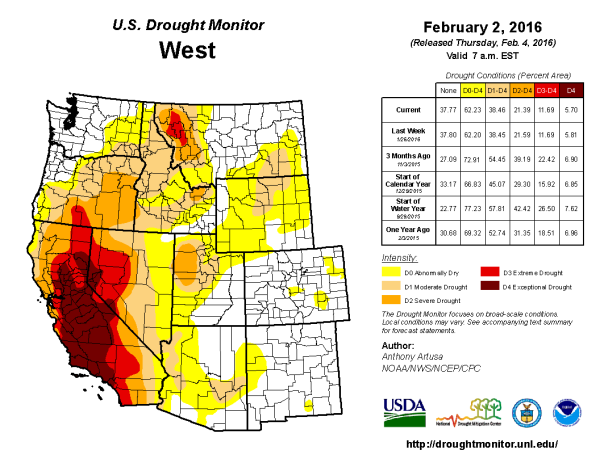

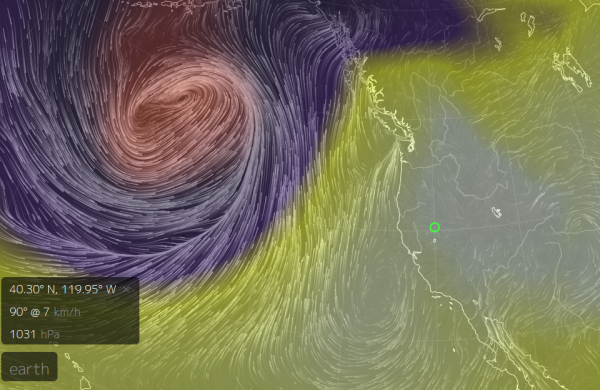
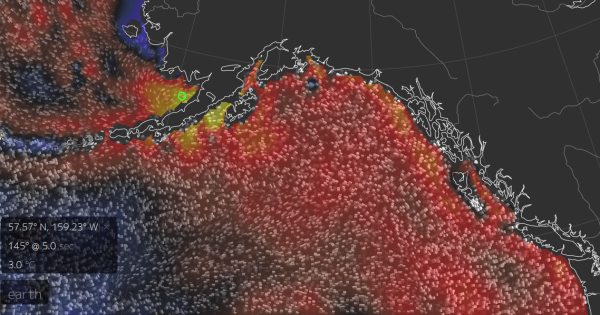
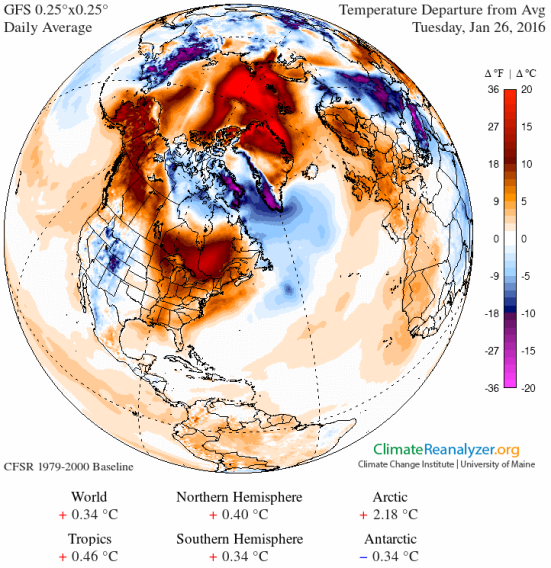

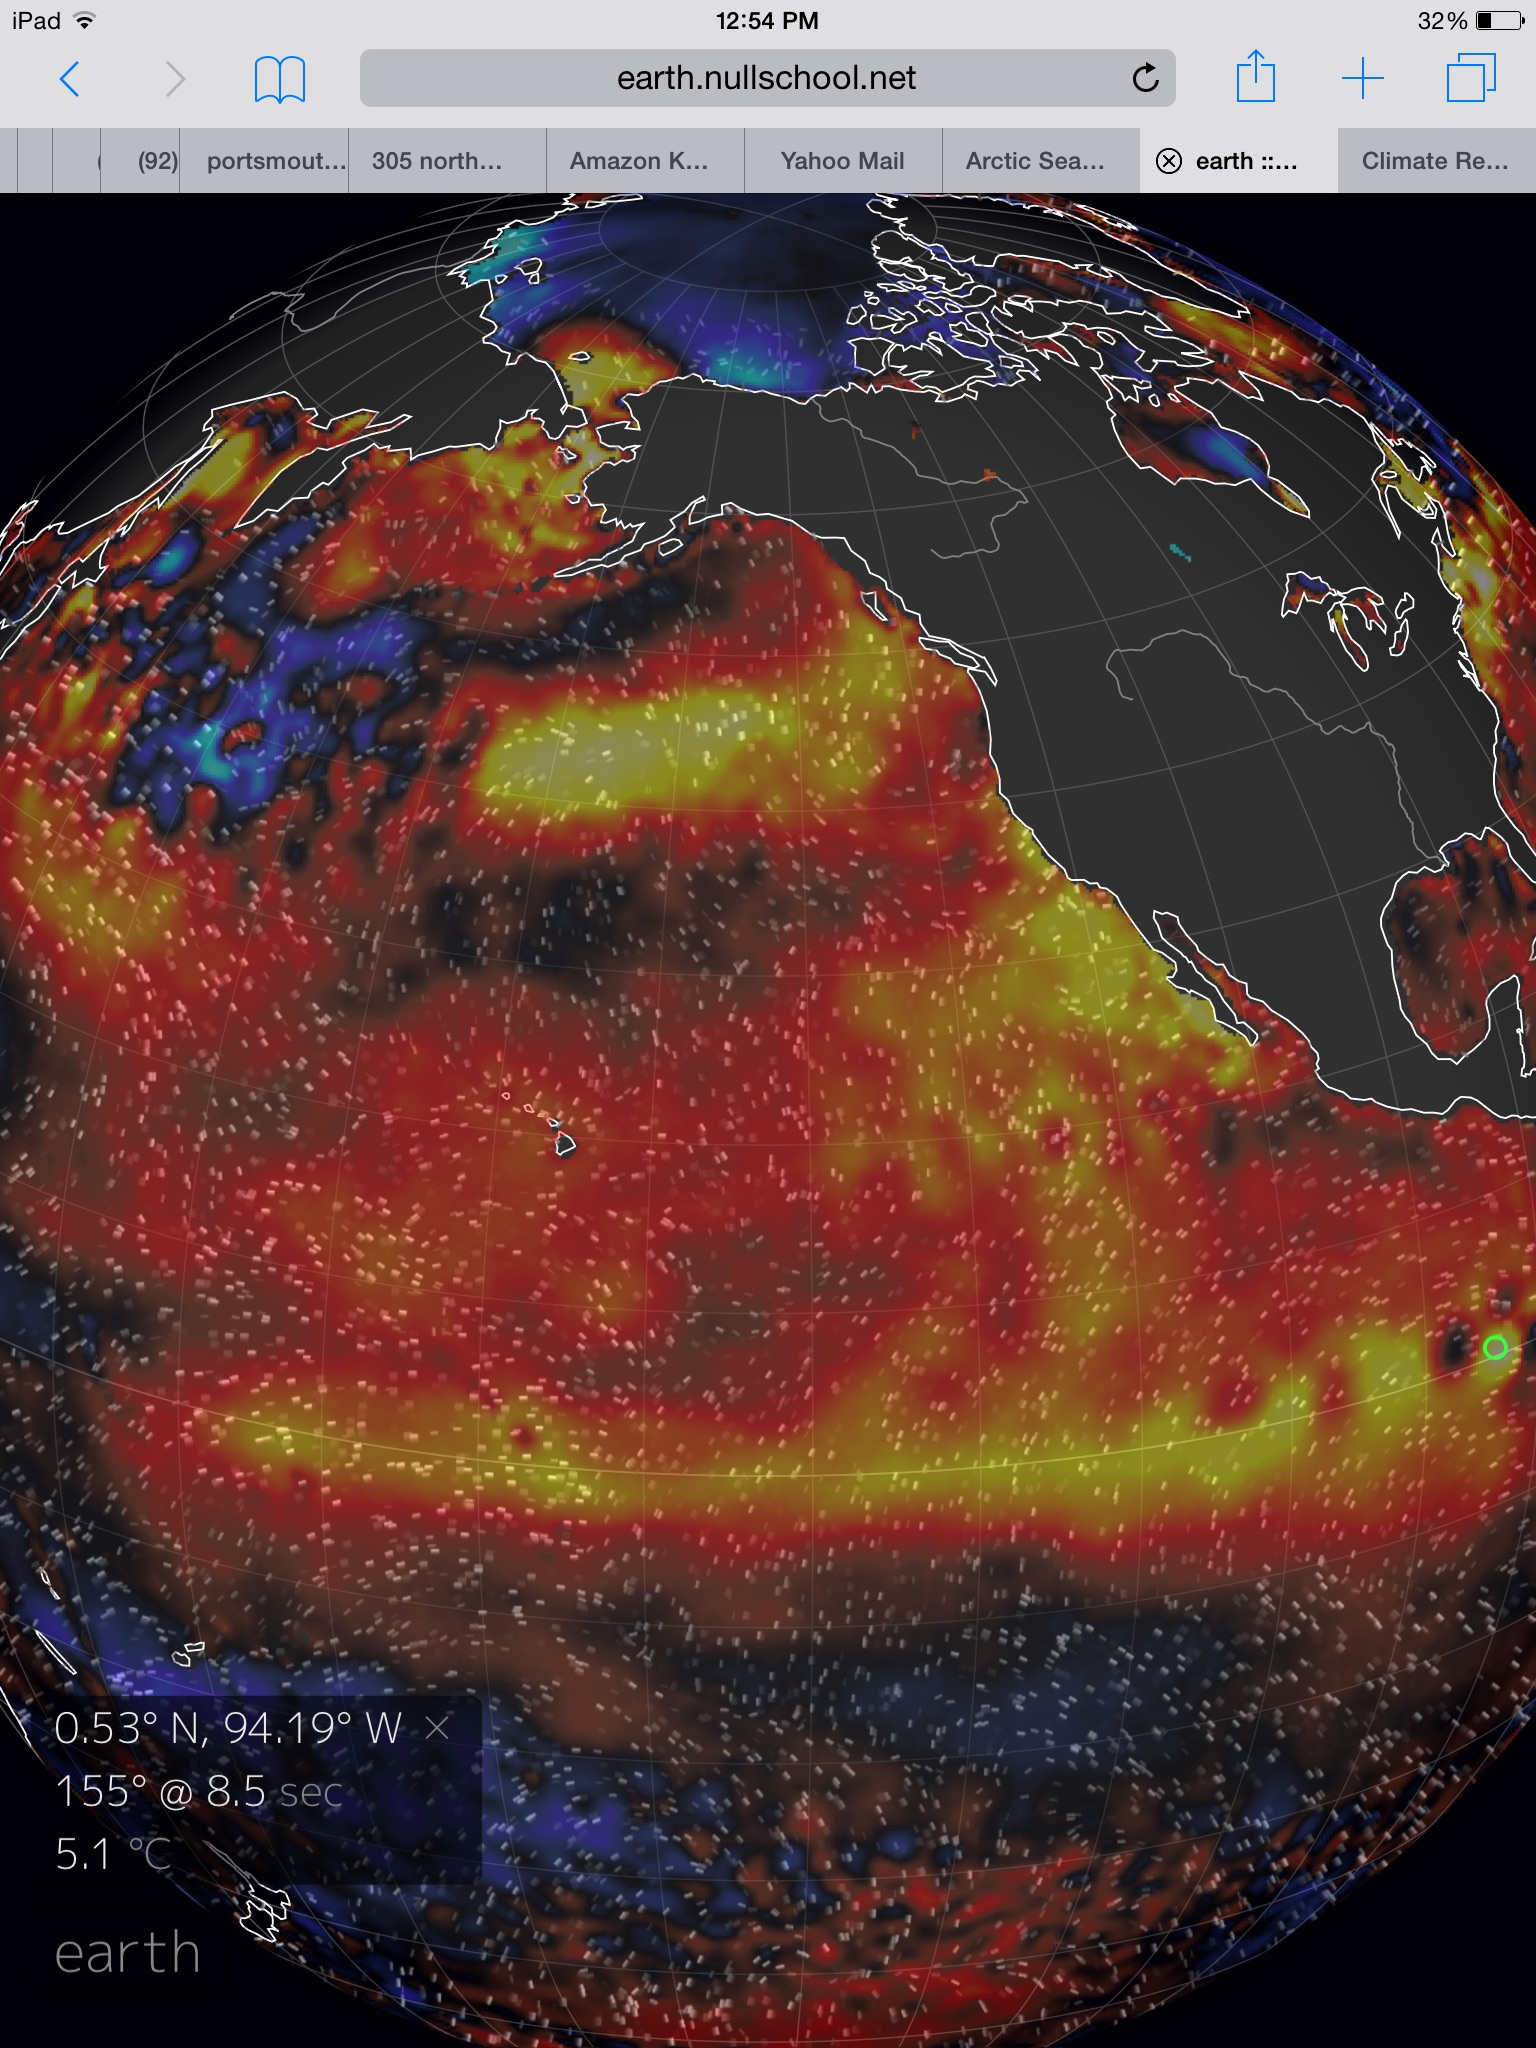
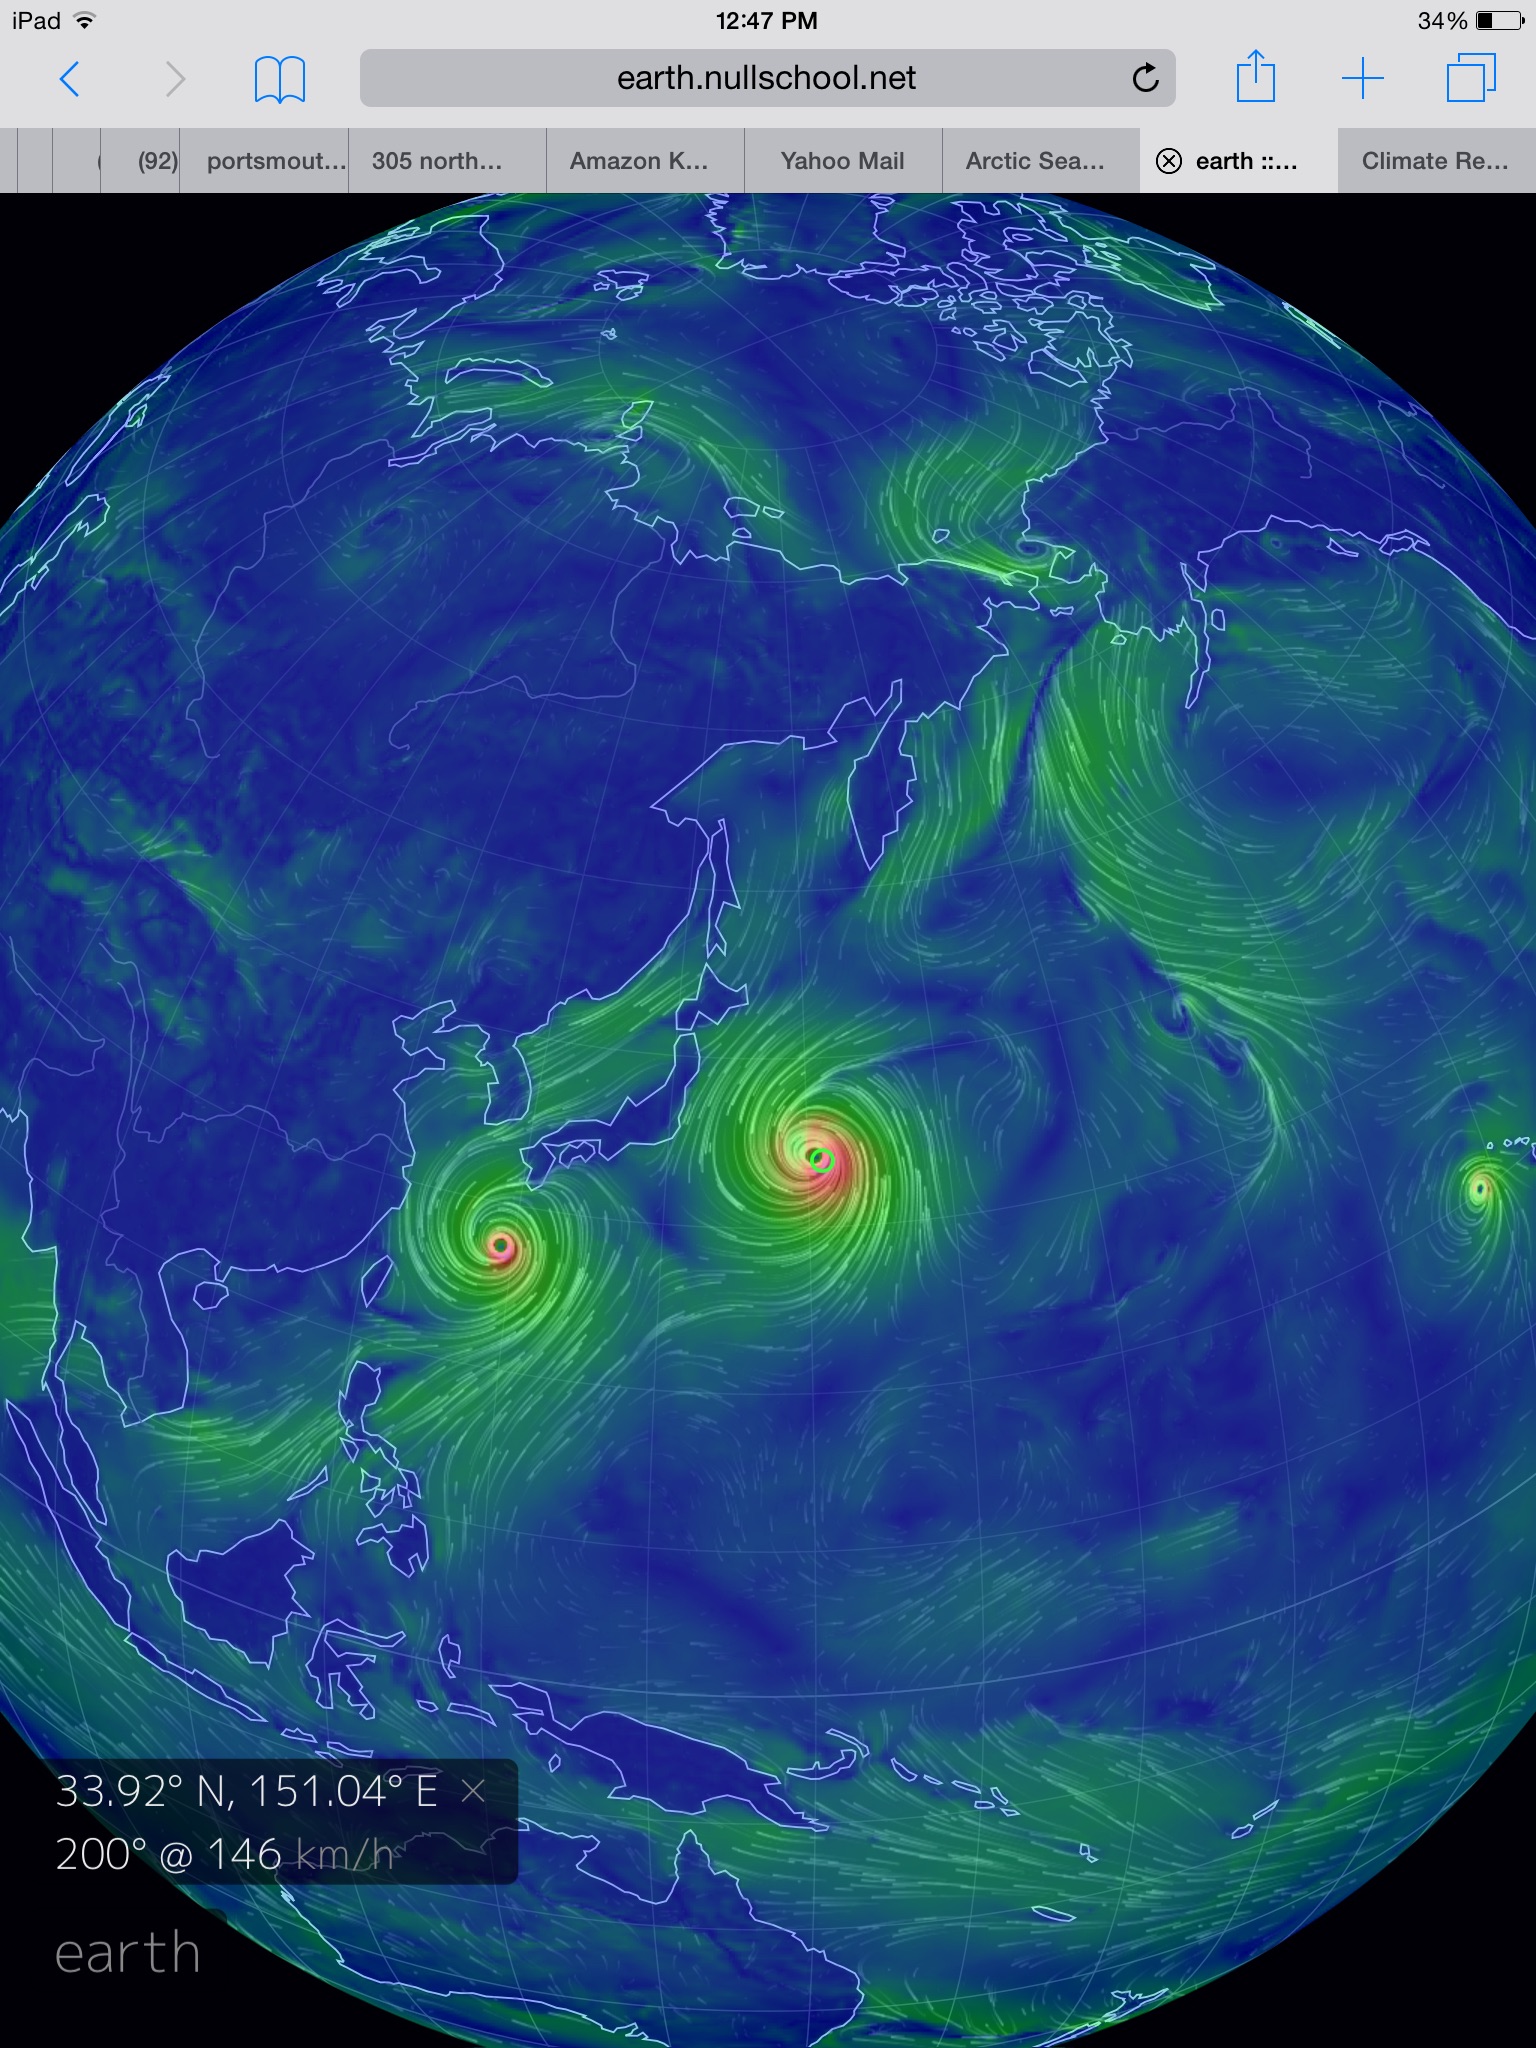


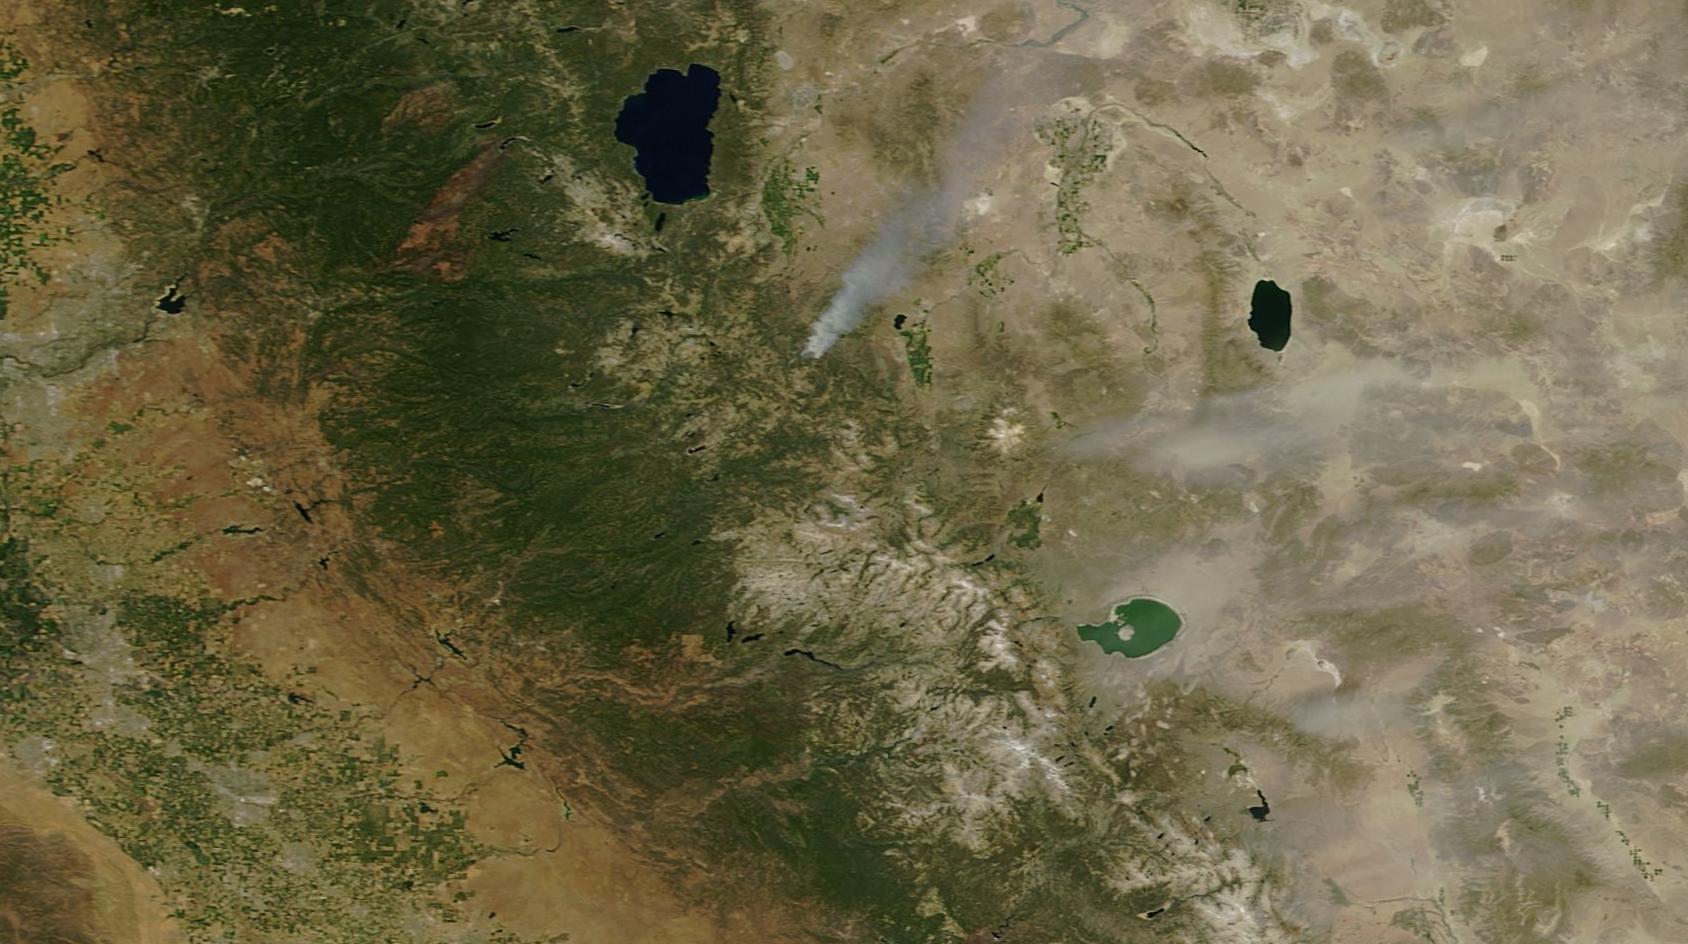
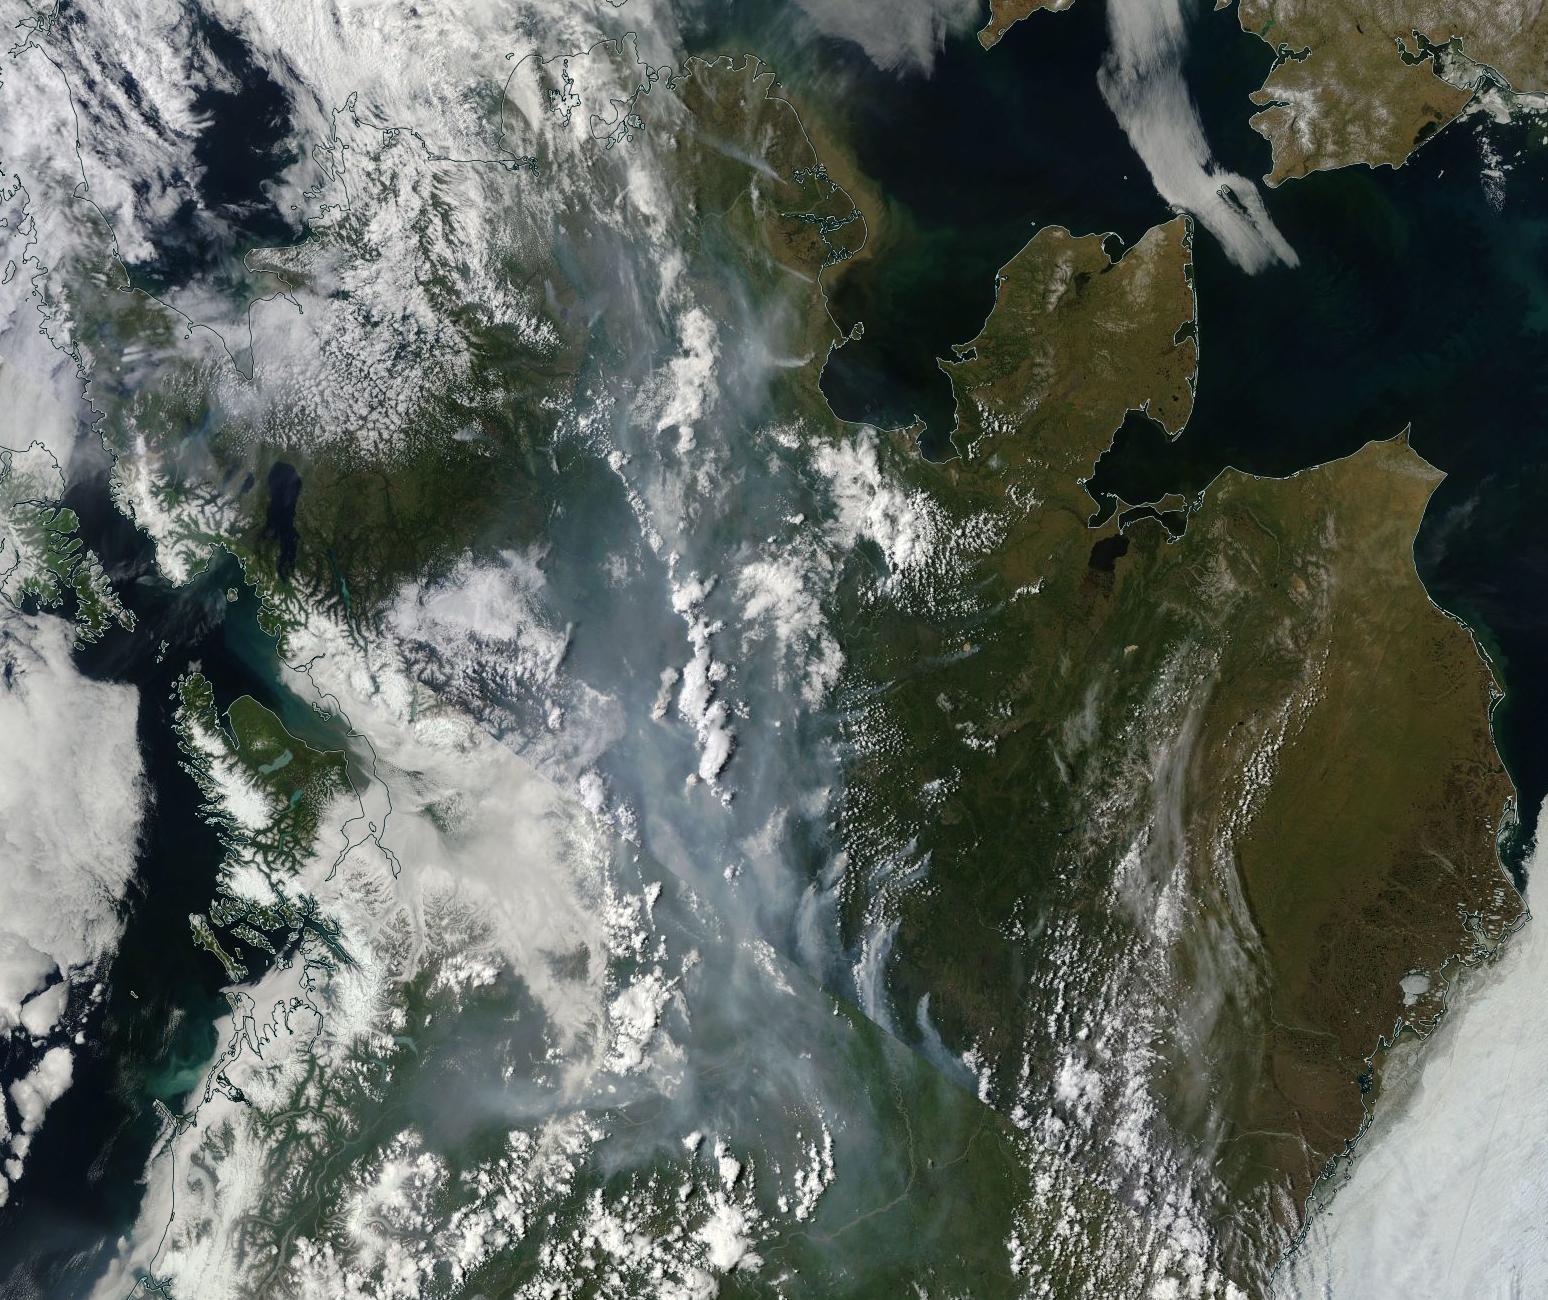


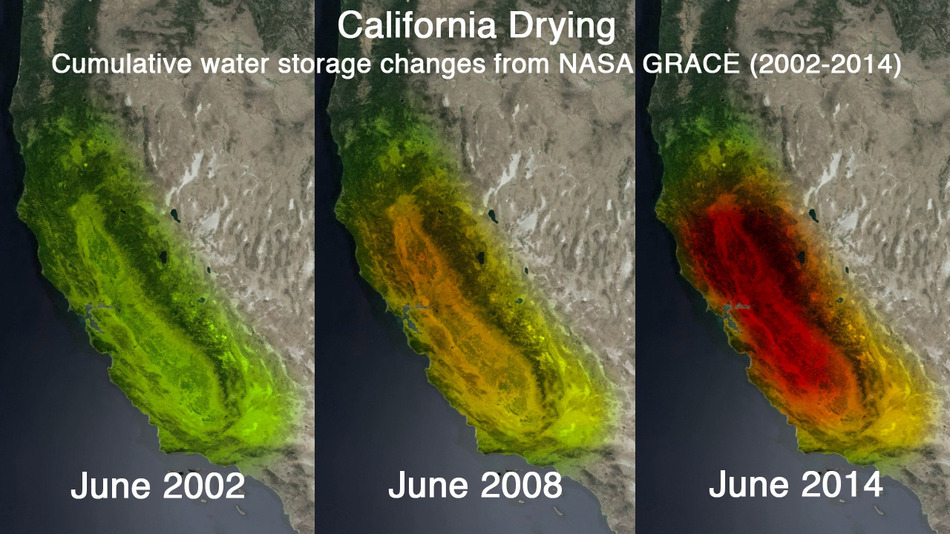
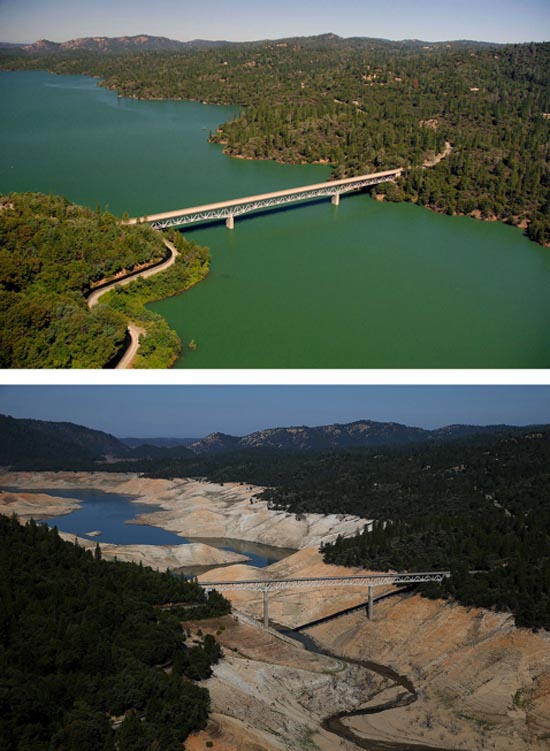


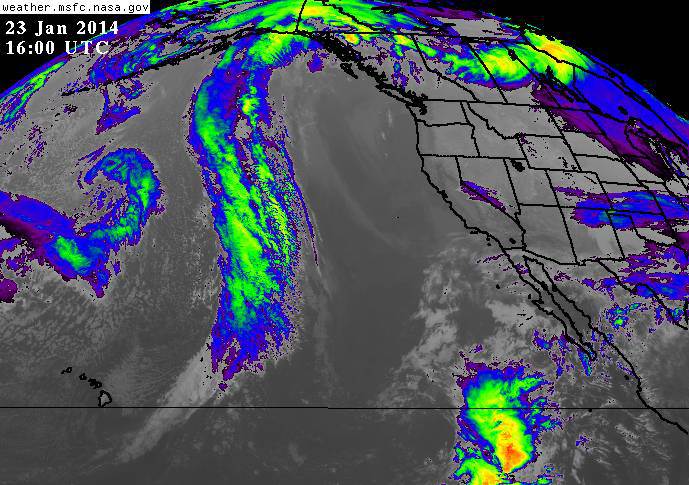


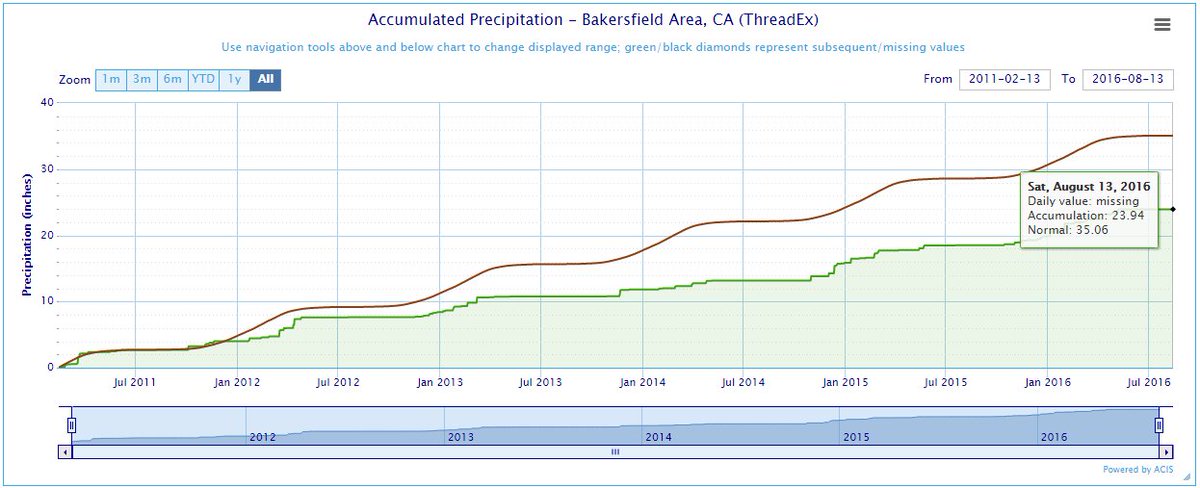