
A change in the persistent jet stream pattern that enhanced heatwave and fire intensity for the U.S. West is now providing relief. Meanwhile, a building ridge in the east has set the stage for potential record heat.
All posts tagged jet stream
Change in the Jet Stream Relieves West, Moves Heat East

Posted by robertscribbler on August 29, 2018
https://robertscribbler.wordpress.com/2018/08/29/change-in-the-jet-stream-relieves-west-moves-heat-east/
Seven Inches of Snow Dumped on Northeast as Another Major Arctic Warm-Up is Underway
As an April snowstorm strikes the U.S. Northeast, major global weather stories related to climate change are unfolding in real time. For today, we again find that none of the key climate zones feature below average temperatures even as a ten-day-long Arctic warm spell appears to be on tap.
Very Warm Arctic in Early April

(Another big Arctic warm-up drives cold air southward. The result is snow over the U.S. Northeast even as parts of the Arctic Ocean are experiencing an early thaw. Image source: Climate Reanalyzer.)
Warm winds driving northward over eastern Siberia, on the back side of a high pressure ridge, are delivering yet one more big dose of near or above freezing temperatures to this Arctic region. From the Chukchi Sea through the Bering Strait and on into East Siberia, temperatures range from 10 to 22 degrees Celsius above average. The Bering itself has been mostly swept clean of sea ice — with severe record low ice extent readings for this zone during early April.
Throughout winter, the Bering and Chukchi have received wave after wave of much warmer than normal air from the ocean zone to the south. This tendency for warm air propagating northward through the Pacific is one that is often triggered by La Nina — a periodic pattern of Pacific Equatorial surface water cooling that became a dominant feature of 2018 winter weather. However, globally warmer than normal ocean waters and, in particular, much warmer than normal sea surface temperatures in the Northeastern Pacific appear to have greatly enhanced the heat influx.

(Much warmer than normal sea surface temperatures in the Northeastern Pacific this year have provided a pathway for warm air to invade the Arctic. Meanwhile, La Nina and Polar Amplification generate a combined influence that weakens the Jet Stream and facilitates atmospheric ridges in this zone. Image source: Earth Nullschool.)
These warm waters at the middle to northern latitudes have developed a pathway that enhances the northward flow of tropical air masses over the Pacific Ocean. Meanwhile La Nina’s Equatorial cooling combines with climate change’s amplified polar warming to slow down the Jet Stream — further enabling this south-to-north heat transfer. As we have seen time and time again, human-forced global warming generated chiefly by fossil fuel burning is developing an atmospheric and oceanic handshake with past understood synoptic trends to produce an out-sized Arctic warming.
Bering Sea Almost Completely Cleared of Ice
This severe warming is plainly visible as open water is driven by outlandish temperatures well north and through the Bering Strait during early April. A time when ocean ice typically extends more than 150 miles south of Ninivak — bridging the water zone from Bristol Bay to the Kamchatka Peninsula.

(The Bering Sea is typically ice-choked during April. And during a normal year all the water zones in the above image would be covered with ice. But this spring, sea ice extent there is at never-before-seen record low levels. Image source: NASA Worldview.)
The impact is quite dramatic. During February, Bering Sea Ice hit 100,000 square kilometers below previous record lows for the Month. These record low extents continued throughout March and into early April when, today, we find that Bering sea ice extent is between 150,000 to 200,000 square kilometers below the previous record lows for the day and about half a million square kilometers below the seasonal average.
Putting this loss into context, half a million square kilometers is a region that splits the difference in size between the land mass area of California and Texas.
According to GFS model runs, the present Bering-East Siberia warm spell should last for another 2-3 days even as larger Arctic warming in the range of 2.4 to 3.2 degrees Celsius above average for the entire 66 North Latitude zone and on poleward is expected to continue through the ten day horizon. These warmer than normal temperatures should retard typical seasonal sea ice thickening in the far northern regions even as edge ice zones like those in the Bering, Baffin Bay, and the Sea of Okhotsk experience early spring melt and erosion.
New England Spring Snow
As warm air invades the Arctic — a feature that has become more and more prevalent as the globe itself has heated up — it tends to drive cold air southward over the North American, Asian, and European Continents. In this case, the warm air invasion coming from the Siberian side is displacing Arctic air over North America. As a result, and much to the delight of myth-enraptured climate change deniers everywhere, we have been treated to a rare, if not unheard of, spring April snowstorm in New England.

(Increasingly, there have been indications that polar warming related to global warming is influencing storm tracks and ridge and trough patterns in the Northern Hemisphere Jet Stream. The result is a stronger influence on Mid-Latitude Northern Hemisphere weather. Image source: Arctic Change and Possible Influence on Mid-Latitude Climate and Weather.)
According to local weather reports, as much as 7 inches of snow were dumped in intense 2-inch-per-hour bursts over parts of New England last night as a brief but intense storm roared through the region. The cold air, driven south by the recent warm polar air invasion, encountered high atmospheric moisture levels bleeding off a much warmer than normal Gulf Stream lurking just off-shore. The result, as has been the case during recent intense rain and snowstorms, was enhanced convection. This greater atmospheric uplift, in turn, produced an out-sized spring precipitation event. With below freezing temperatures driven far to the south by warm air entering the Arctic, the Northeast saw its first significant April snow event since 1982.
An April 6th to 7th Snowstorm for the U.S. South on the Way?
Further fodder for the climate change denial community supported by the anti-information campaigns of Fox News and others, may emerge by next weekend as another big push of cold air could help to develop a snow and ice storm stretching from Oklahoma through the Carolinas. Cold air driven out of the Arctic and southward over the Eastern and Central U.S. could result in 10 to 18 degree Celsius below average temperatures in that region. Moisture bleeding off the much warmer than normal Gulf of Mexico and Atlantic Ocean could be injected into this cold trough as a related storm develops. The result is a potentially unusual snow and ice storm. And an intense event off this kind, should it develop, would be a very odd weather event during U.S. spring-time.

(Another odd spring U.S. Snowstorm may be on the way for April 6th and 7th according to GFS model forecasts. Image source: Tropical Tidbits.)
Meanwhile, the U.S. tendency in the model forecasts is for warmer than normal temperatures in the West, cooler than normal temperatures in the East through the middle of April. It’s worth noting that the forecast also shows highly variable temperatures with strong swings between warm and cold throughout this period for most U.S. regions. As a result, as the Arctic remains much warmer than normal over the next ten days, the U.S. is likely to experience periods of both extreme warmth and extreme cold relative to climatological averages for this time of year.
Final Points — Intense U.S. Spring Snowfall Events a Likely Upshot of Polar Warming
Putting all these dynamics into context, we can sum up by making the following statements:
- April snow and even April blizzards are not unheard of for the U.S. East. That said, the recent events are odd and outside the context of regular U.S. weather patterns — particularly when it comes to precipitation intensity.
- Arctic warming and loss of regional sea ice, such as that seen in the Bering, is historically unprecedented during 2018. This is a continuation of an observed trend of polar amplification and severe warming seen during recent years.
- No major global climate zones show below normal temperatures on April 2, 2018. That said, a high variance in middle latitude northern hemisphere temperatures presently exists — with regions of intense cool and intense warmth interspersed.
- Snowstorms in the U.S. Northeast during April do not disprove global warming or a related shift to increasing climate extremes. In fact, they appear to be an aspect of it.
Share this:

Posted by robertscribbler on April 2, 2018
https://robertscribbler.wordpress.com/2018/04/02/seven-inches-of-snow-dumped-on-northeast-as-another-major-arctic-warm-up-is-underway/
Polar Warming Spawns More Severe Winter Storms
So there’s a lot of groundbreaking work going on in the climate sciences right now. And a major focus is evidence that winter polar warming events are increasingly connected to blizzards and storms in places like Europe and North America. Storms that are both historically powerful and that occur with greater frequency.

(A historic nor’easter produces major flooding on the U.S. East Coast even as a blizzard pounds the UK in early March. Were these extreme storms linked to human-caused climate change and related rapid polar warming? A new scientific study says — yes. Image source: NASA Worldview.)
A new study led by pioneers in the emerging field of climate change attribution for extreme weather events (including the notable Dr. Jennifer Francis), finds:
Recent boreal winters have exhibited a large-scale seesaw temperature pattern characterized by an unusually warm Arctic and cold continents… Using a recently developed index of severe winter weather, we show that the occurrence of severe winter weather in the United States is significantly related to anomalies in pan-Arctic geopotential heights and temperatures.
In particular, the authors discovered that “winter storms were two to four times more likely when the Arctic is abnormally warm, compared to when it was abnormally cold (emphasis added).”
Stronger, More Frequent Storms
This is a rather big deal for a number of reasons. First, it’s an observational confirmation of earlier scientific work predicting just these kinds of extreme weather instances due to polar warming and related climate change. Second, it’s another indicator that human-caused climate change is pushing us into a period of much stormier weather for the North Atlantic region during fall and winter.
(A new study in the journal Nature finds that winter storms in the U.S. are two to four times more likely when the Arctic is abnormally warm than when it is abnormally cold. Due to human-caused climate change, the Arctic is now warming up at a rate two times faster than the rest of the globe (emphasis added). Image source: Atmospheric and Environmental Research.)
With the new NASA global temperature data set out, I thought we’d take this opportunity to apply a bit of context to apparent stormy changes we see at present in winter weather patterns.
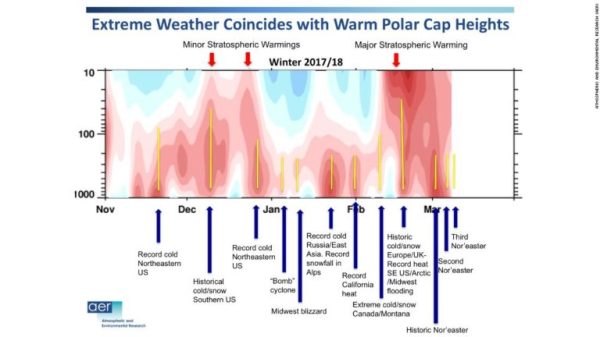
The first bit that I’d like to be crystal clear about is that the Arctic, overall, has become much, much warmer than usual during winter. That this warming spike occurs in the context overall global warming. And that this polar warming is increasingly associated with severe weather events in the middle latitudes and especially over the land and North Atlantic mid latitude zones.
The above graph shows polar temperature anomalies from the surface (1000 mb/2 meter) of the Earth to the top regions of the atmosphere (10 mb/25 kilometers). Along the bottom of the graph, we have a list of extreme weather events. Analyzing the graph we find that major polar warming associated with extreme temperature increases at the bottom of the atmosphere all the way through to the stratosphere correlate with recently more frequent historic blizzards and nor’easters in the regions mentioned.
Polar Warming Flushing Cooler Air into the Middle Latitudes
In previous posts, I used the ground-breaking scientific research of Dr. Jennifer Francis and others as a basis to analyze how energy transfer into the polar zone in the form of heat build-up has generated these extraordinary temperature extremes. How this ramping heat is associated with polar amplification — an aspect of human-caused climate change. And how these warming events can have upstream (Jet Stream) impacts that increase storminess in the middle latitudes.
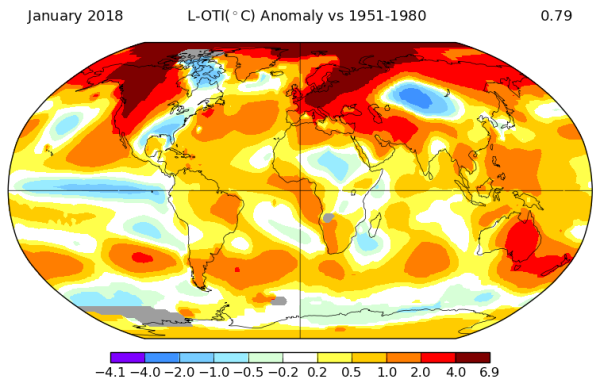

(From January [top] to February [bottom] the pole heats up and extreme weather events ensue. Image source: NASA.)
But let’s take this analysis a step further to look at, as January progressed into February, where it got warmer, where it got colder, and where the big storms fired off.
The maps above show global temperature anomalies (NASA) for January (top) and February (bottom). And looking at those maps we find that the polar region heated up significantly from already warm ranges of 4 to 6.9 degrees Celsius above average during January to an amazing 4 to 12.3 C above average during February.
As this relative polar warming increased during February, the NASA maps show that colder than normal temperatures expanded over North America through Canada and parts of the Northern U.S. even as a cold spell began to blossom in Europe. Cold pools that were fed by Arctic air shunting southward as the Polar Vortex collapsed and remnant continental troughs emerged.
NASA’s zonal anomaly measures provide further evidence for this trend.
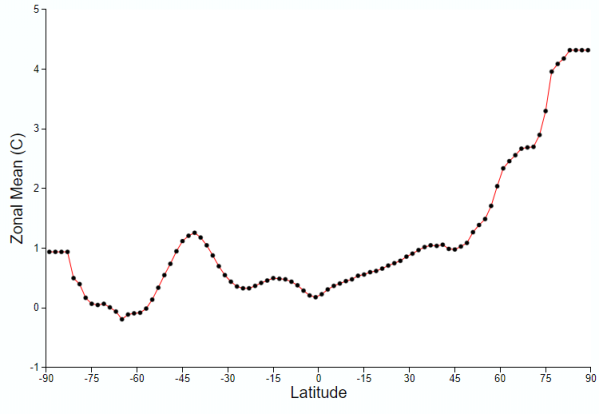
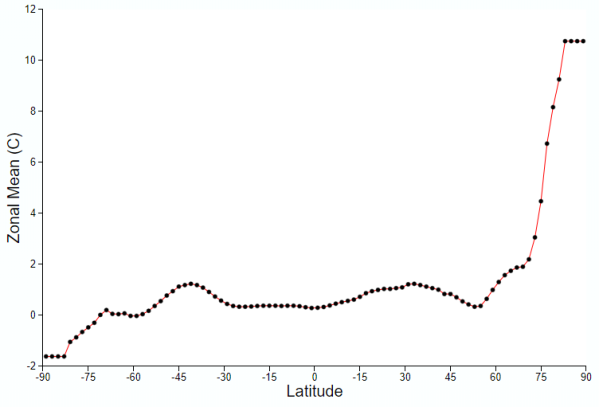
(Major northern polar warming from January [top] to February [bottom] is clearly visible in NASA’s zonal anomalies maps. Note that despite cold air excursions into North America and Europe, most zonal regions are warmer to much warmer than average.)
For here we find that as temperatures spiked from 4.5 degrees Celsius above average in the polar region of 80 to 90 degrees north latitude during January to an amazing 11 degrees above average during February, the region of 45 to 70 N dipped from 1 to 3 C warmer than average to 0.8 to 2.5 C warmer than average.
Note that the zonal middle latitude continental cooling is moderated by both the relatively warmer oceans and by very strong ridge zones running through these regions. But that the trough regions over both Europe and North America produced locally frigid temperatures and related instances of extreme weather.
Putting all these maps together from top to bottom we find that the polar warming events coincided both with mid latitude cooling even as we saw extreme snowfall in Canada and Montana, historic cold and snowfall in Europe and the UK, record flooding in the Central U.S., and record heat along the U.S. East Coast. We also find that the developing deep trough over Canada due to the expulsion of polar air southward in turn produced the succession of instabilities that would later spawn 3 very severe nor’easters off the U.S. East Coast during March.
Of course, all of these severe weather events are happening in the context of months that are around 1 degree Celsius warmer than 1880s averages globally. That January was the fifth hottest on record and that February was the sixth hottest on record during a La Nina that, all things being equal, should cause the world to be cooler than average.
But as we can see clearly here, all things are not equal — human-caused climate change is a big spoiler.
Share this:

Posted by robertscribbler on March 15, 2018
https://robertscribbler.wordpress.com/2018/03/15/polar-warming-spawns-more-severe-winter-storms/
A Hole in Winter’s Heart: Temperatures Rise to Above Freezing at the North Pole in February
“Weather is not Climate.”
But when a warm air influx carves a wide-ranging above-freezing hole into the heart of what should typically be ice-solid Arctic winter, then maybe it’s time to start re-evaluating the gist of the statement.
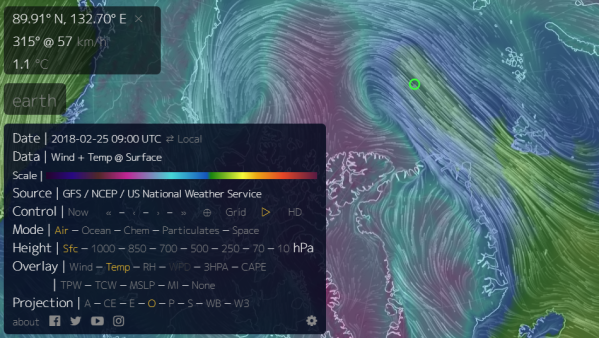
(Today, on Sunday February 25, 2018 at 0900 UTC — temperatures rose to above freezing at the North Pole. This event, which is probably unprecedented or, at the very least, an extreme instance in the polar record, is an exemplar — or a good example — of the kinds of wrenching weather changes we can expect as a result of human-caused climate change. Image source: Earth Nullschool. Data source: Global Forecast System Model.)
Weather and climate are inexorably married one to the other. Though weather is often variable and tied to locality, climate is broader-ranging and roughly characterized as average weather over 30 years. When climate changes, it ultimately changes average weather. It thus changes the rules in which weather occurs. So you can end up with weather events that are typically not common or have never been seen before — like category six hurricanes, much more heavy rainfall events, historic and unprecedented droughts, and above freezing temperatures at the North Pole during February even as Arctic air is driven south over Europe.
In the context of climate change, what we’re talking about is average global weather across the span of multiple decades. In some locations, this ongoing climate change has resulted in very little perceptible weather change. In other locations, and this is more and more-so the case, the changes to weather are both disruptive and profound.
https://twitter.com/SarahEMyhre/status/967281971679305728
We could say that they are, as Dr. Sarah Myhre noted in our little climate and weather chat yesterday, exemplars — or good examples of alterations that are characteristic of human-caused climate change.
******
Since late January, we’ve been tracking the potential for just such an exemplar extreme weather event — temperatures rising to above freezing at the North Pole during February.
The persistent weather patterns necessary for such an event were already well in play. At the surface, warm air was continuously running northward just east of Greenland — born pole-ward by powerful storms and frontal systems. At the upper levels of the atmosphere, a huge plug of warm air was developing. One that invaded the stratospheric levels of the atmosphere by the week of February 4-11. This plug, in synergy with surface warming, tore apart the heart of cold at the roof of our world that we call the Polar Vortex.
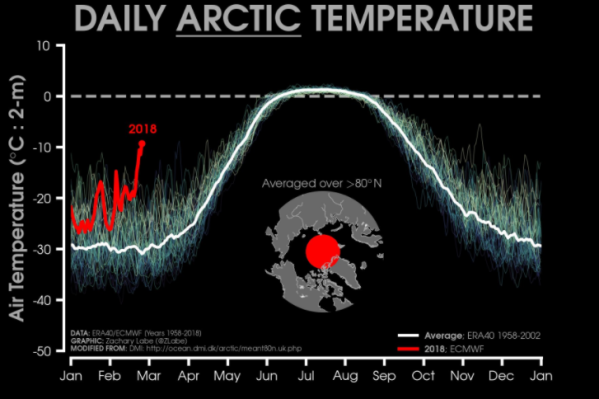
(Daily mean temperatures for the entire region of the Arctic above the 80 degree north latitude line rocketed upward to new records over recent weeks. Most recent temperatures are comparable to those typically seen during late May. Image source: Zachary Labe, Arctic Temperatures.)
Nodes of cold air from the remnant Polar Vortex spiraled south — bearing with them regional packets of Arctic air and setting off extreme cold weather in the middle latitudes. Meanwhile, the polar zone just kept warming up into ranges that were increasingly uncharacteristic of Arctic winter.
An extreme wave in the Jet Stream was developing and elongating over the North Atlantic, delivering more and more warm air northward.
By February 21st, the wave had extended into a knife-like extension east of Greenland and through the Barents Sea. Beneath this abnormal Jet Stream wave, which was starting to look more and more like a trans-polar river (of a kind predicted by Dr. Jennifer Francis as a result of human-caused Polar Amplification), was an intensifying thrust of outlandishly warm surface air.
![]()
(Jet stream wave originating near Spain extends northward past the North Pole on Sunday, January 25, 2018. Image source: Earth Nullschool.)
Over the past 72 hours, gale force warm, southerly winds gathered in the Atlantic, then blasted north.
At this point, we were starting to see some seriously outlandish temperatures in the higher latitude regions. Cape Morris Jesup, which is the furthest north location on Greenland, by Friday the 23rd experienced 6 C or 43 F temperatures on the shores of what should be a frozen solid Arctic Ocean just 400 miles from the North Pole.
The average high temperature in Cape Morris Jesup is -20 degrees Fahrenheit during February — making Friday’s reading a whopping 63 degrees F warmer than average. For reference, a similar departure for Washington, DC would produce a 105 degree day in February.
But it wasn’t just Cape Morris Jesup that was experiencing July-like conditions for the Arctic during February. For the expanding front of that ridiculously warm winter air by Sunday had expanded into a plume stretching tens of thousands of square miles and including a vast zone of temperatures spiking from 45 to 54+ degrees F above normal.
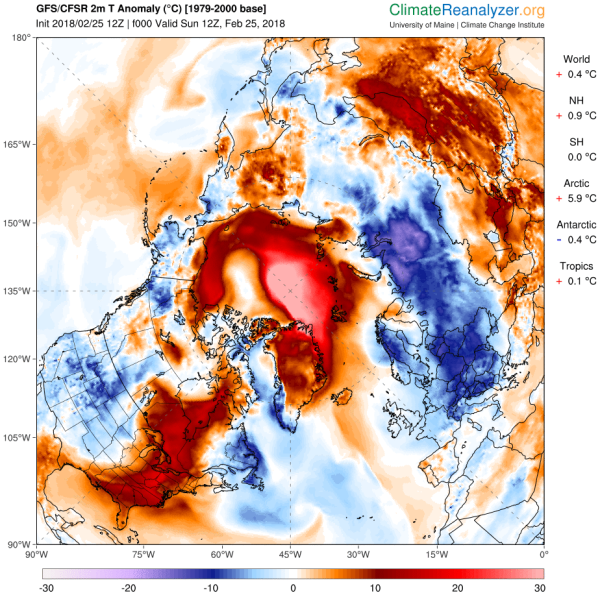
(The zone of pink-to-white in the above anomaly map shows temperatures ranging from 45 to 54 F [25 to 30 C] above average directly over a broad Arctic region centering on the North Pole. To this weather and climate observer, it looks like a hole in the heart of winter. Also note the region of cold air pushed south over Europe and the present above average [1981-2010] global reading. Image source: Climate Reanalyzer.)
And at the center of the warm air pulse was today’s earlier reading of 1.1 C or 34 F at the North Pole (see image at top of post). What would typically be a summer-time temperature for this furthest north location of our world happening during February. A highlight warm point in the midst of a vast plug of far warmer than normal air. A hole in the heart of winter.
We’ll wait for confirmation from experts like Chris Burt, Bob Henson, and Dr. Jeff Masters at Weather Underground, but it appears that this particular warming event — the highlight of an ongoing polar warming of the past few weeks — is without precedent in the Arctic during February. It is also an exemplar — a good example — of the kind of weather we can expect to frequent the Arctic more and more often as the global crisis that is human-forced climate change deepens and as its primary cause — fossil fuel burning — continues.
(Please also see Neven’s related excellent expert analysis of this unprecedented polar warming event at the Arctic Sea Ice Blog here. More to follow on impacts to sea ice in a developing post.)
Share this:

Posted by robertscribbler on February 25, 2018
https://robertscribbler.wordpress.com/2018/02/25/a-hole-in-winters-heart-temperatures-rise-to-above-freezing-at-the-north-pole-in-february/
Southern California Fires Expand to Over 255,000 Acres as Conditions Worsen
On Sunday, driven by above normal temperatures and fanned by warm winds, the Thomas Fire in Ventura County, California rapidly expanded. This resulted in a loss of containment as the blaze jumped fire breaks — placing parts of Santa Barbara under seige.

(Smoke plumes from the Thomas fire as seen by a webcam located atop Santa Ynez Peak, a 4300′ mountain 17 miles northwest of downtown Santa Barbara.)
This single fire, as of Monday morning, covered 230,000 acres. At that time, it was the fifth largest fire in California history. It was burning in December. And, at the time, the fire was continuing to swiftly grow.
Five other fires burning in Southern California together cover an additional 25,000+ acres. As a result, approximately 255,000 acres are now burning in this region of the state.
The 6,000 firefighters now engaged in battling these blazes had hoped that predicted milder Santa Ana winds would afford them a chance to gain an advantage over these fires this weekend. But this didn’t happen. The western high pressure ridge strengthened. Local temperatures increased to well above the seasonal average. And though winds subsided somewhat, very dry conditions dominated.
https://twitter.com/gvitty/status/939981486685437952
Due to the worsening situation, 25,000 structures are now threatened by the fires — up from 20,000 earlier this week. More than 790 structures have been burned or destroyed. More than 95,000 people remain under evacuation orders. And more than 85,000 people are without power. Tragically, the fires have now claimed their first human life as well.
Unfortunately, warmer than normal, dry and windy conditions are expected to continue through at least Friday, December 15th. Resulting in a long running period of heightened fire danger. These climate change related features are driven by a very persistent high pressure ridge over the North American west. A feature that has been linked to loss of sea ice and a warming Arctic in some climate studies.
Overall, climate change is worsening fire danger out west. During summer, hotter and drier conditions are intensifying the California fire season. And during fall through winter, the climate change associated warming, drying and strengthening of the Santa Ana winds is enabling the eruption of very large city-threatening fires during the winter months.
(UPDATED)
CREDITS:
Hat tip to Colorado Bob
Hat tip to Eric Holthaus
Hat tip to Wili
Hat tip to Titania Baildon
Share this:

Posted by robertscribbler on December 11, 2017
https://robertscribbler.wordpress.com/2017/12/11/southern-california-fires-expand-to-over-255000-acres-as-conditions-worsen/
A Visibly Extreme Jet Stream in Advance of Irma
On Tuesday, I wrote this blog about how Jet Stream behavior and related severe weather during summer of 2017 jibed with the findings of recent climate science. About how human-forced polar warming appears to be impacting extreme summer weather patterns by altering the upper level winds — with a particular focus on impacts to North America.
Yesterday, I looked at the upper level wind patterns running over North America in advance of Irma’s approach and saw this:

(Classic ridge-trough pattern like that identified by Dr Jennifer Francis and Dr Michael Mann. One that, according to their related research, increases the likelihood of certain kinds of extreme weather patterns and events. One that these scientists associate with polar warming set off by human-caused climate change. Image capture from 1500 UTC on September 6. Image source: Earth Nullschool.)
It’s a classic high amplitude wave form in the Jet Stream. One that shows an extremely deep trough digging all the way down to the Gulf Coast in the east and arching back up into a pointed ridge north of Alaska and into the Arctic Ocean in the west. This kind of high amplitude wave pattern is not typical. Or if such a pattern did appear in the past, it tended not to stick around for so long. But during this summer, such intense high amplitude ridges have been forming again and again over the west and such deep troughs have been forming again and again in the east.
New Precipitation and Temperature Extremes
The most apparent visible effect of this ridge-west — trough-east pattern has been to produce record heat, drought, and wildfires in the west and record rainfall in conjunction with an extremely stormy weather pattern in the south and east. You can plainly see this dipolar relationship in the precipitation and temperature anomaly maps provided by NOAA below:

These maps cover precipitation and temperature observations for the last 30 days compared to climatological averages. In the west we find that precipitation for large regions has been less than 10 percent of normal (less than 1/10th normal). Meanwhile temperatures in the west have ranged between 1 and 4 C above average. In the south and east, large regions have seen between 200 and 800 percent of typical precipitation amounts (2 to 8 times the norm). Temperatures, meanwhile have ranged between 1 and 3 C below average.
This is the very definition of heightened extremes. Looking at the prevalent upper level air pattern over the U.S. for the summer of 2017, it’s clear that south to north upper level winds pulling air up from the Equatorial zone toward the pole are facilitating one side of the extreme and that a countervailing upper level wind originating near the pole and running south toward the tropics is driving the opposite extreme.
Slowing Upper Level Winds in a North-South Orientation Weakens the Steering Currents
Unfortunately, prevalent and long lasting heat or heavy rainfall isn’t the only apparent impact of this new pattern. Another aspect of this extreme dipole is a weakening of the west to east steering currents that typically begin to pick up in a region between 25 and 30 degrees North Latitude and to intensify further beyond the 30 N line. This effect is due to the fact that upper level wind patterns are oriented more in a north-south (west) or south-north (east) direction and due to the fact that under such large Jet Stream meanders the upper level steering winds tend to slow down.
https://twitter.com/RyanMaue/status/905689235486887936
(It’s not just Harvey and Irma. Weak upper level steering currents are contributing to a long range potential that Jose might loop back to strike South Florida.)
For Hurricanes like Harvey and Irma, stronger west to east steering winds have had two protective effects for the United States. First, they have helped storms to keep moving — working to generally prevent the kind of long duration stall we saw that helped to produce such catastrophic flooding during Harvey. Second, they have tended to deflect storms away from the U.S. East Coast. And for Irma, what this means is that this storm is more likely to strike the U.S. East Coast if the upper level steering winds that would typically turn it to the east are weak.
This is a dynamic upstream aspect of human-forced polar warming. One that produces added extreme weather risks on top of those already generated by warming ocean waters — which increase peak potential storm intensity — and rising atmospheric water vapor — which helps to add latent heat, lift and related convective available potential energy that increases top limits for storm intensity and heavy rainfall.
And as we sit here hoping and praying that Irma will re-curve away from the U.S. east coast, we should consider how polar warming may be helping to make such a terrible strike more likely — increasing risks to so many people and to so much that we all hold dear.
RELATED STATEMENTS AND INFORMATION:
Links:
GFS Model Runs illustrated by Earth Nullschool
Extreme Weather Events Linked to Climate Change’s Impact on Jet Stream
This is the Pattern Climate Scientists Warned us About
Hat tip to Scott
Hat tip to Wharf Rat
Share this:

Posted by robertscribbler on September 7, 2017
https://robertscribbler.wordpress.com/2017/09/07/a-visibly-extreme-jet-stream-in-advance-of-irma/
A Halo of Storms and Heatwaves — New Study Confirms that Global Warming is Wrecking the Northern Hemisphere Jet Stream
“We came as close as one can to demonstrating a direct link between climate change and a large family of extreme recent weather events.” — Michael Mann
*****
The Earth is warming, the weather is growing more extreme, and from the observational perspective, it appears that the Northern Hemisphere Jet Stream has undergone some seriously disturbing changes. Over the past five years, this subject has been one that’s spurred heated debate among scientists, meteorologists, and global climate and weather watchers. Now, a new model study finds that it’s likely that the Jet Stream is being significantly altered by human-forced climate change and that this alteration is helping to drive extreme weather events like the 2003 European heat wave, the 2010 Pakistan flood and Russian heat wave, the 2011 Texas heat wave and recent floods in Europe.

(More extreme variation in upper level wind speeds is an upshot of polar warming during boreal summer. The result is that risks of severe heatwaves, droughts, wildfires and floods increases as the Earth warms. Image source: Michael Mann, Penn State.)
From the study:
… our analysis of both historical model simulations and observational surface temperature data, strongly suggests that anthropogenic warming is impacting the zonal mean temperature profile in a manner conducive to wave resonance and a consequent increase in persistent weather extremes in the boreal summer.
What this means is that the new study provides still more evidence that the Jet Stream’s north to south variance is increasing during summer. As a result, it is enabling powerful heat domes to form in regions where winds run from south to north. In regions where the upper level winds run from north to south, it creates cooler zones in which powerful storms can flood large swaths of countryside. In other words, increasingly juxtapposed zones of extreme temperature anomalies and higher atmospheric instability and moisture loading tend to form more and more often. And this results in weather patterns that we have never really seen before.
(An Inconvenient Sequel is a call for action on climate change like we’ve never seen before. And the imperative to act on climate is now stronger than it ever was.)
The fact that the Mann study uses observational and model assessments to find that such changes are likely to very likely now being caused by human-forced warming and related polar amplification is a highly significant scientific finding. It adds one more attribution tie to the extreme weather events that we’ve been seeing with increasing frequency. A tie directly to global warming. And it does so through model studies that identify the underlying physical mechanisms at work. It’s a pivotal moment in the atmospheric sciences. And everyone needs to sit up and pay attention.
Credits:
Hat tip to Colorado Bob
Hat tip to Cate
Scientific hat tip to Dr Michael Mann
(Please support publicly-funded, non-special interest based science that is now under assault by the climate change denying Trump Administration)
Share this:

Posted by robertscribbler on March 30, 2017
https://robertscribbler.wordpress.com/2017/03/30/a-halo-of-storms-and-heatwaves-new-study-confirms-that-global-warming-is-wrecking-the-northern-hemisphere-jet-stream/
Warm Winds Take Aim at Chukchi as Arctic Sea Ice Volume Hits Record Lows
Temperatures over the Chukchi Sea are predicted to hit as high as 37 degrees Fahrenheit (2.9 C) on Wednesday and Thursday as a massive high pressure ridge building over Alaska pulls warm, moist Pacific air northward. These temperatures represent staggering warmth for this Arctic Ocean zone during March when temperatures are typically about 54 degrees F (30 degrees C) cooler.
Major Warm Wind Invasion for the Chukchi This Week

(Multi-day above freezing temperatures for the Chukchi sea predicted for later this week is not a normal event for early March. Unfortunately, warm wind invasions like this one have become more common as the globe has warmed up due to human fossil fuel emissions. Image source: Earth Nullschool.)
This recent warm wind invasion is one of many observed over the past five years in which enormous bulges in the Jet Stream have pierced deep into what was once a mostly impenetrable pall of winter chill hanging over the Arctic. It’s a new atmospheric condition associated with rampant fossil fuel burning. One that has produced considerable damage to the Arctic environment by reducing sea ice coverage, threatening key species, melting glaciers and thawing permafrost.
Such incursions of extreme warmth bear the obvious marks of a failing of Arctic cold brought on by human-forced climate change and have tended to generate significant spikes in overall Arctic surface temperatures during fall, winter, and spring. This week’s warm air invasion of the Chukchi is expected to help push readings for the entire region above the 66 degree north latitude line to 4.5 C (8 F) above average for this time of year. That’s a strong departure for this region during the month of March when the typically more uniform advance of warmth in the lower latitudes tends to strengthen the Jet Stream — locking in Polar winter conditions in the far north through about the middle of April.

(The warm wind invasion of the Chukchi Sea is expected to help push overall Arctic temperatures considerably higher. Image source: Climate Reanalyzer.)
Far above average Arctic surface temperatures extending from October of 2016 through March of 2017 have been triggered again and again by these floods of warm air rising up from the south. And the net effect on Arctic sea ice volume has been little short of devastating.
Arctic Sea Ice Volume Lowest Ever Recorded During Winter, Comparable to Summer Volumes of the Early 80s
Arctic sea ice volume for both January and February of 2017 are now far below past record low trend lines for this time of year. Present record low monthly values for this past February are around 17,000 cubic kilometers vs previous record lows for the month during 2013 at around 19,500 cubic kilometers. Last February’s sea ice volume average of 17,000 cubic kilometers is about the same sea ice volume measured at the end of melt season in September of 1981. In other words, sea ice volume in winter now is comparable to sea ice volumes during the summers of the early 1980s.

(Arctic sea ice volume has never been this low during winter time. Image source: PIOMAS.)
All the record warmth flooding into the Arctic during 2016 and 2017 has undoubtedly contributed to these new record lows for sea ice volume. And a cooling of the Arctic surface relative to recent record warmth during March and April could soften this worrying trend somewhat. To this point, it is worth noting that sea ice extent measures are now closer to past record low trend lines. So there has been some slightly more hopeful inching back to slightly less ridiculously abnormal measures. A more positive movement that will likely take a hit as Arctic temperatures are predicted to significantly warm again this week.
Weather is Variable, But the Underlying Trend Looks Pretty Bad
Weather, as we should note, can be quite variable and may bring a more pleasant surprise later in the month. However, despite this potential, sea ice states are looking as bad or worse than they ever have at the end of freeze season. And it is worth noting that less ice coverage and volume leaves more dark water open to absorb the sun’s springtime and summer rays and less ice to reflect it. Furthermore, post La Nina periods, as we are now experiencing, tend to flush more atmospheric and ocean heat into the Arctic. So, despite the variable nature of weather overall, we’re in a bit of a situation where the systemic trend odds of a noteworthy sea ice recovery toward more rational trend lines pre-summer 2017 aren’t looking very good.
Links:
Share this:

Posted by robertscribbler on March 6, 2017
https://robertscribbler.wordpress.com/2017/03/06/warm-winds-take-aim-at-chukchi-as-arctic-sea-ice-volume-hits-record-lows-during-february-of-2017/
Arctic Heatwave Forecast to Crush Northern Hemisphere Snow Cover This Week
The Russian side of the Arctic is heating up.
A high amplitude ridge in the Jet Stream is forecast to develop atop the Yamal region of Russia, expand northward over the Kara and Laptev seas, inject a plume of anomalously warm air over the polar region, and then proceed on along the Arctic Ocean shores of Siberia. Beneath this ridge, temperatures over the Arctic Ocean will spike to +1 to +4 C above average while temperatures over land will hit extreme +20 C and higher anomalies.

(Arctic heatwave invades Siberia in the GFS forecast for later this week as depicted by Climate Reanalyzer.)
Arctic Ocean zones are forecast to see temperatures climb above freezing for much of the 80 degree North Latitude zone. Over Siberia, land-based temperatures are predicted to range from the 40s and 50s along the Arctic Ocean boundary and climb to the 60s to 80s in regions just inland.
As temperatures tend to flatten out over Arctic Ocean waters and as permafrost zones in Siberia are used to far cooler readings during Northern Hemisphere Summer, the predicted heatwave is likely to have some rather strong impacts should it emerge. Most notably, snow cover over remaining land and sea ice is expected to see a rather extreme reduction over the next seven days. In other words, GFS forecast models show Northern Hemisphere snow cover basically getting crushed:


(Massive reduction in Northern Hemisphere [NH] snow cover predicted coincident with Siberian Heatwave later this week. Left frame shows current NH snow cover. Right frame shows predicted NH snow cover for Tuesday, June 9. Image source: Climate Reanalyzer.)
Sparse remaining snow cover in Northeast Siberia along the East Siberian Arctic Shelf coastal zone is expected to be pretty much wiped out. One foot average snow cover along the shores of the Laptev and Kara seas is also expected to melt. And a broad section of remaining snow upon the sea ice is predicted to retreat away from the North Polar region — receding back toward the final haven near Greenland.
Snow is important for spring and summer-time Arctic temperature moderation due to the fact that it provides insulation to sea ice and permafrost as well as serving as a reflective, high-albedo surface that bounces back some of the incoming heat from the 24-hour seasonal Arctic sun. Snow melt, on the other hand, serves to form albedo-reducing melt ponds over the Arctic Ocean sea ice during summer. A critical factor in late season melt forecasting in which more June melt ponds tend to mean lower sea ice totals by end season. In addition, snow melt fills permafrost zone rivers with above-freezing waters that then flow into the Arctic Ocean — providing yet another heat forcing to the sea ice.
Conditions in Context
This weekly trend and forecast is consistent with an ongoing tendency during 2015 for strong ridge formation and warm air slot development over both Alaska and the Yamal region of Russia. The high amplitude ridges also likely have teleconnections with larger weather patterns such as El Nino in the Pacific, the warm water pool (hot blob) in the Northeast Pacific, and record low sea ice extents continuing for most of Northern Hemisphere Spring. Observations that are also consistent with the predictions made by Dr. Jennifer Francis that are a direct upshot of polar amplification set off by human-caused warming of the global climate system.

(GFS model forecast as depicted by Earth Nullschool showing ridge Northwest Territory, trough Greenland and North Atlantic, ridge Kara and Laptev region of Siberia. A dynamic that may be the result of teleconnections set off by factors related to human-caused climate change. Image source: Earth Nullschool.)
It’s worth noting that many of these factors are self reinforcing. For example, more sea ice melt results in higher amplitude wave formation in the Jet Stream. Higher amplitude wave formation in the Jet Stream transports more warmth to the Arctic environment, resulting in more sea ice and snow melt which in turn weakens the Jet Stream further. A longer-term amplifying feedback of Arctic carbon release may also be in play (hinted at by an overburden of both CO2 and methane in the local Arctic atmosphere), which would also contribute to the conditions we now observe.
A final feedback, this one somewhat negative, occurs as a result of Greenland Ice Sheet (GIS) melt. Large cold, freshwater outflows from GIS into the North Atlantic result in localized cooling in that region. This feedback (also related to AMO weakening) enhances trough formation throughout the North Atlantic region adjacent to Greenland and the Canadian Archipelago. A final potential teleconnection to the ridges we see forming over both Yamal and the Alaska/Northwest Territory zone.
Links:
Rapid Arctic Sea Ice Loss Linked to Extreme Weather
Tracking for Early Season Melt Pond Formation at The Arctic Ice Blog
Share this:

Posted by robertscribbler on June 2, 2015
https://robertscribbler.wordpress.com/2015/06/02/arctic-heatwave-forecast-to-crush-northern-hemisphere-snow-cover-this-week/
Jet Stream So Weak Winds Are Running From Pacific to Atlantic Across the North Pole

(Winds flowing north from just west of Hawaii, through the Bering Strait, over the North Pole and on into the North Atlantic as seen by NOAA’s GFS model and imaged by Earth Nullschool.)
This is a very odd pattern for global surface winds.
In the central Pacific, along a band above 20 North Latitude and about 500 miles west of Hawaii, a broad stream of easterly winds yesterday took a turn toward the north. The wind field was then pulled into a long frontal boundary spinning out from a large low pressure system off Irkutsk, Russian and driven on toward the Western Aleutian Island Chain.
The winds continued their sprint northward through the Bering Strait before being again captured by a low, this time over the East Siberian Sea. Sped on by this second nudge, the winds, running at 15-25 mph, spilled over the North Pole and into a third low spinning just north of Svalbard. This system shoved the winds southward over the North Atlantic and finally into a cyclone just north of England where the winds finally turned eastward, returning to the prevailing west-east global flow.
This is an epic journey in defiance of typical and prevailing weather patterns spanning thousands of miles and three oceans. It is decidedly not normal.
A Ruptured Jet Stream and A Flood of Winds Across the Pole
Typically, cold air over the polar region will insulate the Arctic from these kinds of circumpolar flows. The cold air to the north, warm air to the south, drives winds faster around the pole, creating a kind of wind wall that keeps south-north flows out of the Arctic. It is a pattern that tends to isolate Arctic air from the rest of the global air circulation to the south.
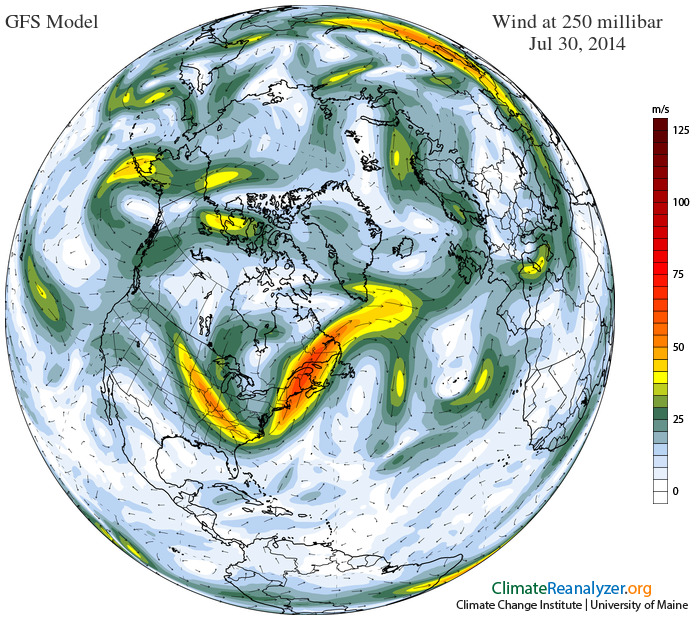
(Mostly disassociated Jet Stream with large rupture running north through the Bering Strait and on over the polar zone. Image source: University of Maine.)
But, during recent years, temperatures in the far north have been rapidly rising by in some cases as much as 0.5 to 1.0 degrees Celsius per decade. This heating of the polar zone, together with land and sea ice loss, has resulted in a weakening of the circumpolar wind pattern called the Jet Stream. This weakening has collapsed the wall keeping southerly winds from rushing over the Arctic as we see today.
The current pattern involves an extreme weakness and high amplitude wave in the Jet Stream extending from the Central Pacific and into the Arctic, extending well above the 80 degree North Latitude line. What remains of the cold air pool has been split, with some of the cold air mass shoved toward Greenland and the Canadian Archipelago and the remainder shoved toward the Kara Sea. Driving through it all is a wedge of warmer air accompanied with the southerly winds, winds that originated in the tropics near Hawaii.
Links:
Share this:

Posted by robertscribbler on July 30, 2014
https://robertscribbler.wordpress.com/2014/07/30/jet-stream-so-weak-winds-are-running-from-pacific-to-atlantic-across-the-north-pole/
Song of Flood and Fire Refrain: Epic Canadian Floods Wreck 5.5 Million Acres of Cropland
For the Northwest Territory of Canada, the story this summer has been one of record-setting wildfires. Fires casting away smoke plumes the size of thunderstorms, fires that burn regions of tundra the size of small states. Fires that just burn and burn and burn for weeks on end.
But to the south and east in Saskatchewan and Manitoba, the story is drastically different. For over the past month, unprecedented flooding in this region has wrecked untold damage to Canada’s farmlands.
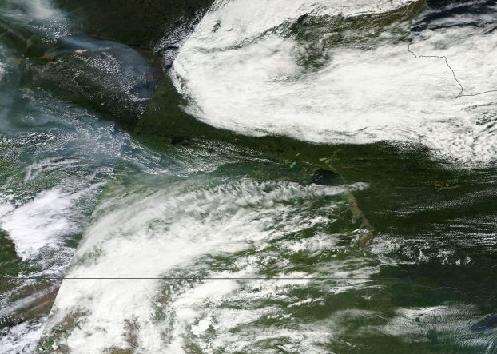
(Powerful storms over Manitoba and Saskatchewan on July 23rd, 2014. Image source: LANCE-MODIS)
This situation is the result of an odd and wreckage-inducing tangle in the Jet Stream. For hot air has been funneling up over the Northwest Territory for the better part of two months now, pushing temperatures in this Arctic region into an unprecedented range topping the 70s, 80s, and even 90s on some days. This high amplitude ridge in the Jet Stream has been reinforced and locked in place, a result some scientists attribute to the loss of Arctic sea ice during recent years, setting up a hot weather pattern favorable to wildfires.
As the massive Arctic wildfires ignited and burned, they cast off giant streams of smoke, burdening the down-wind atmosphere with aerosol particles — an abundance of condensation nuclei for cloud formation. These smoke streams fell into a trough flowing down over Manitoba and Saskatchewan. The deep trough, often extending far into the Central US formed a kind of trap for storms and, like the fixed ridge over the Northwest Territory, it has remained in place for months on end.
Given this mangled positioning of atmospheric heat and moisture flows, it was only a matter of time before massive rainstorms erupted in the wake of the large-scale Canadian fires. And the result was an unprecedented flooding. The offspring of an unprecedentedly powerful and persistent atmospheric pattern set off by human warming.
Major Floods Wreck Canadian Crops
For some local farmers, the past couple of days have seen 48 hour rain totals in excess of 10 inches. A 100 year rain event at a scale few farmers in the region have ever seen. And the recent floods are just the latest in a series of heavy rainfalls that have been ongoing ever since early July. Flood follows flood follows flood. A progression that has left most farms swimming in inches to feet of water and mud.
In total, farmland encompassing 3 million acres in Saskatchewan and 2.5 million acres in Manitoba are now under water and are unlikely to produce any crops this year. As a result, wheat plantings are expected to decline by 9.8 percent from last year, canola is expected to decline by 5.8 percent from the June forecast, and oat is expected to decline by 6 percent, according to estimates from Bloomberg.
July flooding in these regions has so far resulted in over 1 billion dollars in damages to farmers. As much as half of these losses may not be covered as insurers are still reeling from severe moisture damages during 2011, just two years ago. As a result of the ongoing parade of storm casualties, insurers have also raised deductibles, leaving farmers more vulnerable to the odd and powerful new weather coming down the pipe.
The Part Played By Climate Change and a Mangled Jet Stream
We often hear of the expanding droughts of human-caused climate change wrecking croplands. But the upshot of expanding drought in one region is record downpours in another. And downpours, if they are intense enough, can have a negative impact on crops as well.
The cause of this is as simple as warming’s enhanced ability to evaporate water. For it is estimated by climate scientists that each degree C in temperature increase amplifies the global hydrological cycle by 7-8 percent. That means that current warming of about 0.8 C since the 1880s has resulted in about a 6% increase in both evaporation and precipitation. At the level of weather, this translates into more intense droughts under dry, hot weather, and more intense rainfall events under wetter, cooler weather.

(High amplitude Jet Stream wave pattern fueling wildfires in the Northwest Territory and record floods in Manitoba and Saskatchewan. Note the extreme northward projection of the Jet over the Northwest Territory and the strong, deep, trough back-flowing from Hudson Bay into Manitoba, Saskatchewan and the northern tier of the Central US. Image source: University of Maine.)
One mechanism that has tended to amplify drought and rain events during recent years has been a weakening and intensifying waviness of the Northern Hemisphere Jet Stream. This weakening has been attributed by some scientists to a large-scale recession of Arctic snow cover and sea ice. For since 2007, not one day has seen an average sea ice extent and the range has typically fallen into a zone between 20-50 percent below levels seen during the 1970s and 1980s. New major record low years in 2007 and 2012 have also fueled speculation that sea ice may completely melt away during one summer between now and 2030, 2025, or even 2020 — 50-100 years ahead of model predictions.
As the sea ice serves as a haven for cold air masses, its loss is bound to impact the resiliency of these systems and since a solid pool of cold air to the north is a major driver of Northern Hemisphere upper air currents, the weakening of this cold pool has had dramatic impacts on climates.

(Extreme dipole hot/cold pattern associated with Jet Stream mangled by climate change. Image is for July 14, a match to the above Jet Stream shot. Note the extreme heat in the ridge and the much cooler air in the trough. This is exactly the kind of pattern we would associate with sea ice retreat and Jet Stream weakening. Image source: University of Maine)
For this year, the ridge over Canada’s Northwest territory was a direct upshot in a northward retreat of the Jet Stream over Canada and, at times, into the Arctic Ocean. This set the stage for severe wildfires in the zone of warmth underneath this ridge pattern. To the east, a powerful downsloping trough pulled cooler air into Saskatchewan and Manitoba as well as over the Central and Eastern US. This set the pattern up for cooler than average conditions as well as for strong rainstorms.
The crop-shattering events of July were a direct result of this climate change induced ‘Song of Flood and Fire.’ A pattern we’ve seen repeat again and again over the past few years and one that may well intensify as both time and human-caused warming advance.
Links:
Canada’s Record Rains Cut Wheat Averages to Three Year Low
Is Global Warming Causing Extreme Weather via Jet Stream Waves?
Hat-tip to Colorado Bob
Share this:

Posted by robertscribbler on July 24, 2014
https://robertscribbler.wordpress.com/2014/07/24/song-of-flood-and-fire-refrain-epic-canadian-floods-wreck-5-5-million-acres-of-canadian-cropland/
World Food Security in the Cross Hairs of Human-Caused Climate Change: Mangled Jet Stream, Ocean Heat and Melting Sea Ice To Deliver 500 Year Drought to California? Brazil, Turkey, Australia and More to Follow?


(California Snow Pack for January 18 2013 vs the California Snow Pack for January 18 2014. Note the near-zero snow cover for this drought-impacted region. Image source: NASA/Lance-Modis)
“We are on track for having the worst drought in 500 years.” — B. Lynn Ingram, professor of earth and planetary sciences at the University of California, Berkeley.
Remember the historic drought that swept the US in 2011-2013? It was the worse drought in 50 years for some areas. Thankfully, the blocking pattern, excess heat and evaporation that set off this drought and that almost ran the Mississippi River dry abated and lessened, shifting westward and, instead delivered wave after wave of wet and stormy weather to the Eastern US.
Not so with the American West. There the high amplitude Jet Stream pattern remained, keeping regions locked in warm, dry conditions throughout the winter of 2012-2013, on through the end of 2013 and into the early months of 2014.
Looking further back, it was not just these years that had delivered dry weather to the US West Coast. California, ground zero for the current climate change related emergency, has endured dry, hot weather ever since the Pacific Decadal Oscillation (PDO) went negative ten years ago suffering drought years with almost bi-annual frequency.
Now, as Dr. Ingram notes above, California is currently ramping up to its worst drought in 500 years.
A long emergency for California
We only have to scratch the surface for the symptoms of systemic climate crisis in California to crop up. California water authorities failed to honor contracts for the first time in 54 years. Sacramento, as of December was experiencing its worst drought in 130 years even as conditions continued to worsen through January and February.
According to the New York Times, as of February 1rst, 40,000 people were at risk of losing access to water within the next 60 to 120 days. And State officials warned that this number was likely to rapidly rise as The State Water Project announced on January 31rst that it did not have enough water to supplement the fading supplies of local providers to a total of 25 million customers. Meanwhile, State emergency planners were laying out contingencies that included shipping water over land by truck to parched communities.
The drought is also having a devastating impact on local farmers with about 1/3 of California’s farmland expected to lay fallow, at least 25,000 farm laborers expected to be laid off work, and agricultural businesses expecting losses to mount into the tens of millions of dollars. Already, livestock owners in both New Mexico and California, unable to support their animals, have been forced to sell, as fields that used to support four foot high grass are brown and cracked.
Tim Quinn, executive director of the Association of California Water Agencies noted:
“I have experienced a really long career in this area, and my worry meter has never been this high. We are talking historical drought conditions, no supplies of water in many parts of the state. My industry’s job is to try to make sure that these kind of things never happen. And they are happening.”
Climate change, climate change, and climate change
Far flung and dynamic changes to the Earth System appear to have resulted in a variety of factors that have amplified the California drought. First, increasing global temperatures have amped up the rate at which water evaporates into the atmosphere by about 6%, this increased rate of evaporation results in more extreme conditions when heat and dryness do occur. So a drought that may last a year is likely to be even more intense, due to enhanced evaporation, than a comparable drought that occurred 50 or 100 years ago.
In addition, loss of sea ice, snow, and permafrost plays a key roll in re-shaping the Jet Stream. According to Dr. Jennifer Francis and other polar researchers, receding sea ice cover is likely to result in more powerful and long-lasting Rossby Wave type blocking patterns. This happens as more heat becomes concentrated in the polar regions, causing the Jet Stream to meander in great swoops and whirls. These large waves can become fixed into blocking patterns for extended periods. In the up-slope of these waves, warmth and heat predominate. In the trough or down-slope, stormy, wet and cool conditions prevail.
And just such a blocking pattern has dominated the US West Coast for 11 months running. The result is extraordinarily intense dryness, even during the rainy season of November through March.

(Image source: PNAS)
Sadly, according to climate models, we can expect this kind of dryness to intensify over the US Southwest as human caused global warming grows more extreme. A report conducted by PNAS in 2010 and authored by Seager and Vecchi confirmed other model findings that the US Southwest would continue to dry as the climate warmed — the upshot being that the wet season for the West would eventually evaporate.
Above, the PNAS drought model shows evaporation beginning to increase during the first two decades of the 21rst Century. Then, by about decade 2, precipitation rates rapidly fall and evaporation rates gradually rise through to 2100. The red line shows the compounding effects of evaporation increase and precipitation decrease over 24 separate climate model essays.

(Rossby Wave over West Coast Weakens. Image source: University of Washington)
It is worth noting that on a positive, and slightly hopeful, note, the current blocking pattern over the US West Coast and related Pacific Ocean waters has weakened somewhat. This should allow some moisture to flow into the parched west over the coming days and weeks. And, in the forecast, we do see a proper storm or two emerging from this new pattern. Unfortunately, we’d typically expect about 20-30 storms of this kind during a typical winter season and with March bringing in the end to this year’s rainy season, along with the northward retreat of the moisture flow, it appears likely that California will have to endure at least another 6 months of dry conditions before seeing any hope of major storms returning next fall/winter. A remote potential to say the least given both long-term trends and current conditions.
‘Like a microwave on full blast drying the Earth:’ drought, drought, and more drought
“The extra heat from the increase in heat trapping gases in the atmosphere over six months is equivalent to running a small microwave oven at full power for about half an hour over every square foot of the land under the drought. No wonder wild fires have increased! So climate change undoubtedly affects the intensity and duration of drought, and it has consequences.”
Under such conditions, we would expect both drought and wildfires to proliferate. And, in fact, this is exactly what we are seeing. As major wildfires impacted both California and Arctic Norway during winter time, Brazil, Turkey, China, Argentina and Australia were also all experiencing some of their worst or most intense droughts on record.
In Brazil, the least rain in two decades is spurring a cattle sell-off that would be very familiar to livestock farmers in California and New Mexico. The expected summer rains did not come and Brazil, a heavily meat-dependent nation was left with soaring food prices after the sell-off as stocks first surged, then plummeted. The epic drought for this region is also causing a number of other impact such as coffee shortages and a related reduction in hydro power as rivers run dry.
Nearby Argentina also saw severe drought-related shocks in recent months as a December drought inflicted serious harm upon Argentina’s corn crop. In a typical year, Argentina produces about 32 million tons of corn. But this year’s drought is estimated to have wiped out about between 7 and 14 million tons of the crop. Argentina is the third largest producer of corn and with the US revising estimates down for its 2013-2014 crop, supplies of the grain are being drawn ever-lower. Though very intense, the December drought had abated by mid-January, providing a respite for other crops such as soybeans.
In Turkey, Lake Sapanca, which provides water for hundreds of adjacent farms, was within a half meter of ‘dying’ as a combination of drought and water drilling had pushed the lake to its limits. Local farmers have, for decades, drilled the land to provide irrigation water for farms and livestock. Now, the drilling is sapping the lake bed. A period of drought had, as of late January, left the lake in such a state that local officials were claiming the lake would be dead after another half-meter fall. The lake which is nourished both by springs and ground water has been deprived of flows both by human climate change induced drought and by human drilling into the lake’s spring-bed.
In Australia, drought conditions are now worse for some locations than at any time since 2003, a tall order since the 2003 to 2009 drought was Australia’s worst in 1,000 years. For Sydney, that means the lowest rainfall totals in more than 70 years. This particular drought hit both hard and fast with Australia seeing normal conditions before Christmas, but after, very intense heat and dryness resulted in a rapid scorching of farmlands, crops, and grazing fields. The dire drought situation has resulted in government relief funds being released to affected farmers. NSW Minister for Primary Industries, Katrina Hodgkinson noted to the Sydney Morning Herald:
“Seasonal conditions are now deteriorating at a rapid rate across a large portion of NSW and both the severity and speed at which this drought is moving is astonishing. Primary producers in some parts of NSW have simply not had the opportunity to prepare for another severe downturn in seasonal conditions so quickly after the Millennium drought broke.”
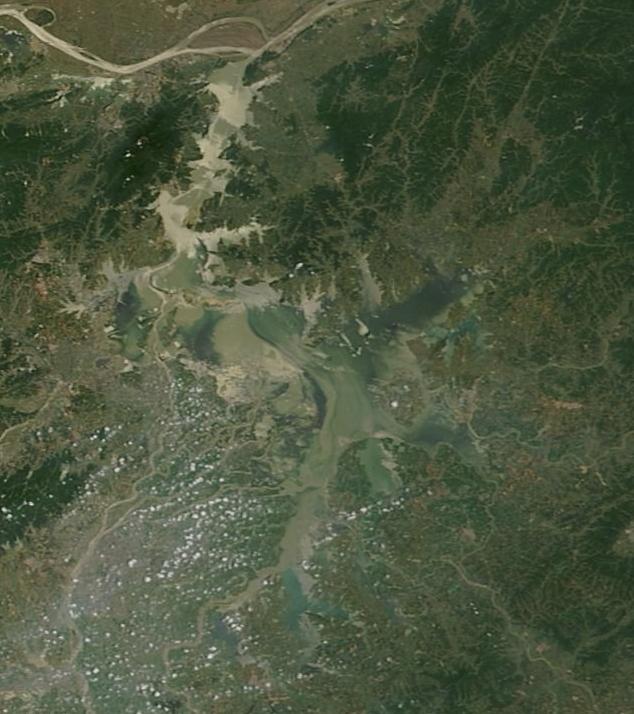

(A mostly full Lake Poyang as seen from Satellite on the left during May of 2012. A parched and almost completely dry lake Poyang as seen from Satellite during January of 2014. Image source: NASA/Lance-Modis.)
And, in China, the largest lake for that populous nation has now dried up. Poyang, a massive lake usually spanning 3,500 square miles has been turned into a sprawling field of earth parched and cracked by a combination of drought and water diversions resulting from the construction of the Three Gorges Dam. According to reports from The Guardian and Chinese News Sources, a drought stretching from 2012-2014 in the region of Poyang is now the worst in at least 60 years leaving lake refill almost non existent as upstream river flows to the lake were periodically cut off by water storage operations at the Three Gorges Dam. The result was an extreme lowering of lake levels and dry bed conditions that have driven farmers and fishermen in the region out of business.
Implications for world food security
Major droughts during 2011-2012 impacted many of the world’s primary agricultural basins, resulting in forward food supply dropping to as low as 72 days. Since that time, food supplies have slightly recovered but are well below previous levels last seen in the 1990s at 104 days. Food insecurity and failure to distribute food to the malnourished remains a priority at international agencies like the UN which has identified numerous countries including Cameroon, the Central African Republic, Somalia, Syria, Mali, Sudan and Nigeria, among others, as extreme risks for hunger and famine. Relief agencies have allocated billions of dollars to address this problem but the UN continues to identify climate change as a major threat to global food security with the potential to wipe out all previous progress moving forward.
The droughts in California, Turkey, Australia, China, Argentina and Brazil so far for 2014 put the world at risk for another bout of food insecurity later this year should major weather and climate related crop disruptions emerge in other primary food producers such as the bread baskets of the US, Russia, and Europe (The US, Brazil, China, Russia, and Europe are top food producers). It is worth noting that, in large part due to the ongoing southwestern drought, the US has revised a number of its crop projections downward for end 2014.
With polar amplification playing havoc with the Northern Hemisphere’s weather systems, with Australia sitting in a pool of expanding warm Pacific Ocean water that makes drought more likely there, and with the Eastern Pacific edging closer to La Nina, conditions warrant a continued monitoring of both weather and the state of world food supplies. The added global heat engine also impacts soils and crop growth in ways to which we are currently unaccustomed, resulting in more extreme instances of flash drought as well as flash flood. In this respect, the examples of Australia and Argentina are of particular concern.
Though global crisis has not yet returned, it lurks at the edges as drought, extreme weather and over-use of ground water supplies continues to threaten a wide swath of productive zones. So, at this point, the situation is one best described as tenuous with ongoing regional impacts over the Sahel region of Africa and in other sporadically vulnerable locales.
Links:
Share this:

Posted by robertscribbler on February 6, 2014
https://robertscribbler.wordpress.com/2014/02/06/world-food-security-in-the-cross-hairs-of-human-caused-climate-change-mangled-jet-stream-ocean-heat-and-melting-sea-ice-to-deliver-500-year-drought-to-california-brazil-turkey-australia-and-more/
This is What Human-Caused Climate Change Looks Like: Arctic to Warm, West Coast to Bake, Polar Vortex to Collapse and Flood Eastern US With Arctic Air
Well, the forecast is in. And it appears we are about to receive yet another helping of winter weather extremes driven by human caused climate change.
ECMWF and NOAA models both show mid and upper level warmth increasing over the polar region. This warmth, over the next week, will invade toward the surface, collapsing the polar vortex and driving Arctic cold into both Siberia and North America. In the image below, you can see that mid level cold is cut in half by warmth flooding into the polar zone resulting in both the polar vortex collapse and ejection toward southern latitudes all while severely malforming the circumpolar Jet Stream.

(ECMWF 850 hPa temperature and pressure gradient for the Northern Hemisphere. Image source ECMWF)
Note that mid level atmospheric temperatures are about the same over the Central Arctic as they are over Central Europe, a much lower latitude. Also note how the polar cold, typically centered over the Arctic is driven away and further south into two distinct zones — one over Siberia, the other over North America. Already, observations in the high Arctic show temperatures as much as 30 degrees F above average for this time of year and such anomalies are projected to expand as this second vortex collapse of the season progresses.
This new temperature flux will make the fixed Rossby wave ridge and trough pattern very intense, forming high velocity upper level wind flows over much of the US. To the north, the Jet will invade Alaska. To the south, it will dig deep into the Gulf of Mexico, bringing cold Arctic air into direct contact with moist, warm tropical air. The result may well be a spectacular and dangerous series of winter storms over the next two weeks for the Central and Eastern US.
So you may wish to stay abreast of local weather reports as this most recent collapse series could pack quite a punch while spawning a variety of very extreme weather conditions.

(ECMWF upper level wind flow over the US for January 22. Note the deep low over southeastern Canada and the powerful associated Jet Stream flow riding along the U shaped trough in the current blocking pattern.)
The vortex disruption, collapse, and flushing of cold air out of the Arctic and further south is forecast to result in a strong cold snap for the Eastern and Central US. Negative anomalies are projected to reach as low as -47 degrees F below average in some locations near the Great Lakes. According to these forecasts the cold may be about as strong but last a bit longer than the previous cold snap spurred by the early January polar vortex collapse.
Meanwhile, strong positive temperature anomalies up to +26 F are expected to dominate the US southwest, a region already suffering some of its driest conditions in a century. Such record warmth is likely to further exacerbate what has come to be a freakish and anomalous period of winter wildfires in the most drought stricken zones along the US West Coast.

(ECMWF temperature forecast for January 23, 2014. Note the vertical line of temperature anomalies almost perfectly bisecting the North American Continent.)
This kind of extreme weather pattern almost perfectly models predictions by prominent polar researchers like Dr. Jennifer Francis, who projected increasingly anomalous Jet Stream patterns, blocking patterns, meandering, and cut off flows due to the massive Arctic melt having occurred since 1979. The retreat of snow and ice, both on land and at sea, results in more warm air invasions into the high Arctic and can directly spur just the kind of weather disruption predicted in the forecast above.
In the trough zones, periodic and powerful cold snaps are far more likely as the polar vortex collapses and cold, Arctic air is flushed south. In these troughs, storms are more frequent and powerful, amped up by the extreme temperature differences and by higher atmospheric moisture content due to overall warming. In the ridge zones, anomalous warmth, drought, and fires are experienced as the over-riding warm, dry air floods up through these regions and into the Arctic.
This is exactly the kind of dynamic we would expect from a warming world. From a world experiencing a powerful amplification of warmth in the northern polar zone. Such a pattern will likely continue to intensify until it is disrupted by large melt outflows from Greenland and from Baffin Island.
Links:
Premiering Next Week: Revenge of the Polar Vortex
Cold Snap for the US? It’s the Collapsing Polar Vortex, Stupid
Sea Ice Loss Locks Jet Stream into Severe Winter Storm Pattern for Most of US
The Polar Vortex is Probably Coming Back
Mangled Jet Stream Sparks Drought, Winter Wildfires…
Share this:

Posted by robertscribbler on January 17, 2014
https://robertscribbler.wordpress.com/2014/01/17/this-is-what-human-caused-climate-change-looks-like-arctic-to-warm-west-coast-to-bake-polar-vortex-to-collapse-and-flood-eastern-us-with-arctic-air/
Winter 2013-2014: Sea Ice Loss Locks Jet Stream into Severe Winter Storm Pattern For Most of US
It happened to Europe last year. A persistent erosion of Arctic sea ice set off changes to the polar jet stream that locked in place a severe winter weather pattern that pummeled the central and western European countries for much of the winter. Storm after storm piled snow high in locations that typically saw only modest winter precipitation while other areas were simply buried. The US also took a glancing blow from this extreme storm configuration. But now, with a large trough in the polar Jet remaining locked in place for almost a year, the US from the Rockies eastward appears to be in the line of fire for some very severe winter weather.
In other regions from Alaska to Eastern Europe, record or near record warmth and dryness have settled in with a large swath of eastern Europe showing average temperatures more than 6 degrees Celsius above the seasonal average. Over the extreme northern Pacific, adjacent to Alaska and the Bering Sea, seasonal temperature range from 4-12 degrees Celsius above average. And it is this extreme northward invasion of warm air that is displacing polar and Arctic air masses toward the east and south, putting much of the US in the firing line for strange and severe winter weather.
Just this week, the tale was one of record ice storms throughout the central and eastern US with hundreds of flights cancelled, deadly traffic pile-ups, and holiday shopping disrupted. On the east coast, from Virginia to Maine, workers and shoppers alike were treated to three days straight of snow turning to sleet and freezing rain and then turning back again to snow. With storms like these hitting in early December and with the pattern in the Jet Stream taking on such an extreme configuration, it appears possible that the winter of 2013-2014 could be a very, very stormy one indeed.
A Tale of Jet Streams and Melting Sea Ice
To understand how human caused global warming can make winter storms more severe in some areas while other areas hardly experience winter at all, one should first take a look at two major governors of Northern Hemisphere weather: the circumpolar Jet Stream and Arctic sea ice.
An extreme difference between the temperatures at high northern latitudes and at more temperate latitudes has driven a very rapid flow of upper level air called the Jet Stream for almost all of human meteorological reckoning. This high temperature difference drove powerful upper level winds from west to east. These winds tended to modulate only slightly and when they did, powerful weather events tended to occur.
Locking a greater portion of this cold air in place was the northern hemisphere ice cap, most of which was composed of a large swath of sea ice covering much of the northern oceans. This high volume of cold, reflective ice kept temperatures up north very, very low and provided the massive temperature differences which kept the Jet Stream predominantly flat with only occasional and more moderate severe weather causing ripples and bulges.
But since 1979, massive volumes of sea ice have been lost due to an immense and ongoing human caused warming trend taking hold in the Arctic. As human greenhouse gas emissions sky-rocketed, Arctic temperatures rapidly increased far faster than the global average. By this year, human greenhouse gas emissions had driven CO2 levels to the highest seen in more than 3 million years while Arctic temperatures are now warmer than at any time in the past 150,000 years. Sea ice retreat has been equally unprecedented with average winter values now 15-20% below extent measures seen during 1979 and with end summer sea ice extent values now a stunning 35-50% below that of 1979. Sea ice volume, the measure of total ice including its thickness, has shown even more stunning losses since 1979 with seasonal winter values 30-35% lower than in 1979 and end summer values between 65 and 80% lower during recent years.

(Sea ice extent measure composed by JAXA. The light gray dotted line on the top shows sea ice extent averages during the 1980s. The three record lowest years — 2007, 2011 and 2012 — are shown in green, blue, and orange. The most recent year, 2013, is shown in red. Note the persistent and rapid melt trend.)
The loss of hundreds of thousands of square kilometers of sea ice radically reduces the Arctic Ocean’s ability to keep the Arctic cold. To the contrary, we see larger areas of open water that, in turn, radiate ocean heat into the atmosphere throughout winter. As a result the temperature difference between the Arctic and temperate regions is less and this, in turn, slows down the Jet Stream.
When the Jet Stream slows, it tends to meander. And when it meanders it creates very deep troughs and very large ridges. In the ridges, we get unseasonably hot temperatures along with increased risk of drought. And in the troughs, Arctic air swoops down to collide with warmer, moist air in a series of powerful storms. During the summer time, the hot, dry zones can bring deadly heat waves, record droughts, and major wildfires while the cooler stormier zones can bring epic rainfall events or even link up with tropical cyclones to result in highly severe hybrid storms. During the winter time, the hot zones can almost completely obliterate the winter season, while the stormy cooler zones can result in snow storm after snow storm.
Don’t believe me? Then take a look at what weather experts Jeff Masters and Jennifer Francis have to say on the matter:
Polar Warmth and Rossby Wave Pattern Going into Winter 2013-2014
As noted above, a powerful and continuous ridge in the Jet Stream over the north eastern Pacific near Alaska has persistently provided an equally powerful down-sloping trough over much of the US over the past year. The December 10 Jet Stream configuration map shows this pattern remaining locked in place:

(Image source: California Regional Weather Server)
Note the strong multi-channel ridge to the south of Alaska and to the west of Canada diving down into a deep trough with convergent upper level air flows over the central and eastern US.
On the map, we also see powerful ridges and correlating warmer regions over Europe, Central Asia, and the western Pacific. These large meanders are now typical to the highly weakened Jet Stream pattern we have seen in recent years due to loss of polar sea ice.
Global temperature maps also show anomalously warm temperature departures for much of the Arctic as well as for regions beneath these powerful jet stream ridges. Note that the only northern hemisphere region showing strong anomalously cool conditions is a large swath adjacent to the large trough over North America and southern Greenland.

(Global Temperature Averages and Anomalies vs 1981-2010 mean. Image source: NOAA)
Temperature averages in the Arctic region of Kamchatka, the Bering Sea, the Chukchi Sea and Alaska have ranged between 11- and 12 degrees Celsius above average for the first week of December with much of the Arctic showing 4-12 degrees Celsius above average readings. The US and southern Canada, conversely, have shown temperatures 4-10 degress Celsius below average. It is also worth noting the massive swath of 3-12 C above average temperatures stretching all the way from the Middle East to the west coast of Greenland.
Overall, the prevalence of high latitude warmth and a continued high amplitude Rossby wave pattern trough over much of the US is a very conducive pattern for severe winter weather over the coming weeks. Most likely, this pattern will continue to persist through at least early to mid winter. So for the US and especially from the Rockies to the east coast, a progression of strong storms is likely to continue as winter advances.
Links:
California Regional Weather Server
Supporting Research:
Evidence linking Arctic amplification to extreme weather in mid-latitudes
Impact of sea ice cover changes on Northern Hemisphere atmospheric winter circulation
Impact of declining sea ice on winter snowfall cover
Weather extremes provoked by trapping giant waves in the atmosphere
Quasi-resonant amplification of planetary waves and recent Northern Hemisphere weather extremes.
Share this:

Posted by robertscribbler on December 10, 2013
https://robertscribbler.wordpress.com/2013/12/10/winter-2013-2014-sea-ice-loss-locks-jet-stream-into-severe-winter-storm-pattern-for-most-of-us/
Drought, Burning Rings of Fire out West, Severe Flooding in the East: How Climate Change and a Mangled Jet Stream Wrecked US Weather
Earlier this summer, I had a weather conversation with my mother. She was excited about a new business venture my sister had undertaken (Adventure Kayaks) and for an upcoming trip to Yosemite in August to celebrate her and my father’s 45th wedding anniversary. She wondered about the weather, hoping it would be a good summer for both the new business and the trip. Without thinking too much, I said:
‘Rain, cooler weather, and storms in the east, drought, heat and fires in the west.’
Immediately after saying this, I felt reticent. Perhaps I shouldn’t have spoken? Maybe I would scare my mom. What good would it do to ruin her enjoyment or her looking forward to both the trip and to my sister’s potential success?
It’s worth noting that, thankfully, the storms and cooler weather that did emerge with fury and flood in the east did not ruin my sister’s kayaking venture (although it did result in numerous interruptions both during spring and throughout summer). Should a tropical storm or hurricane make landfall on the US east coast this August, September or October, however, the devastation could be vast, perhaps exceeding a 1 billion dollar disaster event (more on this below).
But as my mother boarded her plane to California and a potential date with Yosemite yesterday morning, these were the satellite images I was looking at:

Yosemite Fire NASA Earth Observatory
Image source: Earth Observatory
The vast Rim fire that had grown to consume over 192,000 acres as of today was steadily devouring the western border of Yosemite. You can see it on the above infrared satellite picture provided by NASA as a ring of bright white steadily inching into the indicated yellow border of Yosemite.
Jennifer Francis, Stu Ostro and How I Knew
Earlier this summer, my mother chided me on my ‘attempts to predict the weather.’ In a phone conversation last night, she asked ‘how did you know?’
It’s fair to say that in the overall prediction of more storms and rains in the US east, with more risk of flooding, and more heat and dryness out west, with more risks of fire, that I wasn’t entirely certain. However, I’d recently read the work of climatologist Jennifer Francis and had been listening to and following the statements of Stu Ostro. During early spring and summer, I observed a Jet Stream pattern setting up over the US that appeared to be settling into a ‘stuck position’ that would result in the high likelihood of the conditions I communicated with my mother. It’s worth noting that in looking at these Jet Stream patterns it’s not difficult to make such predictions because the patterns change slowly, they lumber and tend to remain stuck for long periods. Once a pattern settles into place, it’s a good bet that it will stick around for at least a few months these days, a fact that the models nail but which meteorologists, in general, have failed to communicate. In short, this is a climate change driven change in the weather.
In fact, some meteorologists and climatologists seem entirely reticent to accept this new weather pattern, despite the fact that it is a powerful tool for weather prediction and will tend to result in less surprises. The big troughs equal record floods sticking around for a long time and the big ridges equal record heat, drought, and probably fires sticking around for long periods of time.
In an example of this reticence, a recent paper by a University of Colorado researcher concluded that Jennifer Francis did not have enough evidence to support her claims of an observed slowing in the Jet Stream. Unfortunately, the paper included, as a part of its findings, a cross section of the atmosphere in which the Jet Stream does not typically reside even while the paper included a sample during which changes were already occurring, which would have likely biased its results. Despite these biases and errors, where the paper actually did measure Jet Stream flows, it corroborated Francis, showing Jet Stream slowing during the periods measured. This is odd considering the fact that the concluding statement contradicts the papers own findings, a point which Dr. Francis, herself, provides.
It’s easy to understand why reticence still lives in the science. As I noted above, it’s understandable to feel reticent when being the bearer of bad news. No one wants to be the messenger that gets metaphorically ‘killed.’ But without making use of the clear understanding provided by Francis and Ostro, we will continue to be surprised by extreme floods, storms, fires, heatwaves and droughts that can be easily predicted by simply looking at how the Jet Stream sets up and where it gets stuck. Instead, ‘surprise’ after ‘surprise’ just keeps coming our way.
When Rossby Waves Get Stuck: Changing to a More Radical Jet Stream
Dr. Jennifer Francis has observed that loss of sea ice and snow cover in the Northern Hemisphere has resulted in a slowing of the Jet Stream in recent years. Sea ice volume, the measure of total ice in the Arctic Ocean, since 1979 had declined by as much as 80% when measured at its low during 2012 (this measure may rally back to around 75 to 78 percent lower than 1979 this year, but the overall trend remains a death spiral). Greenland melt is unprecedented at 500 gigatons per year and with Arctic heatwaves blasting the tundra both permafrost and snow cover are at record and near record lows. 80 to 90 degree temperatures now often advance to the shores of the Arctic Ocean, with the coldest air pushed back above the 80 degree north latitude line, confining it to a shrinking region that, increasingly, huddles closer to the remaining large ice sheets in Greenland. Overall rates of warming for much of the Arctic are about .5 degrees C temperature increase each decade, more than twice the global average.
A more quickly warming Arctic results in changes to the atmosphere’s heat balance. According to Francis, the height of the atmosphere over the Arctic is rising relative to atmospheric heights in the lower lattitudes, this loss of slope results in lower gradients from north to south and since temperature, atmospheric height and pressure gradient drive Jet Stream speed, the Jet Stream slows down. And as the Jet Stream slows, it tends to seek out the highest gradients it can find. The result is more northward invasions of the polar region of the Jet Stream ridges and more southward invasion of the Jet Stream troughs. This amplification creates a rather large and elongated sine wave called a Rossby wave pattern.

Jet Stream Pattern Change. Image source: NOAA.
In the sequence above, we see the progression of a flat Jet Stream to a Rossby wave ridge/trough configuration to, eventually, cut off lows and highs. In the past, such waves tended to set up for briefer periods, extending for days or weeks before returning to the usual, more flattened motion of the Jet. In more recent years, large Rossby type waves have been the typical pattern, one that transitions to cut off lows before it returns to a configuration more similar to (b) in the diagram, before setting up as a Rossby-type wave again.
Perhaps more importantly, this b, c, d progression has tended to occur again and again and again over the same geographical region for months and months on end. And, looking back at Jet Stream maps over the past months, this is exactly what we find.
Below is a progression of images I’m providing from this blog’s archive. It includes either direct temperature measures that indicate Jet Stream patterns or a mapping of air flow speed indicating the Jet Stream’s path.

Clover leaf Jet Stream Pattern April, 2013.
(Image source: ECMWF)
In ‘For Central US, Climate Change and a Mangled Jet Stream Means Drought Follows Flood Follows Drought’ I described how the Jet Stream pattern had consistently switched from large trough to large ridge configurations over the past few years bringing either heatwaves and droughts or storms and floods. But the left hand portion of the image provides a good record of the Jet Stream configuration as of mid April this year. Following the temperatures, on the west coast we see a large, hot ridge and in the central and eastern US we see a deep, cool and stormy trough.

Wednesday July 3, Rossby wave still in effect over US.
(Image source: ECMWF)
Throughout May and into June, this ridge over west, trough over east, pattern continued. By late June, a massive, record-shattering heatwave had set up over the US southwest. I described this highly anomalous event in ‘Mangled Jet Stream and Global Warming to Shatter Earth’s Highest Recorded Temperature This Week?’
Looking at the ECMWF image above we again see the highly exaggerated ridge/trough dichotomy setting up over the US with very hot, dry conditions out west and cooler, wet and stormy conditions in the east.
At this point, I want to tap Stu Ostro’s own observations to add to the Jennifer Francis mix. What Stu has found is that large, powerful high pressure systems have tended to develop more and more often. These extraordinarily dense systems seem to be exploding to new heights in a thickening atmosphere. Primarily, these monsters are driven by heat and so they tend to live in the massive ridges provided by our new, exaggerated and slowed, Jet Stream pattern. That said, these beasts can spring up almost anywhere there is a massive abundance of heat to tap, as one did over a super-heated region of ocean near Shanghai this summer sparking its own monstrous heat wave.
These large heat domes have major and far reaching effects. To understand them, we must first step back to think about the broader effects of human caused warming before looking at how heat domes manifest in the atmosphere. Based on models of the Earth’s atmosphere, we know that for each 1 degree Celsius of Earth temperature increase we get a corresponding 8% amplification of the hydrological cycle. What this means is that evaporation happens 8% faster and condensation happens 8% faster — OVERALL.
Since 1998, we have observed temperatures that are, on average, .8 degrees Celsius above those seen during the 1880s. What this means is that the hydrological cycle has amplified by 6% over this same time period. Because of this dynamic, droughts are more intense, but rainfall events are also more intense. Yet since the atmosphere is uneven we can expect this 6% amplification to manifest in somewhat more extreme fashion at the locations where more extreme Jet Stream patterns set up.

Mangled Jet Stream Dumps Deluge on US Midwest
(Image source: California Regional Weather Server)
What goes up must come down. And that massive heat dome over the western US and Canada had been baking moisture out of the soil at unprecedented rates over an extended period from April to August. The moisture injected into the heat dome rose and rose, The high pressure system suppressed cloud formation so the moisture had no where to go but up and out. Eventually, this moisture found the edge of the massive high and spilled over into the storms riding along the Jet Stream trough rushing down from the Arctic Ocean and into eastern Canada and the US (hat tip to Colorado Bob).
The result was multiple flood events starting with the Midwest floods of April, then the massive Canadian floods (Calgary) of June, then the Toronto floods, then the Midwest floods of early August, and lastly the east coast floods of mid to late August. The Calgary floods were the worst ever recorded in Canada, the Toronto floods were the worst recorded for that region, and in the Midwest floods of early August, four months worth of rain fell in just one week.

Monthly rainfall estimates August 2013.
(Image source: The Weather Channel)
On 8 August, the time of the second barrage of major Midwest floods this year, we find the Jet Stream in the same elongated configuration with a large northward ridge extending all the way from the southwestern US to the Arctic Ocean and with a deep trough diving back down into the central and eastern United States. As noted above, the mangled Jet Stream delivered its overburden of moisture directly to the US Midwest, dumping four months worth of rain in just one week.
A second pulse of moisture rode far south along this Jet Stream flow to dump massive amounts of rain over the southeastern US about a week after pummeling Missouri. This flow combined with a compromised tropical system to saturate the southeast, with some regions receiving as much as 300 percent their annual rainfall totals by late August.
One of the hardest hit areas is Lake Okeechobee. Water levels there as of mid August hit 16 feet at the Hoover Dike, a level that requires weekly monitoring for cracks or ruptures. The dike stretches over 140 miles along the perimeter of lake Okeechobee and was intended to keep the lake in check during major storms and hurricanes after large outburst events in the early 20th Century resulted in thousands of lives lost. The dike is 25 to 30 feet high and is as wide as a football field. The US Army Corps of Engineers has been working feverishly to shore up the dike in a project that will take years to complete.
At 16.5 feet water level, the dike will require daily monitoring. For each inch of increase above that level, the pressure put on the dike would greatly increase risks of catastrophic failure. The causes of such high water, this year, were neither tropical storms nor hurricanes. Florida has been, thus far, spared the wrath of these strong storms. Deep Jet Stream troughs and a constant Atlantic moisture flow have, instead, resulted in day after day rain events for much of southern Florida, pushing August totals near Lake Okeechobee above 16 inches, filling the massive lake and putting the dikes at risk. Should a hurricane or tropical storm strike Florida during late August, September, or October, the dike could overtop or rupture, unleashing the massive lake on communities sitting beneath it. (Hat tip to Colorado Bob).
As the threat of massive floods continued to increase in the east, the west was erupting with wildfires. Fire containment efforts went into high gear both exhausting the Forest Service Fire budget and briefly pushing the national fire alert level to 5. The Rim Fire, so close to my parents’ vacation site, expanded to 192,723 acres today making it the 6th worst in California history.

s Rim Fire on August 28th, 2013
(Image source: Lance-Modis)
You can see this massive fire, now 23% contained, burning to the west of Yosemite in the Modis shot below. A more detailed report of this major wildfire is provided by WeatherUnderground here and here.
Mangled Jet Stream Temporarily Edges Eastward
My parents wanted to see Yosemite’s amazing waterfalls. A major source of my reticence in telling them the likely pattern for this summer was that the heat and drought out west would probably dry out many of those magnificent falls. And, sadly, this has happened. So even if they brave the smoke and fires to reach Yosemite, the one attraction my mom had been most excited to see will likely be somewhat less magnificent.
But a cloud has suddenly appeared in this wrinkle. For the Jet Stream had edged slightly east.
As of the middle of last week, reports of heatwave conditions had emerged throughout the US Midwest with North Dakota, South Dakota, Nebraska, Illinois, Wisconsin, Iowa, Minnesota and Missouri experiencing temperatures in the range of 20 degrees (Fahrenheit) above average. With heat index values hitting as high as 110 degrees, communities sweltered and school systems declared closings. In California, where temperatures had remained in the upper 90s to lower 100s for much of summer, the trough advanced, pushing temperatures back down to the 70s. An upper level low flirting with the west coast may even toss a few fog clouds and rain showers toward California. Such an event would be a welcome change for both my parents and for beleaguered fire fighters in the region.
In any case, the shift is expected to be short lived with ECMWF models showing the Jet Stream again backing up and reforming a hot and dry ridge pattern over the US west. So the Midwest can expect cooling and a return to more stormy, rainy conditions while the US west, after only a brief respite, continues to bake:

(Image source: ECMWF)
The September 7 ECMWF forecast again shows a large and powerful Rossby-type wave pattern with a very large and hot ridge setting up over the US and Canadian West with a deep trough digging down toward the US East Coast. It is the same pattern we’ve seen since at least April, a pattern that has delivered numerous rounds of heat and drought to the US west and an equally vicious and persistent pattern of storms and flooding from the central US to the east coast. The Jet Stream has, essentially, been stuck these past 5 months and there is no end in sight. For even if this configuration of the Jet were to move, it would likely simply re-distribute the locations of heatwaves and droughts and storms and floods.
If anything, this past summer has been yet one more validation in evidence of the work of Dr. Francis. And it is because of her work that I, a relatively untrained observer, can make the accurate prediction that a large region from the Mississippi west to California will continue to stay hot and dry and will continue to see risk for large fires, while the region to the east will remain cooler and stormier so long as the current Jet Stream configuration continues to persist. The western region will risk periods of record heat, continued drying of lands, rivers and aquifers, and fires of record size. The eastern region will continue to risk record floods and storm events. As summer proceeds to fall, shifts in these weather patterns have the potential to grow violent with the possibility of powerful nor-easters or hybrid storms developing near the US East Coast. Both the southeast and Florida remain very vulnerable to continued large rain events or tropical storms and hurricanes as time moves forward and in the event of pattern persistence. Meanwhile, long range model forecasts show this general pattern continuing to persist until at least early to mid September.
At this point, the current US Jet Stream pattern will have been in place for at least 6 months.
Share this:

Posted by robertscribbler on August 29, 2013
https://robertscribbler.wordpress.com/2013/08/29/drought-burning-rings-of-fire-out-west-severe-flooding-in-the-east-how-climate-change-and-a-mangled-jet-stream-wrecked-us-weather/
A Song of Flood and Fire: One Million Square Kilometers of Burning Siberia Doused by Immense Deluge
About a week and a half ago, I reported on a great burning event in which a massive region of Russian Siberia erupted in hundreds of wildfires blanketing it in a sea of smoke clearly visible in the NASA Aqua Satellite record. Today, reports from Interfax/Radio Russia describe an immense flood emergency in which over 1 million square kilometers of Russia’s Yakutia region have been submerged by a catastrophic rain event.
From the Interfax report:
“It is a unique situation in the sense that it has spread over more than 2,000 kilometers if one looks from west to east, while its depth or width is more than 500 kilometers,” Vladimir Stepanov, head of the National Crisis Management Center of the Emergency Ministry, told a news conference in Moscow.
According to the report, hundreds of villages in this, thankfully, sparsely populated region have been inundated by water putting hundreds of thousands of people in amongst a swirling flood. According to reports from Russian government, the region is now the site of a massive and major rescue operation. As of August 11, the operation composed an army of 20,000 personnel — a force that is likely to have greatly swelled as this major climate disaster expanded through today.

Floods turn Amur Region of Russia into a Sea on August 14.
(Image source: Radio Free Europe)
A Song of Flood and Fire
As of late July, heavy rainfall had emerged in a dense band along eastern Russia and bordering north China. This band of dense and heavy moisture rose north over an ocean heat dome that was setting off very dangerous high temperatures over the region of Southeast China even as it was baking a large region of ocean, heating a vast expanse of the surface waters to above 30 degrees Celsius. The added moisture and heat content provided fuel for low pressure systems skirting the high.
By early August, major flooding had begun to occur in this eastern region as very heavy storms sprang up over this large area.
We can see the development of this massive storm system starting on August 4th in the image below:

Russia August 4 — Heavy Rains to the East, Massive Fires to the West
(Image source: NASA/Lance-Modis)
In the above image, we are looking down on the Earth from a shot taken above the North Pole. The region we are looking at is Siberian Russia and Yakutia which dominates the central section of the image. Toward the lower left are the Laptev and East Siberian sections of the Arctic Ocean. Toward the central and upper left is Eastern Russia (Kamchatka), Mongolia, and extreme north China. In the upper right corner is central Asia.
Note the very dense region of clouds and rain pulsing up from the Pacific Ocean and overlaying Kamchatka and southern Yakutia. The storm at this point is vast and its cloud coverage immense. But it is just getting started.

Russia August 7 — Low Pressure Emerges From Central Asia
(Image source: NASA/Lance-Modis)
By August 7, the storms had sagged toward the south, drifting slowly eastward along the monsoonal flow. Occasional pulses of moisture rose northward from the Pacific to refresh and intensify this storm and cloud flux. This action brought the Pacific and monsoonal storms in direct contact with a hungry low pressure system rising up out of Central Asia and moving from the southwest toward the northeast. By August 7 we can begin to see this storm system entraining the massive volume of moisture associated with the Pacific storm pulse and monsoonal flows.
The storm was emerging over a region of Yakutia that had experienced a massive and terrifying explosion of very energetic wildfires. The air was heavily laden with particles of dense smoke from a great burning that had intensified since late July. There the moisture erupted into a powerful deluge that by August 11th had broken flood records set as far back as 1896. By that time, more than 20,000 personnel had been mobilized to help deal with the floods as hundreds of homes and scores of roadways were inundated.

Russia August 11 — Deluge Fully Formed Over Yakutia
(Image source: NASA/Lance-Modis)
As of August 11, we see a massive and fully formed storm complex directly over Yakutia. The storm has now fully entrained the dense smoke cover belched out by the hundreds of fires, some of which were still burning throughout the region. It was also still drawing in moisture from the Pacific storms and monsoonal flow over south Russia, Mongolia and northern China. A second arm of the storm stretched northward linking the storm with the Arctic. With a strong south and north linkage, the storm had accessed energy to maintain strength and intensity for an extended period.
The large storm system continued to churn through Yakutia and by today, August 14th, a massive region covering 1 million square kilometers was inundated by floodwater. What we see in the satellite shot for today are not one, not two, not three, but four rivers of moisture linking the major storm system that has inundated Yakutia.

Russia August 14 — Rivers of Moisture Collide
(Image source: NASA/Lance-Modis)
The first river of moisture is a continuation of the Pacific flow rising up along the southeast Russian coast, the second is the monsoonal flow moving from west to east to combine with this Pacific flow. A third flow feeds into the storm from Europe as it rides along parallel and to the north of the more southerly monsoonal flow. A final river of moisture rides up the from the storm, linking it to the Arctic and likely sharing energy and instability with that cold and dynamic region.
With a second low developing to the west of the first and moving along in its shadow and with moisture continuing to feed into these storm systems from the monsoonal flow to the south, it appears that rainy conditions will persist for the already inundated Yakutia region over the next few days at least. And if this pattern continues as predicted, it may well come to rival the great Pakistani floods of 2010.
Fires Still Burn Near the Flooded Lands
One, rather odd, feature of this major flood and fire event is that large areas of wildfires are shown to still be burning throughout Russia. Though the onrushing deluge clearly put out some of the major fires burning in north and central Yakutia, still other major fire complexes continue to burn — some of which remain very near to flooded regions.
In the below MODIS shot a major fire complex is still visible in a region of Russia to the west and south of areas most heavily affected by flooding:

Fires Burn in One Part of Russia as Another Part Floods.
(Image source: NASA/Lance-Modis)
These fires are burning directly in the shadow of the second storm system with their smoke trails feeding into the storm along its southerly inflow.
Conditions in Context
Earlier this year, drought and heatwaves blanketed Siberia and Yakutia. But late July, this region had begun to erupt in a series of extraordinary wildfires that blanketed almost all of northern and eastern Russia in very dense smoke. By early August what is perhaps the worst rainstorm in the history of this area of Russia had begun to form. As of the writing of this article, on August 14, major storms and flooding continued with no immediate end in sight.
Major heatwaves and droughts in extreme northerly regions of Siberia are an anomalous event linked to human caused climate change. Rapid sea ice and snow cover retreat combine with temperatures that are warming at a rate of .5 degrees C each decade over this region to increase the likelihood of such extreme events. Methane and organic carbon stores in the thawing tundra steadily release under this heat forcing and likely provide an amplifying feedback to summer heating events by locally providing more greenhouse gas emission and also providing another fuel store that is available to wildfires. In some of these wildfires, there are reports coming in that fires burn as far as 3 feet into the ground, taking out root systems and stumps along with the trees that burn above ground. Reports of burning ground have also been trickling in (Hat tip to Colorado Bob)
Such burn events are anomalous enough. But for a flood that covers a 1 million square kilometer area to immediately follow in the wake of such amazingly large and widespread fires is anything but normal. Atmospheric patterns that link major weather systems and increase their intensity can be attributed to the formation of powerful heat dome high pressure systems along with weakened and meandering Jet Stream waves. Rising atmospheric heat caused by human warming adds to the density and strength of heat domes (identified as becoming more intense by meteorologist Stu Ostro). Meanwhile erosion of the Jet Stream caused by reduced snow and sea ice cover (identified by Dr. Jennifer Francis) is implicated in a host of problems including more intense and persistent droughts and storm events along with the increased likelihood that weather systems will link up as north to south weather patterns deepen, back up, slow down, and elongate.
A massive ocean heat dome to the south over the Pacific adjacent to China and sea ice and snow cover remaining near record lows must be taken into account when looking at features that likely contributed to the extreme swings from drought, heatwave and fire to massive deluge and flood in Russia.
One last point to consider as a likely contributor is the fact that for each degree (Celsius) of human-caused temperature change, the hydrological cycle amplifies by about 8 percent. This means that rates of evaporation and rainfall are now about 6 percent more intense than they would be in the world of the 1880s. When combined with powerful new weather features like a mangled Jet Stream and immense heat dome high pressure systems, an amped up hydrological cycle further inflates an already extreme environmental condition.
UPDATE: LARGEST FLOOD IN RUSSIAN HISTORY
Reports from the Russian government indicate the region hardest hit stretches from lake Baikal to the Pacific Ocean with some towns in far eastern Russia along the Amur River under as much as 20 feet (6 meters) of water. Reports as recent as yesterday indicated that a total of 113 towns were experiencing major flooding and that an additional 100,000 residents may need to be evacuated.
As of today monsoonal flows and a large moisture pulse rising off of the Pacific Ocean along the back side of a powerful heat dome high pressure system continue to dump copious rains over the region.
Russian officials have stated that this event represents the largest flood in Russia’s history.
I’ve provided a MODIS shot of the hardest hit area under dense cloud cover on August 17:

Russia and China Flooding: Lake Baikal to Pacific Ocean
(Image source: NASA/MODIS)
Lake Baikal is on the left border of the image, the Pacific Ocean on the far right.
Links and Credits:
Hat Tip to Commenter Steve
Russia Experiences Great Burning
Share this:

Posted by robertscribbler on August 14, 2013
https://robertscribbler.wordpress.com/2013/08/14/a-song-of-flood-and-fire-one-million-square-kilometers-of-burning-siberia-doused-by-immense-deluge/
Arctic Heat Wave Re-Intensifies Over Central Siberia Setting off Rash of Tundra Fires

Large fires break out over Siberia during renewed Arctic heat wave.
(Image source: NASA)
UPDATE: LARGE METHANE PULSE OCCURS IN CONJUNCTION WITH ARCTIC HEATWAVE
Over the past week, temperatures have been building throughout Central Siberia. A broad swath of heat pushed thermometers into the upper 70s to upper 80s (with isolated spots showing 90+ degree readings, Fahrenheit) in a broad region stretching from Siberia’s forests all the way to the Arctic Coast. These heatwave conditions set off more than a score of large fires that raged through both Arctic forest and across broad areas of tundra. The largest of these fires covered areas up to 1000 square miles and numerous smoke plumes were visible from satellite, some of which stretched more than 800 miles in length. A larger pall of smoke from this region covered areas of North-Central Russia, the Arctic Coast and sections of Europe more than 2,000 miles away.
You can view these fires and related smoke plumes in the NASA Aqua Satellite image provided by Lance-Modis above.
The scorching Arctic heat wave and massive burning has been set off, once again, by a high amplitude northward bulge in the polar Jet Stream and related ‘heat dome’ high pressure system resting just beneath the bulge. As you can see in the below image, provided by the California Regional Weather Service, this particular heat bulge extends past the 80 degree North Latitude line, nearly reaching the North Pole. This extraordinary upward sweep in the Jet has completely compromised the polar vortex, allowing hot air to build far north and pass deep into the Arctic Ocean environs.

(Image source: California Regional Weather Service)
Arctic coastal temperatures usually average less than 50 degrees Fahrenheit at this time of year, but the region beneath this Arctic heat dome has averaged about 15-20 degrees hotter over the past week. Further south, where the tundra fields and arboreal forests of Siberia lay, temperatures have been even warmer with highs stretching into the middle and upper 80s and even lower 90s in some isolated locations. The added heat and the occasional thunderstorm that will typically form under such highly unusual Arctic conditions enhances the chance of wildfires. Now, after a week of such conditions, more than a score of large fires rage.

Tuesday daytime temperatures for Siberia. Red indicates temperatures ranging from 77-86 degrees Fahrenheit. Note the broad swath of these temperatures riding up from Russia all the way to the Arctic coastline. These measures represent daytime temperatures at the point recorded and do not necessarily record daily maximum temperatures for a given location.
(Image source: Arctic Weather Maps)
Unfortunately, forecasts call for hot conditions to persist over this region of the Arctic at least until Saturday. Then, the heat dome and related Jet Stream bulge is predicted to slowly shift toward Europe, bringing heat, dryness and related risk of wildfires along with it.
This particular heat wave is the most recent of many to plague the Arctic during 2013. Large Arctic regions from Siberia, to Europe, to Canada to Alaska experienced periods of extreme heat where temperatures rose 10, 15, 20 degrees or more (Fahrenheit) above average. The added heat and evaporation in one region appeared to aid in the formation of record floods in another with both Europe and Canada experiencing some of their worst floods on record.
Strange changes to the Jet Stream and the water cycle driving these extreme events are directly related to human-caused global warming. In the first instance, human-caused warming has set off a series of events that have caused a major erosion of Northern Hemisphere sea ice. Since 1979, more about 50% of sea ice extent and 80% of sea ice volume has been lost. Since the 1900s, more than 60% of sea ice extent has melted away. The sea ice, which tends to lock cold air in the Arctic, is thus dramatically weakened. The result is that more warm air tends to pool in the Arctic. As this happens, the temperature difference between the North Pole and temperate regions lessens. This loss of differential causes the Jet Stream to slow down. As the Jet Stream slows, it tends to move more like a lazy river, creating big loops, large high amplitude waves and numerous cut off flows. The net result is that weather systems move more slowly, causing weather patterns to persist over longer periods.
The high amplitude waves that have tended to form in the Jet Stream also result in warmer air being transported toward the North Polar region. In the case of the current Siberian heatwave and wildfires, this is exactly what is happening. What we have seen, this summer, is a ring of very hot conditions developing in the higher Latitude regions from about 60 degrees North to about 80 degrees North. This is the zone where much of the extreme Arctic heating has emerged.
This second factor, added atmospheric heat, causes greater evaporation to occur, especially in regions where the heat is most intense. On average, the global hydrological cycle, which is the net rate at which water evaporates and then comes back to the Earth in some form of precipitation, increases its intensity by 8% for each degree Celsius of warming. Currently, average global temperatures are about .8 degrees Celsius hotter than the 1880s average. So the rate at which water evaporates and the rate at which it falls from the skies as rain and snow has increased by more than 6%. In the hot regions under the Jet Stream bulges and related heat dome high pressure systems this means far more intense soil drying and risk of wildfires. In the wet regions of cut off lows and down-slopes in the polar Jet Stream this means more intense rainfall events.
In essence, this is how human caused global warming is helping to drive extreme weather events now. And the current Siberian heatwave and related wildfires is just one case in point.
Links:
California Regional Weather Service
The Arctic Heat Wave, Heat Domes, and a Mangled Jet Stream
Share this:

Posted by robertscribbler on July 23, 2013
https://robertscribbler.wordpress.com/2013/07/23/arctic-heat-wave-re-intensifies-over-central-siberia-setting-off-rash-of-tundra-fires/
Double Barrel Retrograde Low Sets Off Rain, Flooding From East Coast to Desert Southwest

(Image source: NOAA)
An upper level low that originated this weekend west of the Appalachians has now transitioned all the way to the New Mexico, Arizona border. If it continues this motion, it will exit the continent somewhere near Baja or Southern California this weekend, having pushed over 3,000 miles against an extraordinarily week Jet Stream.
Yesterday, a second low developed in the wake of the first over the southeast, slowly drifting east to west behind the first.
Today, this double barrel retrograde system brought rains and localized flooding to a wide region including Florida, Georgia, the Carolinas, Texas, New Mexico and Arizona. Miami, which consistently suffers from flooding these days due to an antiquated water management system unable to cope with encroaching seas and more intense rains brought on by climate change, was blanketed by high waters. City offices handed out sandbags to residents who saw roadways, golf courses and yards disappear beneath the flooding rains.
In Atlanta, warnings were issued as a local river approached flood stage and waters continued to rapidly rise as Houston experienced flooded roads and dangerous driving conditions. Less heavy downpours were reported throughout the Carolinas and into New Mexico and Arizona. The western rains may be welcome, as they help to alleviate drought conditions that have lasted for more than a year. In the east, rainfall has saturated many areas causing added concern for what is expected to be a busy hurricane season.
This rainy, backwards moving weather has been facilitated by an extraordinary weakness in the Jet Stream over the US. The pattern and weak upper level wind flow have resulted in retrograde weather affecting much of the US, now for five days running. You can view these dual weather systems moving backward over the US via the following NOAA animation:
http://www.ssd.noaa.gov/goes/east/eaus/flash-wv.html
The first retrograde low can be seen moving into Arizona, the second is centered over Georgia, and another system looping over Maine and into the backward upper level wind pattern will potentially recurve into the East Coast over the next 36 hours.
Dr. Jennifer Francis of Rutgers University has been presenting compelling research that shows that Arctic sea ice loss significantly affects the upper-level atmospheric circulation, slowing its winds and increasing its tendency to make contorted high-amplitude loops. Such high-amplitude loops in the upper level wind pattern (and associated jet stream) increase the probability of persistent (that is, longer-duration) weather patterns in the Northern Hemisphere, potentially leading to extreme weather due to longer-duration cold spells, snow events, heat waves, flooding events, and drought conditions.
Given the strange backward moving weather events of the past week, weather system motion retrograde to typical upper level flows may also be a likely result.
Links:
Jet Stream so Weak, Weather is Moving Backwards
Share this:

Posted by robertscribbler on July 18, 2013
https://robertscribbler.wordpress.com/2013/07/18/double-barrel-retrograde-low-sets-off-rain-flooding-from-east-coast-to-desert-southwest/
Dr. Jennifer Francis, Top Climatologists Explain How Global Warming Wrecks the Jet Stream and Amps Up Hydrological Cycle To Cause Dangerous Weather
(Video not showing? Click here to watch it directly.)
A new program, posted above and produced by Australian Broadcasting, provides in depth analysis of the cutting edge climate science that begins to reveal how human-caused climate change is causing increasingly dangerous weather.
The program explores past extreme events like the European and Russian heatwaves that together resulted in nearly 100,000 deaths, the devastating floods of Pakistan, and this year’s extreme Northern Hemisphere winter and shows how climate change was the driving factor in each. The program also explores issues I’ve been covering here — like how melting sea ice causes the Jet Stream to meander, resulting in more persistent weather patterns that drive extreme events. The chief pioneer in this research, Dr. Jennifer Francis, provides some well rendered and somewhat chilling explanations about this key feature of our new atmosphere.
Another aspect explored is how global warming greatly increases the hydrological cycle. New findings have shown that just 1 degree Celsius of global temperature rise increases the intensity of the global hydrological cycle by a whopping 7%. Evaporation increases by 7%, fueling more droughts and heatwaves, and rates of rainfall during storms also increases by 7%, further increasing the damage caused by the most extreme storms. Predicted rises in temperatures of 2, 4, 6 or more degrees Celsius would result in a catastrophic amplification of the hydrological cycle by 15, 30, 40 percent or greater. This basic underpinning of storm and drought formation shows how devastating to human systems such a massive change in major weather drivers would be.
Lastly, the program explores how even a .8 degree Celsius rise in temperatures has resulted in more deadly heatwaves. The great European, Russian, US and Australia heatwaves of the past decade are all explored in this particular expose.
Please watch to entire video. It is well worth your time.
Hat tip to Climate Crocks for the head’s up. As ever, my best wishes and admiration to Dr. Jennifer Francis for her astounding research.
Share this:
Posted by robertscribbler on July 16, 2013
https://robertscribbler.wordpress.com/2013/07/16/dr-jennifer-francis-top-climatologists-explain-how-global-warming-wrecks-the-jet-stream-and-amps-up-hydrological-cycle-to-cause-dangerous-weather/
Retrograde Low Makes Rush Against Feeble Jet Stream Toward Desert Southwest

(Image source: NOAA)
I’ve honestly never seen anything like this before. An upper level low and associated frontal systems had stalled near Tennessee this weekend. Then, on Sunday, the low abruptly turned west, riding against the now-feeble tide of the Northern Hemisphere Jet, its center transitioning all the way to eastern Arkansas last night even as associated frontal systems extended all the way to Utah. Today, the low continued to churn westward, against prevailing winds and centuries of weather precedent, and is now located near the Texas panhandle. You can watch the most recent flash animation of this extraordinarily strange weather sequence here.
Models show the low continuing to shift into the Desert Southwest, embedding itself into a monsoonal flow from the Pacific even as it pulls moisture in from the Gulf of Mexico. Such a situation will likely increase the ferocity of typical monsoonal rainfall events for this region with the potential for sudden downpours, locally extreme rainfall accumulations, and a heightened chance of severe thunderstorms.
A very moist Atlantic flow is now also flooding in from the east behind this retrograde low. For the US East Coast, the new and strange pattern will cause weather systems to now come in off the Atlantic rather than from the continent. In the hot conditions expected over the next week, added moisture may result in the firing of locally powerful storms or even the influx of tropical wave-like weather to the East Coast region. Greatest impacts will be seen for Florida, the Central Atlantic Appalachian chain, and the Great Lakes region.
This odd combination of moisture flows and a retrograde low pressure system will combine to create conditions for 1 inch or greater rainfall over broad swaths of the US over the next week. Areas most affected include the Eastern US, the US Gulf Coast, much of Texas, and Arizona and New Mexico. Areas hardest hit by rainfall are predicted to be West Texas and the border between New Mexico and Arizona, where rainfall totals could exceed 4 inches this coming week.

(Image source: NOAA)
A substantial erosion of the Northern Hemisphere Jet Stream has permitted this strange pattern of weather to emerge for the US. Usually, higher levels of summer sea ice and greater areas of summer snow cover in the far north would tend to increase the speed of the Jet, allowing it to push weather systems more rapidly along. But a massive erosion of this sea ice and related colder air has slowed down the Jet, setting up the conditions for the current retrograde to move backward against the prevailing weather flow for many days.
(Hat Tip to BugWump who requested this update in the comments section of a previous post).
UPDATE:
A chain of not one, but two retrograde lows appear to be moving against the prevailing weather pattern in the Northern Hemisphere. Doug, in a previous comment’s post, provided this chilling GOES sequence of the two lows — the first over the Central US and the second over the Pacific Ocean — moving together in retrograde.

(View sequence in full motion here)
Share this:

Posted by robertscribbler on July 15, 2013
https://robertscribbler.wordpress.com/2013/07/15/retrograde-low-makes-rush-against-feeble-jet-stream-toward-desert-southwest/
Please Help Support Our Ongoing Efforts

Climate of Pandemic — A COVID-19 Special Report

GROWTH SHOCK

Luthiel’s Song: Dreams of the Ringed Vale

Luthiel’s Song: The War of Mists

Climate Progress

The Secular Jurist

Exposing Misinformation Spread by Anthony Watts

Colorado Bob’s Climate Feed

Arctic Sea Ice Blog

Science Blogs

Climate State

