Fahrenheit 85.9 Near Arctic Ocean Shores — Extreme Heatwave Settles in Over North-Central Siberia, Canada’s Northern Tier

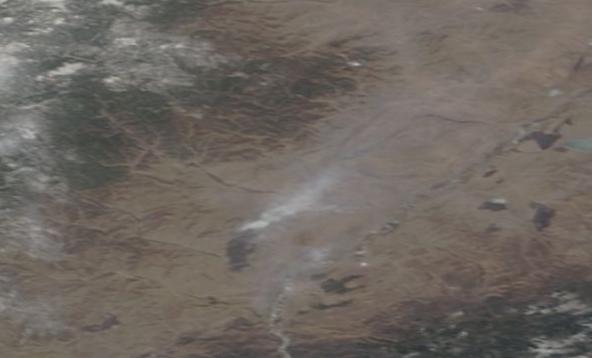
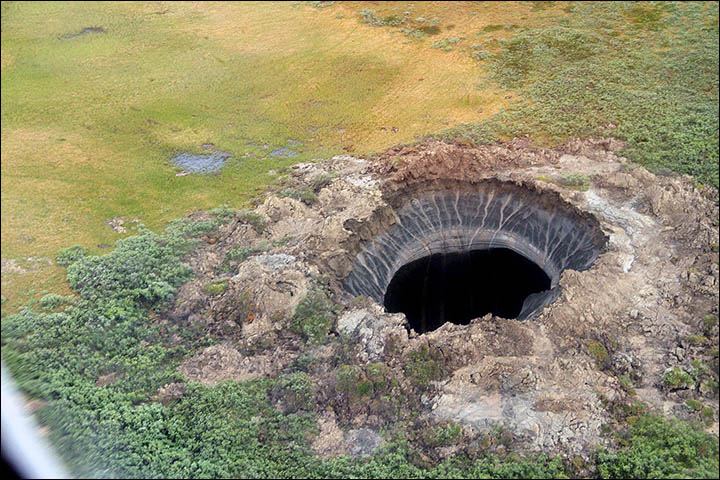
70.8 North, 69.2 East. It’s the Lat, Long coordinate location of a section of the Yamal Peninsula in Siberian Russia. A typically chilly region of frozen but now thawing ground more than 4 degrees of Latitude north of the Arctic Circle. A place that saw the appearance of odd, disturbing (and now controversial) methane blowholes pockmarking the melting permafrost during 2014. Today, the high temperature in a land now being forced to rapidly warm by human-caused climate change spiked to a tropical 80 degrees Fahrenheit (26.4 C) at 0800 UTC. Tomorrow, temperatures are expected to again rise to 80 F (26.5 C). And in the same location on Thursday, the mercury is forecast to strike close to 86 F (30 C).

Across the Arctic Ocean at Latitude 71.4 North and Longitude 111.7 West, Canada’s Victoria Island is today also seeing temperatures spike to near 80 F (26.8 C). It’s a place encircled by sounds of wet crackling and fluid sighs. The mournful songs of melting sea ice. A sad threnody for the end of a much more stable and hospitable climate age. And there, and even further north to Banks Island, readings are expected to range from 80 to 82 F (26.7 to 27.7 C) on Wednesday and into Thursday.

GFS Five Day Average

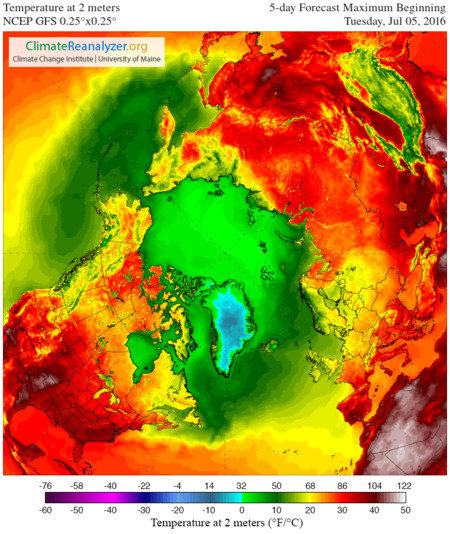
(Extreme heat wave predicted to build over the Arctic during the next five days as indicated by daily maximum temperatures forecast for the next five days shown above. Image source: Climate Reanalyzer.)

The heatwave in Northern Siberia comes on the back of new record high temperatures of 93 F (33.8 C) being reached in Buryatia on July 1 amidst record thunderstorm-induced downpours. The heat has since built northward along an extended ridge stretching over Central Asia and has now compromised a large section of the Arctic Circle zone.

On the Canadian side, the odd warmth comes in the form of a weird Northern heat island. The heat near the Canadian Archipelago is surrounded by cooler regions north, south, east and west. The result of a heat dome high pressure ridge building in over this far Northern region during the coming week.

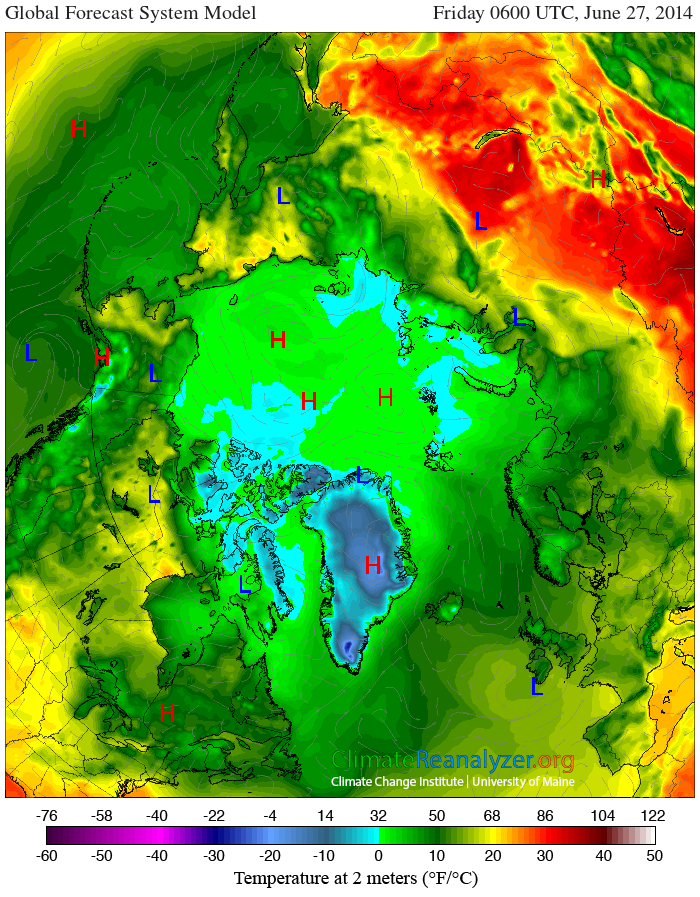
Weather monitors like the Global Forecast System model show that both of these regions are in for some very severe Arctic heat over the next five days. High temperatures in the range of 80 to 86 F (26 to 30 C) are about 27 to 36 degrees Fahrenheit above average (15 to 20 C).  Temperatures that will basically match those in Central America (8.3 N, 77.9 W) during the same time period. In other words, for these days and these regions, Arctic temperatures will roughly match tropical Equatorial temperatures.

Conditions in Context — 408 ppm CO2, 490 ppm CO2e is Forcing the Arctic to Warm Faster Than Lower Latitudes

This most recent Arctic heatwave occurs in a climate context that, taking into account for 408 ppm CO2 alone will likely result in 1-2 C of additional global warming (on top of current approximate 1 C warming since 1880s) over the long term. Meanwhile, total CO2e (including methane and other greenhouse gasses) measures of about 490 ppm imply 1.5 to 3 C of additional warming long term (on top of 1 C current) even if the present total greenhouse gas forcing is only maintained (not added to by human beings or the Earth System).

These are global averages. But all that extra heat forcing is causing the world to warm unevenly. As of 2009, the Arctic was warming up at a pace more than two times faster than the rest of the globe. And in the 40 year period from 1971 through 2011 NASA found that the Arctic had warmed about 3.55 degrees Fahrenheit while the rest of the world had warmed by 1.44 F. But that was before the big global heat spike during 2015 and 2016 further disproportionately heated the Arctic — pushing it into new record hot temperature ranges. In the end, it appears that the Arctic will eventually warm by about 2.5 to 3 C for every 1 C of overall global temperature rise. And the extreme heat we are seeing now in the Arctic is just a larger part of the geologically rapid warming trend now being driven primarily by human fossil fuel emissions.

Arctic Warming Faster Than Rest of World 2

(NASA graphic shows Arctic warming at a faster rate than the rest of the world. The capture is for 2000 through 2009 vs the NASA 1951 through 1980 20th Century baseline. Read article here at NASA’s Earth Observatory.)

Impacts like loss of sea ice’s cooling albedo effect (reflectivity), loss of land albedo due to greening and loss of snow cover, and unlocking of local carbon stores due to rising heat, expanding fires, and changes in weather all contribute to this more rapid rate of Northern Hemisphere Polar warming. In addition, warming oceans, northward moving climate zones, and warm wind influx events generated by weaknesses in the Polar Jet Stream preferentially transport heat toward the Arctic (especially during Winter). These various forcings generate an overall greater degree of warming for the Arctic Ocean region during Winter all while Summer sees extraordinary heat racing to the Continental edges North of the Arctic Circle.

The only effective way to slake this warming is to both halt human greenhouse gas emissions — which are the major driver of the big heat build up the world is now experiencing — as rapidly as possible while pursuing ways to remove the excess carbon loading from the Earth Atmosphere. Without these necessary responses and mitigations, more warming will continue to be locked into the pipeline and the greater the eventual temperature departure from 1880s (Holocene) values will ultimately become — with the Arctic increasingly entering a hot zone.

Links/Statements/Attribution:

Earth Nullschool

Climate Reanalyzer

Methane Blowhole

NASA’s Earth Observatory

What’s Causing the Poles to Warm Faster Than the Rest of The Earth?

Paleoclimate Tells Us We Have 1-2 C Additional Warming in Pipeline From CO2 Forcing

Record Heat and Abnormal Flooding as Siberia Gets Freak Weather

Scientific hat tip to Dr. Jennifer Francis

Hat tip to Cate

Hat tip to Spike

Hat tip to Colorado Bob

(Note: This post is not intended to draw any specific conclusion on the scientifically controversial issue of potential Arctic carbon store releases. Time-frames and thresholds for such potential amplifying feedbacks in response to human-forced warming — be they small, moderate, large or catastrophic — are currently not very well understood in the science. Mainstream science asserts that such feedbacks will tend to be more moderate and happen over longer time scales given current understanding of carbon store resiliency. That said, the amount of heat build up due to human-forced warming in the Arctic is impressive and concerning. For these reasons carbon store sensitivity necessitates close monitoring and further research by responsible observers.)

Siberian Heatwave Wrecks Sea Ice as Greenland High Settles In

We’ve never seen Arctic sea ice extents that are as low as they are now in early June. And with Arctic heatwaves, warm winds, warm storms, and a Greenland High all settling in, something had better change soon or otherwise the ice cap over the northern Polar Ocean is basically screwed.

*****

On the shores of the Arctic Ocean’s East Siberian Sea (ESS), near the town of Logashinko, temperatures today are expected to rise to near 80 degrees Fahrenheit. Readings that are about 40 to 50 degrees (F) above normal for this near-polar region during this time of year.

image

(Welcome to increasingly ludicrous climates. Temperatures near 80 F at Logashinko, Russia are at least 40 degrees F above average for this time of year. A place well north of the Arctic Circle, but whose temperatures are predicted today to match those of St. Martin Island in the tropics. Image source: Earth Nullschool.)

We would have never expected temperatures to have risen so high near typically frozen Logashinko during early June sans the heating effect of atmospheric CO2 levels that have this year peaked near 407.5 parts per million. The highest levels seen on Earth in about 15 million years. These scorching polar temperatures were driven north by a powerful high amplitude ridge in the Jet Stream that has dominated Eastern Russia for much of 2016 Spring. This expansive ridge enabled extreme wildfires popping up all over the region even as it today drives 80 degree weather all the way to Arctic Ocean shores — enforcing a regime of rapid sea ice melt over the East Siberian Sea.

ESS, Laptev Get Ripped Up

As the warm winds drive northward across ice-clogged Arctic Ocean waters, temperatures rapidly fall into 35 to 41 degree (F) ranges. And though that may sound cool to the casual observer, for the East Siberian Sea zone during early June, that’s scorching hot — topping out at more than 10 degrees above average for some areas. A pretty extreme variation for late Spring when temperatures over the Arctic Ocean only typically depart from average by about 3 or 4 degrees at most.

East Siberian Sea Melting

(The Laptev and East Siberian Sea Ice is getting ripped up by extreme Arctic warmth. The blue tint to ice in the above image indicates melt ponds, while dark blue indicates open water. Zooming in closer reveals the brown flush of warm waters issuing from heated Siberian rivers. Image source: LANCE MODIS.)

All across this Arctic Ocean region, melt ponds and widening polynyas now abound in the ridiculously warm airs. In the satellite shot above, the tell-tale bluish tint of the ice reveals a plethora of these ponds expanding northward through the ESS and on toward the pole. A flush of hot water running into the Arctic Ocean from East Siberia’s rivers is melting the near shore ice. And a giant 80 mile wide gap of open water has now been torn into the ice of the Laptev Sea.

Record Extent Lows Continue to Worsen

The sudden Arctic heatwave and rapid related melt involvement of the ESS and Laptev is just the most recent melt spike in a polar ocean that sees ice extent levels hitting new record lows with each passing day. As of June 2nd, the expanse of Arctic Sea ice only measured 10.37 million square kilometers. This is about 430,000 square kilometers below the previous daily record low set just last year and fully ten days ahead of the record sea ice melt year of 2012.

Arctic sea ice extent new record lows

(Arctic sea ice extent record lows continue for this time of year and threaten to plunge deeply below the 2012 line in coming days. Image source: JAXA.)

A coverage of sea ice that is now 42 days and 2.1 million square kilometers of sea ice loss ahead of an average melt year during the 1980s.

Here Comes the Greenland High

Extreme heat building into the Siberian side of the Arctic and record low sea ice extent measures are today being joined by yet another disturbing Arctic feature. For as of yesterday, a strong ridge of high pressure began to form over Greenland, the Canadian Archipelago and Iceland.

Greenland highs tend to increase temperatures over the enormous glaciers of that frozen island even as the clockwise circulation pattern of an anticyclone tends to shove sea ice out into the Barents and North Atlantic. The dominance of a Greenland High during both 2012 and 2007 is thought to have heavily influenced record end season sea ice melts during those years as well as the extreme Greenland surface melt spike during 2012.

image

(A high pressure ridge emerging over Greenland, Iceland and the Canadian Archipelago today is expected to strengthen this week — generating a high pressure gradient between warm storms developing over the Arctic Ocean and winds that threaten to increase the rate of ice transport out of the High Arctic and into regions of warmer water. Image source: Earth Nullschool.)

This week’s predicted ridge formation is not expected to bring with it a severe surface melt of Greenland. However, the clockwise winds driving sea ice transport may serve as yet one more heavy blow to the already greatly weakened ocean ice. Pressures later this week are expected to rise to 1040 mb over Greenland. And strong winds running between powerful warm storms expected to form in the Kara and Central Arctic are predicted to rise to near gale force north of Greenland — generating a risk of a very vigorous ice loss from the near polar zone as floes are driven into warm Barents and North Atlantic waters.

In context, the combined severe record sea ice lows and emerging weather conditions represent a seriously bad state for Arctic sea ice. One with a high risk of continued further extreme losses and new daily record lows for at least the next seven days.

Links:

Earth Nullschool

LANCE MODIS

JAXA

Arctic Sea Ice Graphs

The Arctic Ice Blog

Hat tip to Greg

Hat tip to Cate

Hat tip to DT Lange

Dozens of Massive Wildfires in Central Siberia Belch 1,200 Mile Smoke Plume Over Hot Tundra

1,200 mile smoke plume

(Dozens of monstrous fires belch a 1,200 mile plume of dark smoke over Central Siberia. Image source: LANCE MODIS.)

Let’s just cut to the chase, it’s been hot in Siberia.

This winter, temperatures throughout large swaths of this typically frigid land of tundra and boreal forest ranged between 5 and 7 degrees Celsius above average. For brief periods spikes in the very extreme range of 20 degrees Celsius warmer than normal were not uncommon.

The unusual heat continued into spring igniting a mass of anomalous wildfires in April, a time when most of Siberia remains frozen. By May, more than a million acres had burned, all well before the typical peak of fire season in July and early August. But that was mere prelude to peak fire season, which we are starting to enter now.

Siberian Heatwave Spurs Massive Fires

The record heat this winter was simply the continuation of a long warming trend fueled by human greenhouse gas emissions. Each decade now has seen Siberia warm at a pace double the global average — more than 0.5 degrees Celsius every ten years. And this extra heat is fueling a terrifying intensification of wildfires, a trend that is expected to show at least a doubling of the annual acres burned in this far northern region by the end of this century.

This year’s early start to fire season may be setting the stage for a record or near record burning this year. And today we have a massive flare up of fires in Central Siberia under a broad heat dome over the region.

Temperatures beneath the dome earlier today were in the upper 80s and lower 90s, departures between 5 and 15 degrees Celsius above average for this time of year. This heat spike hit already warmed and dried lands. Lands filled with the added fuel of thawing tundra and the organic carbon and methane pockets beneath. Lands whose shallow surface layer is a tinder bed for flash fires.

Siberian Heat Dome

(Heat dome over Central Siberia in the upper right hand corner of this GFS based-temperature and weather graphic. Image source: University of Maine. Data source: NOAA/GFS.)

The result was the massive wildfire eruption seen in the satellite shot at the top of the page. A very intense set of enormous fires with fronts ranging from 3 to 34 miles burning through boreal forest and tundra land. This set of blazes is even more intense than those seen at this time during the record 2012 Siberian fire season, although it is worth noting that those fires hit extraordinary strength and size by early July and continued in a series of episodes through mid August. The result was massive smoke plumes eventually encircling the Arctic.

Typically, the fires fill the air with particulate and the moisture loading under the heat dome grows ever more intense. Often, and sooner rather than later, a frontal storm accompanied with intense rains sweeps in, catching up the smoke in its cloud mass even as the towering storms douse the raging fires. A song of flood and flame that has become all too common throughout the very rapidly changing Arctic.

In years of very extreme burning, the smoke-laden clouds darken, losing their white, reflective tops. This further amplifies warming over fire-prone areas, setting the stage for more fires. On the ground, the fires plunge ever deeper into the thawing tundra, seeking more and more fuel. In some cases, the fires are reported to have burned the ground to a depth of 3 feet or more, turning both Earth and Tundra into blackened soot while pumping heightening volumes of CO2 into the atmosphere. The dark smoke aloft lifts away, eventually finding a resting place on sea ice or glaciers. There the heating feedback continues over ominously Dark Snow.

The whole terrible process continues until the globe at last tilts away from the summer sun, shutting the whole dreadful feedback down. But each year, we fuel it more through our burning of fossil fuels. Each year, the global greenhouse gas heat forcing ratchets higher and more and more tundra land thaws as the burn line creeps north, providing ever more fuel for the Arctic flames.

Links:

Support the Dark Snow Project

A Song of Flood And Fire

Support and defend our scientists at:

NASA/LANCE MODIS

The University of Maine

NOAA/GFS


NASA GISS Shows March 2014 Was Third Hottest on Record as Arctic Heatwave Spurs Siberian Fire Season to Early Start


NASA March 3rd Hottest

(NASA GISS Global Land-Ocean Temperature Anomaly vs the, already hotter than normal, 1951 to 1980 mean. Image source: NASA.)

According to NASA’s Global Land-Ocean Temperature Index, overall average temperatures for the month of March, 2014 were .69 to .7 degrees Celsius hotter than the 1951 to 1980 average. As a result, last month was the third hottest March in the global record since 1880. 2002 was ranked first hottest with 2010 as second hottest.

Nine of the ten hottest Marches on record have occurred since 2001. Ten of ten have occurred since 1998.

A wide zone of extraordinary temperature anomalies ranged throughout Siberia and the Arctic during the month with 4-8 C above average readings stretching along an enormous swath from Germany in the west to Yakutia in the east and from China in the south and on up to the North Pole.

Summer-like temperatures in Siberia

Large warmer than normal air pulses progressed from China northward over broad sections of Russia and Siberia throughout the month. These pulses harmonized with persistent high amplitude Jet Stream ridges over Eastern Europe to draw much warmer than average temperatures northward.

By early April, these conditions had translated into 70 degree (Fahrenheit) values for some sections of Siberia, where the annual fire season had an ominous, very early start for the Amur and the Baikal — Russian regions that are typically still locked in ice this time of year. Overall, by April 6, more than 2,000 hectacres of fires had been reported by the, justifiably, very concerned Russian officials.

Isolated Siberian Wildfire April 4

(An ominous and early start to fire season. Isolated Siberian wildfire visible from Satellite in center of frame on April 4, 2014. Image source: LANCE-MODIS.)

According to reports from Think Progress and The Siberian Times the heat coincided with extreme drought conditions:

“The forest fire situation is tense in Russia this year,” Russian Natural Resources Minister Sergei Donskoi said at a conference chaired by Prime Minister Dmitry Medvedev. “Due to a shortage of precipitation the forest fire season has begun almost one and a half months ahead of the norm.”

Temperatures in the Baikal and Amur regions were particularly hot with measures in late March and early April shattering previous temperature records by 2-9 degrees Celsius for the cities of Novosibirsk, Tomsk, Kemerovo, Barnaul and Gorno-Altaysk. Overall, this region of Russia has shown a very rapid pace of temperature increase: about .4 C per decade, or more than double the global average.

Polar amplification in very high gear

NASA zonal anomaly maps also continued to show evidence of an extreme polar temperature amplification in the Northern Hemisphere. Such high degrees of heat amplification at upper latitudes were a predicted result of human greenhouse gas emissions. Yet one more climate science prognostication that has borne out.

Zonal anomalies NASA

(March Zonal Temperature Anomalies. Image source: NASA.)


Links:

NASA

The Siberian Times

Siberia Experiencing Mid Summer Temperatures and Wildfires in April

LANCE-MODIS

Hat Tip to James Cole


Arctic Sea Ice Breaking Up as Heat Anomaly Spikes to 4.21 Degrees Celsius Above Average

The Siberian Heat Wave that began last week continues apace today. Far warmer than normal southerly winds continue to blow over a large region of Siberia bringing with them near freezing and occasionally above freezing temperatures. The combined influence of this off-shore flow and, what is for the Arctic, late spring and early summer-like weather is having a profound effect on Arctic sea ice in the regions of the Kara, Laptev, and East Siberian Seas.

Last week, we reported that an early break-up of sea ice was ongoing in the Kara Sea. Now, with the warm, off-shore flow shifting west, this break-up zone has expanded well into the Laptev and East Siberian. Satellite observations indicate that a very large section of ice pack, stretching from Severnaya Zemlya past the New Siberian Islands and on into the East Siberian Sea has been shoved northward by the strong south-north wind flow. The result is large gaps, ranging from 50-100 miles in width, forming along the boundary of the land fast ice and spreading through a zone of high impact for about 2,000 kilometers through the Kara and Laptev Seas before extending along a less involved fault zone another 1,000 kilometers into the East Siberian Sea.

Moving from west to east around the Arctic Basin, below is a summary of the ongoing break-up. Please note that some sections of these images are obscured by cloud cover:

Kara Sea March 9 v2Kara Sea March 24

(Kara sea before large scale breakup on March 9 in the top frame and after large-scale break up on March 24 in the lower frame. Image source: Lance-Modis)

Above, we have a continuation of the Kara Sea ice breakup we reported last week. Note that the break-up now extends all the way through sections of the land-fast ice to shore. Motion of the floe is still mostly south to north with sections of open water here ranging from 5-30 kilometers in width.

Moving east, we find that the eastward drift of the off-shore wind pattern and associated warm air temperatures that are closer to May and June norms have had a dramatic impact on Laptev sea ice as well:

Laptev March 9

Laptev March 24

(Laptev sea ice on March 9 with some large polynas prior to large scale break-up and extending of polynas on March 24. Image source: Lance-Modis)

Here we find the section of large openings and polynas spreading east from Severnaya Zemlya through the Laptev and on past the New Siberian Islands. Ice crack sizes are quite large with gaps stretching between 30-50 kilometers in width. Sea ice toward the central pack shows much more extensive cracks (leads) and breakage.

Still further east, the warm southerly winds have also widened and extended large cracks running through the East Siberian Sea, the region of water covering the shallow and sensitive East Siberian Arctic Shelf zone:

East Siberian Sea March 9

East Siberian Sea March 24

(East Siberian Sea ice on March 9 in the top frame and March 24 in the bottom frame. Image source: Lance-Modis.)

The crack structure appears to have shifted north, extended and widened even as the ice system became more crack-riddled.

Siberian Heat Wave Continues

Temperatures in the region continue to range between 5 and 20 or more degrees Celsius (9 to 36 F) above average for this time of year. This abnormal ‘heat’ translates into average temperatures ranging from -14 to 0 C (8 to 32 Fahrenheit). It is worth noting that salt water freezes at around -2 C (28 F, depending on salinity). So average temperatures in this range are enough to retard refreeze after breakage, to keep sea ice more disassociated and brittle, and to result in some areas where sporadic melt occurs.

As spring continues, warmer water beneath the ice pack, waters warmed by solar insolation, ice warmed by solar insolation, and warm water outflows from the Continents may well become involved to enhance early season sea ice break up and melt.

Overall, the Arctic is now experiencing an extraordinarily high temperature anomaly of +4.21 above the 1979-2000 average or about 5.7 C above the 1880s average. These excessive above average temperatures are high enough to initiate early melt, fragility and break-up in some zones (as observed above).

T2_anom_satellite2

(Very large Asian heat plume. Image source: University of Maine.)

This particular heat wave is in association with a very large Asian system in which much warmer than average temperatures extend south to north from Northern China, Mongolia, through the Yakutia region of Russia and on up into the Kara, Laptev, East Siberian, and Beaufort Seas of the Arctic Ocean. It is also worth noting the rather impressive hot pool forming over the Balkan States of Eastern Europe and the Ukraine which is, perhaps, a pattern settling in with the potentially oncoming El Nino.

GFS model runs show the current Arctic pulse spiking to around +5 C above 1979 to 2000 averages over the next 48 hours and then slowly fading through March 31 as anomalies return to a range of about +2-3 C above average. Hot zones continue to linger over China, Mongolia, Siberia and Eastern Europe as a somewhat troubling heat pulse develops over a large swath of western Greenland before riding up over Svalbard potentially bringing 30-40 degree (F) temperatures to both Western Greenland and this Arctic island by late in the forecast period.

Links:

Lance-Modis

University of Maine

Arctic Ice Graphs