Fahrenheit 85.9 Near Arctic Ocean Shores — Extreme Heatwave Settles in Over North-Central Siberia, Canada’s Northern Tier

70.8 North, 69.2 East. It’s the Lat, Long coordinate location of a section of the Yamal Peninsula in Siberian Russia. A typically chilly region of frozen but now thawing ground more than 4 degrees of Latitude north of the Arctic Circle. A place that saw the appearance of odd, disturbing (and now controversial) methane blowholes pockmarking the melting permafrost during 2014. Today, the high temperature in a land now being forced to rapidly warm by human-caused climate change spiked to a tropical 80 degrees Fahrenheit (26.4 C) at 0800 UTC. Tomorrow, temperatures are expected to again rise to 80 F (26.5 C). And in the same location on Thursday, the mercury is forecast to strike close to 86 F (30 C).

Across the Arctic Ocean at Latitude 71.4 North and Longitude 111.7 West, Canada’s Victoria Island is today also seeing temperatures spike to near 80 F (26.8 C). It’s a place encircled by sounds of wet crackling and fluid sighs. The mournful songs of melting sea ice. A sad threnody for the end of a much more stable and hospitable climate age. And there, and even further north to Banks Island, readings are expected to range from 80 to 82 F (26.7 to 27.7 C) on Wednesday and into Thursday.

GFS Five Day Average

(Extreme heat wave predicted to build over the Arctic during the next five days as indicated by daily maximum temperatures forecast for the next five days shown above. Image source: Climate Reanalyzer.)

The heatwave in Northern Siberia comes on the back of new record high temperatures of 93 F (33.8 C) being reached in Buryatia on July 1 amidst record thunderstorm-induced downpours. The heat has since built northward along an extended ridge stretching over Central Asia and has now compromised a large section of the Arctic Circle zone.

On the Canadian side, the odd warmth comes in the form of a weird Northern heat island. The heat near the Canadian Archipelago is surrounded by cooler regions north, south, east and west. The result of a heat dome high pressure ridge building in over this far Northern region during the coming week.

Weather monitors like the Global Forecast System model show that both of these regions are in for some very severe Arctic heat over the next five days. High temperatures in the range of 80 to 86 F (26 to 30 C) are about 27 to 36 degrees Fahrenheit above average (15 to 20 C).  Temperatures that will basically match those in Central America (8.3 N, 77.9 W) during the same time period. In other words, for these days and these regions, Arctic temperatures will roughly match tropical Equatorial temperatures.

Conditions in Context — 408 ppm CO2, 490 ppm CO2e is Forcing the Arctic to Warm Faster Than Lower Latitudes

This most recent Arctic heatwave occurs in a climate context that, taking into account for 408 ppm CO2 alone will likely result in 1-2 C of additional global warming (on top of current approximate 1 C warming since 1880s) over the long term. Meanwhile, total CO2e (including methane and other greenhouse gasses) measures of about 490 ppm imply 1.5 to 3 C of additional warming long term (on top of 1 C current) even if the present total greenhouse gas forcing is only maintained (not added to by human beings or the Earth System).

These are global averages. But all that extra heat forcing is causing the world to warm unevenly. As of 2009, the Arctic was warming up at a pace more than two times faster than the rest of the globe. And in the 40 year period from 1971 through 2011 NASA found that the Arctic had warmed about 3.55 degrees Fahrenheit while the rest of the world had warmed by 1.44 F. But that was before the big global heat spike during 2015 and 2016 further disproportionately heated the Arctic — pushing it into new record hot temperature ranges. In the end, it appears that the Arctic will eventually warm by about 2.5 to 3 C for every 1 C of overall global temperature rise. And the extreme heat we are seeing now in the Arctic is just a larger part of the geologically rapid warming trend now being driven primarily by human fossil fuel emissions.

Arctic Warming Faster Than Rest of World 2

(NASA graphic shows Arctic warming at a faster rate than the rest of the world. The capture is for 2000 through 2009 vs the NASA 1951 through 1980 20th Century baseline. Read article here at NASA’s Earth Observatory.)

Impacts like loss of sea ice’s cooling albedo effect (reflectivity), loss of land albedo due to greening and loss of snow cover, and unlocking of local carbon stores due to rising heat, expanding fires, and changes in weather all contribute to this more rapid rate of Northern Hemisphere Polar warming. In addition, warming oceans, northward moving climate zones, and warm wind influx events generated by weaknesses in the Polar Jet Stream preferentially transport heat toward the Arctic (especially during Winter). These various forcings generate an overall greater degree of warming for the Arctic Ocean region during Winter all while Summer sees extraordinary heat racing to the Continental edges North of the Arctic Circle.

The only effective way to slake this warming is to both halt human greenhouse gas emissions — which are the major driver of the big heat build up the world is now experiencing — as rapidly as possible while pursuing ways to remove the excess carbon loading from the Earth Atmosphere. Without these necessary responses and mitigations, more warming will continue to be locked into the pipeline and the greater the eventual temperature departure from 1880s (Holocene) values will ultimately become — with the Arctic increasingly entering a hot zone.

Links/Statements/Attribution:

Earth Nullschool

Climate Reanalyzer

Methane Blowhole

NASA’s Earth Observatory

What’s Causing the Poles to Warm Faster Than the Rest of The Earth?

Paleoclimate Tells Us We Have 1-2 C Additional Warming in Pipeline From CO2 Forcing

Record Heat and Abnormal Flooding as Siberia Gets Freak Weather

Scientific hat tip to Dr. Jennifer Francis

Hat tip to Cate

Hat tip to Spike

Hat tip to Colorado Bob

(Note: This post is not intended to draw any specific conclusion on the scientifically controversial issue of potential Arctic carbon store releases. Time-frames and thresholds for such potential amplifying feedbacks in response to human-forced warming — be they small, moderate, large or catastrophic — are currently not very well understood in the science. Mainstream science asserts that such feedbacks will tend to be more moderate and happen over longer time scales given current understanding of carbon store resiliency. That said, the amount of heat build up due to human-forced warming in the Arctic is impressive and concerning. For these reasons carbon store sensitivity necessitates close monitoring and further research by responsible observers.)

Siberian Heatwave Wrecks Sea Ice as Greenland High Settles In

We’ve never seen Arctic sea ice extents that are as low as they are now in early June. And with Arctic heatwaves, warm winds, warm storms, and a Greenland High all settling in, something had better change soon or otherwise the ice cap over the northern Polar Ocean is basically screwed.

*****

On the shores of the Arctic Ocean’s East Siberian Sea (ESS), near the town of Logashinko, temperatures today are expected to rise to near 80 degrees Fahrenheit. Readings that are about 40 to 50 degrees (F) above normal for this near-polar region during this time of year.

image

(Welcome to increasingly ludicrous climates. Temperatures near 80 F at Logashinko, Russia are at least 40 degrees F above average for this time of year. A place well north of the Arctic Circle, but whose temperatures are predicted today to match those of St. Martin Island in the tropics. Image source: Earth Nullschool.)

We would have never expected temperatures to have risen so high near typically frozen Logashinko during early June sans the heating effect of atmospheric CO2 levels that have this year peaked near 407.5 parts per million. The highest levels seen on Earth in about 15 million years. These scorching polar temperatures were driven north by a powerful high amplitude ridge in the Jet Stream that has dominated Eastern Russia for much of 2016 Spring. This expansive ridge enabled extreme wildfires popping up all over the region even as it today drives 80 degree weather all the way to Arctic Ocean shores — enforcing a regime of rapid sea ice melt over the East Siberian Sea.

ESS, Laptev Get Ripped Up

As the warm winds drive northward across ice-clogged Arctic Ocean waters, temperatures rapidly fall into 35 to 41 degree (F) ranges. And though that may sound cool to the casual observer, for the East Siberian Sea zone during early June, that’s scorching hot — topping out at more than 10 degrees above average for some areas. A pretty extreme variation for late Spring when temperatures over the Arctic Ocean only typically depart from average by about 3 or 4 degrees at most.

East Siberian Sea Melting

(The Laptev and East Siberian Sea Ice is getting ripped up by extreme Arctic warmth. The blue tint to ice in the above image indicates melt ponds, while dark blue indicates open water. Zooming in closer reveals the brown flush of warm waters issuing from heated Siberian rivers. Image source: LANCE MODIS.)

All across this Arctic Ocean region, melt ponds and widening polynyas now abound in the ridiculously warm airs. In the satellite shot above, the tell-tale bluish tint of the ice reveals a plethora of these ponds expanding northward through the ESS and on toward the pole. A flush of hot water running into the Arctic Ocean from East Siberia’s rivers is melting the near shore ice. And a giant 80 mile wide gap of open water has now been torn into the ice of the Laptev Sea.

Record Extent Lows Continue to Worsen

The sudden Arctic heatwave and rapid related melt involvement of the ESS and Laptev is just the most recent melt spike in a polar ocean that sees ice extent levels hitting new record lows with each passing day. As of June 2nd, the expanse of Arctic Sea ice only measured 10.37 million square kilometers. This is about 430,000 square kilometers below the previous daily record low set just last year and fully ten days ahead of the record sea ice melt year of 2012.

Arctic sea ice extent new record lows

(Arctic sea ice extent record lows continue for this time of year and threaten to plunge deeply below the 2012 line in coming days. Image source: JAXA.)

A coverage of sea ice that is now 42 days and 2.1 million square kilometers of sea ice loss ahead of an average melt year during the 1980s.

Here Comes the Greenland High

Extreme heat building into the Siberian side of the Arctic and record low sea ice extent measures are today being joined by yet another disturbing Arctic feature. For as of yesterday, a strong ridge of high pressure began to form over Greenland, the Canadian Archipelago and Iceland.

Greenland highs tend to increase temperatures over the enormous glaciers of that frozen island even as the clockwise circulation pattern of an anticyclone tends to shove sea ice out into the Barents and North Atlantic. The dominance of a Greenland High during both 2012 and 2007 is thought to have heavily influenced record end season sea ice melts during those years as well as the extreme Greenland surface melt spike during 2012.

image

(A high pressure ridge emerging over Greenland, Iceland and the Canadian Archipelago today is expected to strengthen this week — generating a high pressure gradient between warm storms developing over the Arctic Ocean and winds that threaten to increase the rate of ice transport out of the High Arctic and into regions of warmer water. Image source: Earth Nullschool.)

This week’s predicted ridge formation is not expected to bring with it a severe surface melt of Greenland. However, the clockwise winds driving sea ice transport may serve as yet one more heavy blow to the already greatly weakened ocean ice. Pressures later this week are expected to rise to 1040 mb over Greenland. And strong winds running between powerful warm storms expected to form in the Kara and Central Arctic are predicted to rise to near gale force north of Greenland — generating a risk of a very vigorous ice loss from the near polar zone as floes are driven into warm Barents and North Atlantic waters.

In context, the combined severe record sea ice lows and emerging weather conditions represent a seriously bad state for Arctic sea ice. One with a high risk of continued further extreme losses and new daily record lows for at least the next seven days.

Links:

Earth Nullschool

LANCE MODIS

JAXA

Arctic Sea Ice Graphs

The Arctic Ice Blog

Hat tip to Greg

Hat tip to Cate

Hat tip to DT Lange

Warm North Pacific Winds Predicted to Usher in Brutal Arctic Heatwave this Week

Sprawling over the Northeastern Pacific, there’s a big, doggedly-determined high pressure system. One grown to enormous size and influence in a global atmosphere boiling with the heat of fossil-fuel laden airs. A weather system that’s now able to stretch out a long arm of influence into the High Arctic due to an unrelenting northward shove of oppressive record global heat.

Beaufort Sea Ice Shattered

(The Beaufort Sea Ice has been shattered under the weight of a relentless a high pressure system that has dominated this region of the Arctic for about a month. Now, a freak early-season invasion of above-freezing temperatures is set to level another melt-forcing blow at a region that is very sensitive to the worsening impacts of human-caused climate change. Image source: LANCE-MODIS.)

Extreme Fires, Sea Ice Loss in a Context of Ever-Worsening Climate Change

Beneath the high, much warmer than normal airs have settled in over the Northeast Pacific, over Western Canada, and over Alaska. These much hotter than typical temperatures have provided fuel for a raging start to fire season in such far northern regions. In Canada, nearly a hundred and fifty fires now burn. Sparked by never-before-seen heat and dryness, the worst of these blazes has now consumed 620 square miles of land and more than 1,600 structures around the city of Fort McMurray — forcing about 90,000 people to evacuate and threatening Canada’s hothouse gas emitting tar sands production facilities. Meanwhile, in Alaska, the heat has been lighting off forest fires since as early as February. A month that once only featured a climate of deep chill and heavy snow — but one that in the new, greenhouse gas warmed, world features an ominous winter burning.

The high has also extended it atmospheric influence up into the Polar zone — joining a powerful ridge that has torn away and shattered sea ice across the Central Arctic since at least mid-April. Opening wide areas of dark, heat absorbing water and contributing to never-before-seen low levels of sea ice extent and volume for May.

May Arctic Heatwave Builds

As of Sunday, this lumbering high began a big shift to the west — expanding its influence on into the North-Central Pacific and the Bering Sea. There, it rallied a warm flood of airs in the form of northbound winds. Warm winds now readying to make a big push into the Arctic Ocean later this week.

image

(Huge northward thrust of warm air seen in this Earth Nullschool capture for predicted May 12 conditions. Note the large swath of above-freezing temperatures invading the Arctic Ocean as readings in Northern Alaska and the Northwest Territory of Canada hit the upper 60s and lower 70s. Regions that are typically still covered in snow experiencing conditions that would be somewhat warmer than normal May weather for the US West Coast city of San Fransisco more than 2,000 miles to the south. Image source: Earth Nullschool.)

These winds are expected to build northward along a warm frontal zone over Northern Alaska and the southern reaches of the Beaufort and Chukchi Seas on Monday. Linking up with two low pressure systems forming over the East Siberian Sea by Wednesday morning, this wave of heat rising out of the Pacific is expected to have expanded into that sea and taken in all of the Chukchi and half of the Beaufort. By Friday, this northward drive of above freezing airs is expected to have taken in about a third of the Arctic Ocean region in total.

Over Alaska and the Northwest Territory near the Mackenzie Delta, temperatures are expected to rise into the upper 60s to upper 70s Fahrenheit (20-25 C). These are temperatures 20-28 degrees F (9-16 C) above average for early-to-mid May and readings seldom seen for this region even during June. Such high temperatures will hasten melt of any remaining snow or ice and spike fire hazards over this Arctic zone.

Extreme warm temperature anomalies over Arctic zones predicted for May 13

(Two lows on the Siberian side of the Arctic and a high over southern Alaska and the Northeast Pacific are predicted to drive an extreme level of heat into the Arctic starting Monday and continuing on through the end of this week. This extraordinary northward thrust of warmth appears set to tip the scales swiftly toward high Arctic thaw conditions that are typically experienced during June. Such a high degree of added heat will have a profound effect on both sea ice and remaining snow cover. Image source: Global and Regional Climate Anomalies.)

Savaging of the Sea Ice to Continue

Over the Arctic Ocean, conditions will arguably be worse. Temperatures in the near coastal waters of the Beaufort Sea could rise to as high as 41 degrees F (5 C) while temperatures in the range of 32-38 F (0 to 3 C) are expected to cover a very wide zone of Arctic waters invading about 600 miles of the thinning sea ice area between the Mackenzie Delta and the North Pole and covering a breadth of around 800 miles from the Canadian Archipelago to the shores of the East Siberian Sea. These temperatures are also 20-28 F (9-16 C) above average and are more like the atmospheric readings one would expect during July over these typically frozen Arctic waters.

It’s not just the high temperatures that are a concern with this invasion of extreme heat running into the Arctic. It’s also its sheer scale — taking in about 30 percent of the Arctic Ocean zone, most of Alaska, a large region of Northeast Siberia, and a big chunk of Northwest Canada. Such a huge warm air injection will be taken in by the larger circulation over the Arctic Ocean and greatly shrink the remaining pool of cooler airs — driving temperatures to push more rapidly above freezing.

Freezing Degree Day Anomaly

(Off-the charts record Arctic heat shows up in a -1012 freezing degree day anomaly during 2016. In an average year, the Arctic experiences about 6,000 freezing degree days. We’ve lost more than 1/6th of that during 2016, which is basically like knocking one month out of the Polar Winter. Image source: CIRES.)

To this point, temperature anomalies above the 66 North Latitude Line are predicted to continue in the range of 2.5 to 3.5 C above average for the entire Arctic region into mid-May during a time of year when readings tend to moderate. In other words, this range is well above average for this time of year and continues a trend of record Arctic heat for 2016 that began during January. One that has now pushed freezing degree days (FDD) to a never-before-seen -1012 anomaly — which is like losing one entire month out of the coldest time of year in the Arctic.

The severe Arctic warmth continues to have a profound impact on Arctic sea ice — pushing measures inexorably into new record low levels. As of today, pretty much all the major extent and volume measures showed sea ice at new record daily lows and indicated a pace of melt at start of season that is absolutely unprecedented. Of particular concern are volume measures which have rapidly closed and overcome the gap between previous record low years.

DMI sea ice

(DMI’s sea ice volume measure enters a new record low range during early May. Note how swiftly comparative sea ice levels have fallen since February and March of this year. In essence, we are currently just below the record low 2012 launching pad all while facing an unprecedented level of heat building up in the Arctic. Image source: DMI.)

In this context of extreme Arctic heat and already record low Arctic sea ice levels, we continue to expect new record lows to be reached by the end of the melt season — pushing past one or more of the low marks set during 2012 and possibly testing near zero sea ice ranges (blue ocean event) of 80 percent volume loss since 1979 and below 750,000 square kilometers of sea ice area and 1.5 million square kilometers of sea ice extent by September of this year.

Links:

Earth Nullschool

Global and Regional Climate Anomalies

CIRES

DMI

The Beaufort Under Relentless Pressure

Canadian Interagency Fire Center

LANCE-MODIS


Warm Arctic Storms Aim to Unfreeze the North Pole Again — That’s 55 Degrees (F) Above Normal For January

It’s worth re-stating. The Starks were wrong. Winter isn’t coming. Winter, as we know it, is dying. Dying one tenth of a degree of global oceanic and atmospheric warming at a time. Steadily dying with each ton of heat-trapping greenhouse gasses emitted through our vastly irresponsible and terrifyingly massive burning of fossil fuels.

******

According to UCAR reanalysis, it’s something that’s only happened three times during December in the entire temperature record for the North Pole since the late 1940s. Four times now that a record warm surge of air hit that highest point of Northern Hemisphere Latitude during late December of 2015. An event that was influenced by the very destructive Winter Storm Frank. A combination of weather variables that, by themselves, was odd and rare enough. But what may be about to happen next week is even more rare. Because we’ve never, not once, seen this kind of heat set up at the North Pole during January.

UCAR North Pole

(UCAR’s North Pole temperature data record since 1948 per Bob Henson shows no above freezing days at the North Pole during January through late April. But it could happen next week.)

Disturbingly, what we’re seeing now starting to take shape is another warm air invasion of the Arctic with the potential to bring above-freezing temperatures to the North Pole during the long polar night. An odd and highly abnormal event that may again take place this Winter in just a few more days. If it does happen it will be yet another case of a never-before-seen warming event occurring in a record hot world.

North Pole May Unfreeze A Second Time This Winter

According to Global Forecast Systems model reanalysis by Earth Nullschool, it appears that a record warm Earth atmosphere and ocean system is again taking aim at the High Arctic. Another synoptic daisy chain of storms funneling warm, south-to-north winds — dredging them up from the tropics, flinging them across thousands of miles of North Atlantic Ocean waters, driving them up over Svalbard and toward the North Pole — is predicted to set up by early morning Monday.

image

(Temperatures are predicted to warm into a new record range for the North Pole by late Tuesday. Readings that strike very close to freezing at the North Pole now appear in the most recent Global Forecast System model summary by Earth Nullschool. If temperatures in this region do hit above freezing, it will be an unprecedented event. Image source: Earth Nullschool. )

The anchor of these dervishes of Equator-to-Pole heat transfer is the very Winter Storm Jonas that just crippled the Eastern US with record snowfall amounts and storm surges that have beaten some of the highest seas seen during Superstorm Sandy. A second, hurricane force low in the range of 950 mb is predicted to set up between Iceland and Greenland. But the tip of this spear of record atmospheric heat pointed directly at the Arctic is a third, but somewhat milder 990 mb, storm.

And it is this northern low that will draw a leading edge of record warmth into the Arctic. An anomalous, ocean-originating heat front that will spread its pall of air warm enough to melt sea ice during Winter north of Svalbard tomorrow. A swath of near and above-freezing temperatures spreading inexorably Pole-ward. Reinforced by the supporting lows and the synoptic wave of warmth in train, this storm is predicted to drive near or slightly above freezing temperatures into the region of 90 North Latitude by late Tuesday or early Wednesday. An event that would be unprecedented, at least in modern meteorological reckoning. One that may well be unprecedented for the whole of the Holocene.

Conditions in Context — Another Summer-Type Heatwave For The Arctic During the Long Dark of Winter

Another Wave of Extreme Arctic Heat

(Another wave of extreme, above average temperatures for the Arctic is on the way. Image source: Climate Reanlyzer.)

To put such extraordinary temperatures into context, this predicted record polar warmth is in the range of 55 degrees (F) above normal for January. And for such a typically frigid region, these temperatures are more usual for June, July, or August. Or, to make another comparison, for Gaithersburg, Maryland it would be like seeing readings above 94 degrees (F) for the same Winter day. A summer heatwave in the midst of what should be a season of cold. That’s what’s predicted for a region that will not see a single ray of sunlight until April.

Heat trapping gasses with the ability to re-radiate the sun’s energy in the dark of night or in the depths of Winter are now having a profound impact on our world. It’s something that should really be keeping us up at night. At the very least, it’s something that on Tuesday may push the North Pole up above freezing on a, black as night, January day.

Links:

Warm Arctic Storm to Push Temps Above Freezing at North Pole During Winter

The Storm that Will Unfreeze the North Pole

Climate Reanlyzer

Earth Nullschool

Bob Henson

UCAR Climate Reanalysis

Hat Tip to Greg

“Massive” Arctic Heat Dome Sets Up to Bake Sea Ice

There’s a massive heat dome building over an Arctic sea ice pack that is looking increasingly fragile in both model forecasts and observations. In short, very bad weather for sea ice is rapidly settling in even as the ice pack, despite recent place gains in some measures, is looking increasingly weak.

*   *   *   *   *   *

First the somewhat good news… Arctic sea ice extent has backed off to about 8th lowest on record. Arctic sea ice area is at about 4th lowest on record. And Arctic sea ice volume, according to DMI, is in the range of 3rd lowest on record (PIOMAS looks even better). This report may sound rather bad, but when compared with  late May and early June when sea ice extent measures were at or near new record lows the data could arguably be characterized as an improvement. Yeah, there’s been some big area drops recently, but all in all, not too terrible, right?

Probably wrong… Because the Arctic is gearing up for a very powerful heat wave over the coming week. One that is likely to spike maximum summer temperatures in the High Arctic, a region that seldom shows much variance on the side of hot or cold at this time of year, by 0.5 to 1.5 C above average. A heatwave my somewhat more reserved fellow ice observer, Neven, has called ‘HUGE’ (note that Neven seldom uses caps lock) and is characterizing as something he’s not seen in all of his five years of sea ice observation. From The Arctic Sea Ice Blog Today:

However, there is one big difference compared to last year and that’s heat. Despite a very cold start, there have been several outbreaks of warm air over the ice, slowly but radically shifting the balance between extent and area data. The impact is felt on the surface of the ice pack, but doesn’t translate directly into a decrease. Not yet. In theory, it should percolate through after a while, especially if the heat persists. And right now the Arctic sea ice pack is undergoing a massive heat wave which shows no signs of letting up.

I find myself in agreement with Neven. The massive heat build in the Arctic predicted for this week is likely to be a significant event with potentially wide-ranging impact. But to understand why, it helps to get an overall picture of the broader context in which this particular heatwave is occurring. And that context includes two other stories as well — the story of human-forced climate change and the story of a still developing and potentially monstrous El Nino.

Ocean Warming Injects Heat into the Arctic

To get an idea how warming in the Equatorial Pacific and over-all greenhouse gas based warming can have such a far-flung impact, particularly on the currently building Arctic heatwave, it always helps to take a look at the behavior of the circumpolar Jet Stream. Large areas of persistently warmed water, like the one we have seen now for two years over the Eastern Pacific, have a tendency to generate high amplitude ridges in the Jet. Ridges that serve as open avenues for heat transport into the Arctic. Specifically yesterday a huge pulse of heat was traveling north along just such a high amplitude and ocean-warmed ridge:

Jet Stream July 6 2015

(Amazing high amplitude Jet Stream wave punching all the way through to the High Arctic on the back of the Eastern Pacific’s Ridiculously Resilient Ridge. Image source: Climate Reanalyzer.)

Our particular heat transporter should by now be very familiar — a ridiculously resilient ridge (RRR) — extending northward and buttressed by multiple high pressure cells stubbornly entrenched over abnormally hot water in the Eastern Pacific. Yesterday (Monday, July 6) the ridge elongated. South to north winds over-riding northward flowing warm, salty ocean water. Running up through Alaska, the heat pulse set off all-time daily highs in places like Anchorage (81 degrees and breaking the record set in 1972). The heat then spilled into the Bering, Chukchi and Beaufort Seas where it met with adjoining, though lesser heat pulses over-riding Greenland and the Laptev. A gathering pocket of hot, thick air that is now pooling in the so-called sea ice ‘safe zone’ just north of Greenland.’ A precursor to the very intense high pressure cell we see developing now.

But before we go on to tell the tale of our gathering Arctic heatwave we should first take a closer look at ocean surface temperatures. As these give us a rather clear picture of the Arctic’s current vulnerability — providing for us a hint as to why heat will intensify most strongly to the north of the Canadian Archipelago and Greenland. For it is ocean surface heat that built the road that warm air followed:

Warm water plume invades Arctic

(Heat plume running all the way from Equator to Pole clearly reflected in this July 6 NOAA/ESRL SSTA anomaly map.)

Taking a look at NOAA’s July 6 Sea Surface Temperature Anomaly (SSTA) map, we find a massive plume of much warmer than normal (1971-2000) waters extending up from a plainly visible El Nino pattern, all throughout a large sweep of the Eastern Tropical Pacific. Moving northward, these steamy waters spill into two hot blobs off the Mexican, US, and Canadian coasts — a heat pool that again punches up through the Chukchi and Beaufort Seas. An Equator to Pole expanse of ominously hot water that is enabling both sea ice melt in the regions directly impacted as well as a broader invasion of warmth into even the sea ice’s most secure haunts.

Heat Directly North of Greenland, Canadian Archipelago

Warmth that today aided in the formation of an Arctic high pressure ridge hitting significant heights of 1030 to 1035 mb directly between the Pole and Greenland. At 1245 Eastern Standard Time, the ridge had already intensified to 1032 mb. And for at least the next seven days both the GFS and the Euro model shows a 1025 to 1035 mb high pressure cell dominating the same region.

imageimage

(Left frame shows strong, 1032 mb high pressure system settling in to the region just north of Greenland on July 7. By July 10 [right frame], this ridge is predicted to have greatly warmed the Central Arctic zone between Greenland and the Pole. Image source: Earth Nullschool.)

This persistent ridge will remove cloud cover in a large area between North America and the Pole. Sunlight, at its seasonally most intense, will multiply already widespread melt ponds on the sea ice surface. The combined solar forcing and loss of albedo will push surface temperatures higher as the ridge remains in place. And by Friday a broad band of 2-4 C temperatures is predicted to form in a bulge over the Arctic Ocean north of Greenland and the Pole. Abnormally warm temperatures and direct sunlight that will, over the next week, increase melt pressure over the last remnant of thick sea ice left to the Arctic.

In addition to reducing cloud formation and enhancing the melt-forcing impact of sunlight on the sea ice, high pressure cells in this region will have a couple of further influences. First, they will tend to compact the sea ice overall — drawing in the fringe ice while generating warm water upwelling at the ice edge. And second, the clockwise motion of air circulating around a strong high pressure cell will nudge sea ice out of the Central Arctic toward the gateway of the Fram Strait. Add in the significant impact due to reduced cloud formation allowing sunlight to contact sea ice during a period of peak solar radiative forcing and we end up with a substantial overall blow to the sea ice.

Arctic temperature anomaly

(Extraordinary high temperature anomalies are predicted for the Arctic from July 7-17. A departure more typical for winter when human greenhouse gasses have the greatest heat-amplifying impact. Image Source: meteomodel.)

Taking a look at the meteomodel anomaly map above, we find a very extreme warming of the Central Arctic predicted over the next ten days. A heat pulse to rival 2012 for this period. A melt multiplying heatwave that is predicted to push anomalies for the entire Arctic above +1.5 C beyond the early July average. A polar amplification similar to what is typically a winter manifestation of human emissions-driven anomalous warmth — this time anomalously occurring during a period when heat for the region is approaching peak intensity.

Impacts to Sea Ice Could Be Substantial

In the face of this oncoming weather, ice pack strength would be a deciding factor lending resiliency during melt-promoting conditions or a shift to a much more rapid rate of decline. Though some indicators, including a seemingly slower rate of decline during late June, may point toward more ice resiliency, a growing number of satellite reports and model analysis hint at a general and overall weakness throughout the ice pack.

This weakness can best be described as model indication of thin or low concentration ice, already widespread melt ponding, and visual indication of ice weakness in the satellite shot.

GLBb Holy Shit Model

(The US Navy’s GLBb model has always been unfriendly to sea ice. But other models are now starting to agree. Image source: US Navy.)

For low concentration ice, no model is more stark than the US Navy’s experimental GLBb sea ice thickness ensemble. I colloquially think of this as the ‘holy crap’ sea ice model. This label due to the fact that if sea ice state is really as bad as the model indicates, then the ice is basically toast. Starting in June, this model displayed a great overall weakness in the sea ice and, according to its analysis, the situation has progressed from bad to worse with most of the remaining Arctic Ice possessing a thickness of 1.2 meters or less. Easily thin enough for any nudge by weather to really start rapidly bringing the ice down and opening up very large expanses of open ocean.

If the GLBb ‘holy crap’ model were the only sea ice model making us want to say ‘holy crap!’ then we could probably breathe a bit easier. Unfortunately, another US Navy model is now also tending to elicit this response in reaction to its predictions for the next 7 days and more specifically for the next 3 days:

Arctic Sea Ice Concentration TodayArctic sea ice concentration forecast

(The US Navy’s ARCc sea ice concentration model predicts a very rapid rate of sea ice decline over the next few days. Image source US Navy.)

The top image in this up and down comparison shows the US Navy’s ARCc model’s interpretation of sea ice concentration for July 6 of 2015. Note the extensive green regions showing a 40-50 percent sea ice concentration. It’s a huge swath of ice including large sections of the Chukchi, the Beaufort the ESS, the Laptev, as well as remaining ice in the Kara Sea, and Baffin and Hudson Bay. Now watch what happens to those large sections of lower concentration ice from July 7 to July 10 in the ARCc model 30 day history and forecast summary. Almost all that green is wiped off the map. It’s like losing about 1 million square kilometers of extent and 600,000 kilometers of area in just 72 hours. Or about 10,000 square kilometers of ice per hour. A precipitous fall that would mark an extraordinary and likely unprecedented rate of loss should it emerge as the Navy model predicts.

But you know what they say about models — no model is perfect and every model ends up wrong in some manner or another. So the question here is — how likely is it that the Navy models could be correct or incorrect this time?

To try and tease this answer out we could also look at other sea ice concentration maps. Notably all the major ones including Cryosphere Today, Uni Bremen, and NSIDC currently show sea ice looking either thin or very thin. Specifically, Uni Bremen has shown some amazing contrast over the past 48 hours:

Uni Bremen July 5Uni Bremen July 6

(AMSR2 model analysis of sea ice surface state shows very rapid thinning in the Beaufort and Chukchi Seas during the past 24 hours. Image source: Uni Bremen)

The left image in the above comparison is from the AMSR2 model analysis for Arctic sea ice concentration on July 5. The right image is the same analysis but for July 6. Note the substantial change in the sea ice concentration for the Beaufort and Chukchi seas over just one day. A change that is consistent with the pulse of warm air and water riding up through the Eastern Pacific and through Alaska, the Bering and the Chukchi. Another holy crap moment, and not at all of the good variety. To say the least, a similar response north of Greenland and the CAA would be devastating.

Moving away from models and back to observations we find that from the satellite vantage the entire Arctic Ocean displays an ice pack in various shades of azure. By color analysis alone we can readily see that the 2015 ice (July 6 MODIS image) is far more melt pond embedded than 2014 or 2013. 2012 is a tough comparison due to NASA-MODIS’s format change from that year. But the widespread melt ponding alone hints at a reduced resiliency for the ice when compared with recent years.

Arctic Ice Pack July 6

(Arctic sea ice turns blue color characteristic of widespread proliferation of melt ponds on July 6. Also note very thin and diffuse sea ice in the Beaufort and Chukchi. Image source: LANCE-MODIS.)

Turning to the Chukchi and Beaufort, we see a visible confirmation of the weakness indicated in the US Navy and Uni Bremen models. Beneath the smoldering outflow of the Alaskan fires we can plainly see the decayed state of ice. The floes greatly disassociated with widening gaps appearing between diminishing ice clusters.

As satellite gives us an overall view of the Arctic from above, local observations can help provide a sense of the sea ice state at the surface. During recent years, cameras mounted on buoys throughout the Arctic have provided us with a first-hand account of the story of Northern Hemisphere sea ice decline. And during recent days almost every camera-based buoy has shown an extensive expansion of melt ponds and open water. (Extensive melt ponding extends as far north as the Pole).

In the swiftly thinning ice pack of the Beaufort even the contrast of a single day can be quite stark.

Beaufort Open WaterBeaufort Open Water Waves

(Warm storm kicks up under the gradient imposed by a building heat dome of the Arctic. Top and bottom frame provides a stark tale of impacts in just one 24-hour period. Image source: USIABP.)

In the above top-bottom comparison of RACS#2 ice buoy photos we find that wide but placid areas of sunlit open water in the Beaufort Sea on July 6th (top frame) have rapidly transformed to wind-driven 1-2 foot waves whipped up by 15-25 mile per hour winds on July 7th (bottom frame) in association with a tightening gradient around the strengthening high pressure in the Central Arctic. Waves of this kind can deliver a significant amount of melt forcing to the ice — mixing cooler surface waters with warmer waters below as well as rocking through the ice floes with a rain of incessant, ice-breaking blows.

Conditions in Context: Rapid Melt Likely On the Way

Increasing model agreement indicating rapid sea ice melt, observations of sea ice weakness via satellite and buoy based systems throughout the Arctic, and predictions of a substantial Arctic heatwave all point toward a high and rising risk of rapid sea ice melt. Larger global trends, particularly heat transport from the Equatorial Pacific all the way to the northern Polar zone through the mechanisms of El Nino, human based greenhouse gas heat forcing, and the associated Ridiculously Resilient Ridge, heighten this risk even further. Finally, a wide array of observations indicate that such rapid melt is already starting to set in. Given this increasing agreement and confluence, it appears that the late June ice dispersal is likely over and that serious trouble for Arctic sea ice has now set in and will remain in play for at least the next seven days.

Links:

The Arctic Sea Ice Blog

Cryosphere Today

Uni Bremen

NSIDC

The Polar Science Center

NOAA/ESRL

Earth Nullschool

US Navy

LANCE-MODIS

Hat Tip to Neven

Hat Tip to Frivolous

Hat Tip to Jim Hunt

Hat Tip to Climate Hawk


Greenland Melt Extent Breaks 50% on July 4; 2 Standard Deviation Line Shattered Yet Again

These days — in the age of the fossil-fueled hothouse — it’s never good news when a high pressure system forms over Greenland during Summer.

Human dumping of carbon into the atmosphere has forced warming over the last remaining great Northern Hemisphere ice sheet at a rate of about 0.5 degrees Celsius each decade. A constant rain of soot from human industry and from increasingly prevalent and intense Arctic wildfires has painted the ice sheet dark, lowering its ability to reflect 24 hours of incoming radiation from the Summer sun. And the result is that each Summer, when the skies clear and high pressure systems form over the ailing Greenland ice, you end up getting these huge surface melt spikes.

Greenland smoke

(Smoke from record Alaskan and Canadian wildfire outbreaks traverses Greenland and enters the North Atlantic on July 2 of 2015. Arctic wildfires are intensified by human-caused warming both through the mechanism of added heat and through the reintroduction of long sequestered carbon fuels through permafrost melt which aids in the initiation, intensification and extension of Arctic wildfire burn periods. In essence soil carbon in the form of thawed permafrost and related methane adds to boreal forest, tundra and bog as burn risks. Soot from these fires can then precipitates onto land and sea ice, reducing its ability to reflect the 24 hour Summer Arctic sun. Image source: LANCE MODIS.)

Generally a big melt spike can be defined as anything greater than 35 percent of Greenland ice surface area. And we’ve had quite a few of these abnormal events in recent years. The worst of which happened in mid Summer of 2012.

During late June and early July of that year, an extreme high amplitude Jet Stream wave generated very warm surface temperatures over the Greenland Ice Sheet. A very warm fog settled over the ice, eating away at it. By July 8th, more than 90 percent of the surface was melting — an event that hasn’t happened in Greenland for more than 100 years. June, July and August of 2013 and 2014 saw similar, though somewhat less intense, Greenland melt spikes. During those years the ice sheet experienced multiple days in which melt covered between 35 and 45 percent of its surface. And though these instances were not as intense as the unprecedented 2012 melting, they did traverse well beyond the 1981 to 2010 average line (an average that itself includes a rapid warming trend) to, in cases, exceed the upper 2 standard deviation margin.

Melting on Greenland surface 2014

(Record Greenland surface melt during 2012 compared to still strong surface melt years of 2013 and 2014. Image source: NSIDC.)

After record 2012 melt, surface melt for Greenland has remained abnormally high — indicating an increased likelihood that more near 100 percent surface melt summer days may not be too far off in the future. The post 2012 environment for Greenland has thus been a period of continued and heightened surface melt. One that appears to be in the process of building up to another big pulse.

50 Percent Melt Threshold Exceeded During July of 2015

The summer of 2015 marks a continuation and intensification of this ominous surface melt trend. After getting off to about an average melt start during April and May, June saw surface warmth build over the Greenland Ice Sheet with melt extents jumping to between 30 and 40 percent of surface area by mid-to-late month. Further warming coincided with massive Alaskan and Canadian wildfires injecting soot plumes into regional airspace and the building of a substantial high pressure ridge over Greenland. These factors helped enable further atmospheric and ice warming — shoving surface melt above the 50 percent line by July 4th.

Greenland melt extent 2015

(Major Greenland melt spike indicated on July 1-5 in the NSIDC surface melt extent graph. Image source: NSIDC.)

This puts 2015 Greenland surface melt in a range well above 2013 and 2014, with the first week of July already exceeding 2012 melt for that period.

Over the next seven days, models predict a larger warming of the overall Arctic environment even as a high pressure system and associated ridge remains entrenched across Greenland. This predicted weather pattern will tend to lock in significantly warmer than 20th Century average temperatures. That said, forecast highs do not yet indicate a substantial risk for a repeat of 2012’s near 100 percent surface melt. However, projected high temperatures do show some potential that melt percentages are likely to continue to range between 40 and 60 percent surface melt over coming days with the highest risk for melt spikes occurring on July 6th, 7th and 8th.

It is worth noting that we are now in the midst of a substantial Greenland melt spike, one that we’ll continue to monitor over coming days for further developments.

Links:

LANCE MODIS

NSIDC

Dark Snow

GFS Forecast Summary

Record Alaskan Wildfire Outbreak

Hat Tip to Wili

Hat Tip to Andy in San Diego

Hat Tip to Colorado Bob

Hat Tip to DT Lange

Half a Million Acres Burned in Just One Day — Alaska Shatters Record For Worst June Wildfire Outbreak Ever

All throughout the mainstream media last week we heard the same myopic litany — ‘a massive wildfire outbreak ongoing in Alaska is not abnormal.’ Well, today, all pretense that there was anything normal about the 314 wildfires still raging throughout the state has gone up in a cloud of boreal forest, tundra, and thawed permafrost emitted smoke.

As of 6:28 AM Alaska time today, 1,912,000 acres had burned in Alaska since the start of the year. That’s roughly 1,800,000 more acres burned than just before the current wildfire outbreak started on June 18th and 497,000 more acres burned over just the last 24 hour period alone. By comparison, the previous worst ever June fire outbreak for Alaska during 2004 burned less than 1,200,000 acres of the Arctic state.

Wildfires now burning in Alaska

(Alaska Interagency Center map of currently active wildfires now burning in Alaska.)

With 42 hours left in June and with more than 300 fires still active, it’s pretty clear that the current fire season is a historic, unprecedented, record-shattering event. One that will almost certainly break the 2 million acre mark and may show double the over-all previous record burning during June of 2004. An excessive new record that is occurring in the ominous context of the hottest year in the global climate record and a vastly irresponsible dumping of 50 billion tons of heat-trapping, CO2 equivalent (of which 32 billion tons is CO2) gasses into the atmosphere through fossil fuel burning and related industry each and every year.

As Alaska Experiences Worst Ever Burning for June, Northwest Territory Lights Up

As Alaska burned through half a million acres of forest in just one day, a massive heatwave was also setting off extreme wildfires throughout northwest Canada. It was the same heatwave that broke new temperature records all across Washington, and the mountain west. Temperatures in places like Walla, Walla Washington hit 113 degrees Fahrenheit (45 Celsius) on Sunday — breaking the previous all time June temperature record for the day by 4 degrees (2.2 C). A pulse of heat rising off the back of a strengthening El Nino in the Pacific, running all the way up the Western Seaboard and Mountains of the US and driving deep into northwestern Canada.

wildfires burning near great slave lake

(Massive plumes of smoke emitting from wildfires burning near Great Slave Lake in Northwest Territory, Canada on Sunday. For reference, bottom edge of frame is 350 miles. Image source: LANCE-MODIS.)

The added heat riled wildfires burning throughout much of the permafrost zone in Canada, pushing blazes to explosive size and dumping massive plumes of smoke into an atmosphere already heavily laden with Alaska’s brown carbon pulse. In the above LANCE-MODIS image we can see about 30 of these fires burning away near Great Slave Lake. Note that some of the fire fronts in the above image are more than 15 miles long.

Given the satellite assessment from yesterday, it appears that the same excessive heat, dryness and permafrost thaw that has set off record fires for Alaska during June is now also in play for Canada. Initial reports from Canada’ Interagency Fire Center confirm this assessment with 138 new fires erupting in just the past 24 hours alone and more than 2,250,000 acres burned for the country since the start of 2015. As a result of the excessive Arctic heat (associated with both El Nino and overall human warming) and extreme rate of new fire starts, we are at risk of seeing unpecedented wildfire conditions continuing to spread throughout this warming, vulnerable Arctic region.

UPDATE: Preliminary numbers for acres burned in Alaska, according to Interagency Center reports have been downgraded somewhat to greater than 1.6 million total acres burned. These totals are still in record range with between 200,000 to 300,000 acres burned each day. It seems, given the unprecedented number and intensity of fires now burning (currently 300) in AK that there’s some difficulty getting an accurate assessment of conditions on the ground. The downgrade is somewhat good news in light of an overall difficult and record fire season for Alaska. Will keep updating as new information becomes available.

Links:

Alaska Interagency Coordination Center

Alaska Forestry Service Facebook Page

Canada Interagency Forest Fire Center

Over A Million Acres Burned in June

NASA LANCE-MODIS

113 in Walla, Walla? Historic Washington Heatwave Shatters Records

Hat Tip to Andy in San Diego

Hat Tip to Colorado Bob

Hat Tip to Greg

Hat Tip to DT Lange

(Please help support public, government-funded climate change resiliency efforts like those aided by various interagency fire centers within the US and Canada in addition to the critically valuable satellite tracking provided by the amazing scientific and research teams at NASA.)

Hot Blob #2 Takes Aim at Sea Ice — Abnormally Warm Waters Invading the Arctic Through Bering and Chukchi

A lot of attention has been paid to a ‘Blob’ of unusual warmth at the ocean surface in the Northeastern Pacific. And for good reason, for that Blob of human-warmed water has had wide-ranging negative impacts on both weather and sea life. Now there’s a second hot Blob forming in the Bering and Chukchi seas. One that may also have some rather significant effects as the summer of 2015 continues.

Abnormally Warm Waters Running Toward the Sea Ice

Hot Blob #2 is a vast stretch of warm water covering the Bering and Chukchi seas between Alaska and Kamchatka (Neven, in his most recent sea ice summary, touched on this building warm water zone here). It encompasses surface waters in an usually frigid region that now feature temperatures ranging from 3 to 5.5 degrees Celsius above normal. Covering an area roughly 800 miles in diameter, this pool of outlandishly warm ocean waters is being fed by currents running up from the south and by heat bleeding off Alaskan and Siberian land masses. In this case, land masses that are also experiencing record heat.

image

(Hot Blob #2 forms in the Bering as its warm waters are swept north toward the Arctic sea ice pack. The above sea surface temperature anomaly map shows a broad stretch of much hotter than typical surface waters being pulled poleward by prevailing ocean currents. Image source: Earth Nullschool.)

Though the abnormal warmth is also likely fed by a powerful albedo switch from white, reflective sea ice, to dark, sunlight absorbing ocean, other factors associated with El Nino and related to the hot blob off the North American West Coast are also likely in play. And of particular interest in this present extreme hot water situation are currents flowing northward out of these warm pools and directly into the Arctic. Currents that have been eating away at the ice since winter.

One warm water bearing current — the Alaskan Coastal Current — runs directly out of the abnormally hot surface zone in the Northeastern Pacific (Blob #1). This current flows along the North American Continental Shelf, out past the Aleutian Island Chain and finally up into the Bering Sea. A second current — the Siberian Coastal Current — feeds into the Bering from the Asian Continental Shelf. These currents then combine and push Bering Sea waters on through the Bering Strait and up into the Chukchi Sea.

Algae bloom hot pool

(Algae blooms, like this one in the Chukchi Sea just south of the ice pack, have been a common feature of the Pacific Ocean hot pools. The warmer waters are a preferred environment for microbes which can see some amazingly rapid population explosions. If the blooms become too numerous they can rob the ocean surface waters of nutrients and die off en masse. The decay of dead masses of algae can then leech away the oceans’ life-giving oxygen, setting off and contributing to a chain of harmful ocean anoxia. In a warming world, this process, combined with disruption of ocean currents and the basic fact that warmer waters bear less oxygen in solution, is a major contributor to mass extinction events. Image source: LANCE MODIS.)

Northward propagation of these currents during spring and summer plays a critical role in the rate of sea ice recession in the Bering, Chukchi, Beaufort and East Siberian Seas. Waters warmed by the summer sun and by the more rapidly heating continents amplify in the Bering Strait before making contact with the sea ice and pushing it to melt and recede.

Impacts Already Visible Up the Coast

This year, waters in the Strait are extraordinarily warm — measuring 5.4 degrees above normal surface water temperatures. A plug of 5 C + above average water entering the Chukchi, Bering, Beaufort and East Siberian seas at a time when solar insolation is hitting peak intensity and during a period when nearby Arctic regions like Alaska are experiencing some of their hottest temperatures ever recorded. These waters, at temperatures in the range of 7-8 degrees Celsius, are warm enough to rapidly melt any ice they contact. And they’re flooding directly toward the ice pack.

Barrow Alaska

(Ice rapidly melting off of Barrow, Alaska on June 23, 2015. Ice is seen receding from the near shore zone even as the ice pack further out breaks into dark blue patches of open ocean. Image source: Barrow Ice Cam.)

Unusually warm surface water and air temperature impacts can already be seen further down the coast in places like Barrow, Alaska. Today, near shore sea ice dramatically melted and off-shore sea ice has retreated poleward — revealing the tell-tale blue of open ocean in the distance. An extreme one day change for Barrow sea ice, which only featured melt ponds and some near-shore melt 24 hours before.

Conditions, Model Runs Point Toward Substantial Thinning

Looking northward, we find ice pack conditions showing substantial thinning, significant melt pond formation over the surface ice and increasingly disassociated ice flows in the Beaufort, Chukchi, and East Siberian Seas. Near shore ice in the East Siberian Sea (ESS) has taken on a vivid blue or glassy appearance indicative of melt pond formation. Melt and compaction wedges have formed in the ESS along an axis pointing toward the pole. In the Chukchi, sea ice recession and thinning appear to be proceeding quite rapidly, while dispersing ice in the Beaufort is hitting warmer surface waters, fed by Mackenzie River outflow, and melting.

Navy ARCc Model Run

(The ARCc model run shows rapid thinning in the Beaufort, Chukchi and ESS through June 30. Image source: US Navy.)

The Navy’s ARCc historic and forecast model run for May 30 through June 30 shows rapid thinning of sea ice in the affected regions. The forecast run for the next seven days shows extreme thinning continuing through the ESS and Chukchi, with thicker ice in the Beaufort also experiencing substantial reductions (Note that the Navy’s GLBb model runs look even worse).

Overall, given the fact that storms are now ranging through substantial sections of the Arctic, pushing for more sea ice dispersal, losses will tend to show up more in the sea ice area and volume measures first. Dispersal will also tend to mute extent losses for a time. Given the delay in area and volume tracking, it’s likely that overall impacts to sea ice will tend to be muted in the measures over coming days with a clearer signal showing up by late June and early July. But despite these underlying and complicating weather conditions, the fact remains that a lot of unusually warm water is heading northward toward the ice, with likely greater impacts to follow.

Links:

Earth Nullschool

US Navy

Barrow Ice Cam

The Arctic Ice Blog

A Deadly Climb From Glaciation to Hothouse

Awakening the Horrors of the Ancient Hothouse — Hydrogen Sulfide in the World’s Warming Oceans

Hat Tip to Colorado Bob

Hat Tip to Ouse MD

Arctic Sea Ice Conditions Worsen, Nightmare Melt Scenario in the Works?

It’s the end of a bad week in a bad month in a bad season in the all-too-bad, human-heated, era for Arctic sea ice. As of the middle of this week, both the US measure — NSIDC — and Japan’s measure — JAXA — were showing record low daily sea ice extents. The lowest levels in the history of Arctic sea ice observation for this time of year and likely the lowest levels for hundreds, even thousands of years.

As charts go, the JAXA graphic looks pretty amazingly ominous. A 2015 sea ice extent line diving below all others, steadily plumbing an abyss that, if not this year or the next, could lead to a dreaded blue ocean event in the not-too-distant future. The kind of upshot from human greenhouse gas emissions we thought we might see by 2080 or later. One that has become increasingly more likely during recent years and that some researchers are expecting could emerge by before 2020.

Sea ice extent

(JAXA sea ice measure plunging to new record lows on May 22 and now hitting a very steep angle of decline. Image source: JAXA Polar Research.)

Above you can seen the 2015 red line taking its most recent plunge after hovering very near to record low levels. According to JAXA’s Polar Research Center, sea ice extent dropped like a stone to 11.44 million square kilometers yesterday, or about 200,000 square kilometers lower than the previous record low value set in 2006.

Divergence in May

The problem is not just one of a new record low. It’s one of timing and divergence. Accelerated melt in the May-to-June time-frame can have serious impacts on late season ice. The reason is that greatly reduced ice coverage also reduces albedo or reflectivity. The result can be compounded warming and increased heat absorption by darker surfaces under the 24 hour Arctic sunlight of June and July.

Large open stretches of ocean also enable swell formation, which can chew away the ice. And already we can see very large sections of dark, low albedo, ocean forming throughout many vulnerable regions.

Arctic ice visual May 22

(MODIS satellite shot shows widespread regions of open ocean and far northward melt advance for this time of year. Image source: LANCE-MODIS.)

For this time of year, we have very advanced sea ice loss and open ocean development in the regions of the Chukchi, the Beaufort, Northern Baffin Bay and the Kara. In addition, large open water areas are now becoming visible in the Laptev. A far northern extent of sea ice melt for May in addition to typical seasonal losses coming from Hudson Bay and southern Baffin Bay.

Such record low ice totals at this time of year can enable far greater melt advance by end season if the weather stacks up in all the wrong ways. And, at least for the next week, the weather forecast is tilting ever more heavily toward a melt-enhancing extreme warming of Arctic regions.

Arctic Warm Air Invasion Forecast to Continue

Over the next seven days, heat is predicted to continue to flood from south to north — goaded along by high amplitude ridges in the Jet Stream continuing to form over Northwestern North America and the Siberian region adjacent to the Kara Sea. The warm flux zones are forecast to deliver unseasonable, above average temperatures to the Arctic — resulting a general state of much warmer than normal conditions for the entire Arctic Ocean by late next week.

Air Temperature Anomaly ArcticAir Temperature Arctic May 29

(Side-by-side comparison of Arctic temperature anomaly forecast [left] and 2 meter temperature forecast [right] for May 29, 2015 in the GFS model run as provided and graphically displayed by Climate Reanalyzer. It’s worth noting that such extreme anomalies are very unusual for Arctic Ocean regions during late spring and summer.)

As a result, we see temperature anomalies for the entire Arctic Ocean zone hitting a range of between 5 and 15 degrees Celsius above average for next Friday (May 29, 2015). Such a warm air surge would push temperatures in the above freezing range for almost the entire Arctic Ocean area. These are temperatures more typical of late June and early July. Conditions that, should they emerge, would result in a multiplication of ice-threatening melt ponds, a further expansion and warming of already unseasonably large open water zones, and a forcing of more ice-eating, high heat content water vapor into the Arctic environment.

Any forecast is subject to uncertainty. Rapid May melt during 2013 and 2014 stalled out during June of those years. However, May melt is significantly more advanced this year than during those years. And, as opposed to 2013 and 2014, GFS model forecasts showing warmer than normal conditions have tended to be correct. The warm air slots over Northwest North American and Western Siberia are also very well established at this time.

Melt Ponds Barrow May 22

(Snow cover gone, melt ponds plainly visible at Barrow Alaska today. Proliferation of melt ponds during May and June can greatly enhance risk of record low totals come August and September. Image source: Barrow Sea Ice Cam.)

As a result, there’s high risk that the current record lows now appearing in the NSIDC and JAXA measures with continue to deepen over the coming week. It’s an utterly wretched situation for sea ice in the Northern Hemisphere. One that will bear very close watching as the risks now appear to be heading toward some unsettling markers.

Links:

NSIDC Arctic Sea Ice

JAXA Polar Research Center

LANCE-MODIS

Climate Reanalyzer

Barrow Sea Ice Cam

From Siberia to British Columbia Arctic Wildfires Begin an Ominous Ignition

It’s abnormally warm today near Great Slave Lake, Northwest Territory. And the smell of smoke from massive fires to the west lingers in the air.

Temperatures there yesterday afternoon read 80 degrees Fahrenheit. Where I sat typing this blog in Gaithersburg, Maryland, it was a somewhat cooler 67. A north-south temperature flip-flop that has become all-too-common in recent years. A warming in the Arctic that sets the stage for gargantuan summer wildfires burning through some of the world’s greatest carbon stores. Vast and thawing permafrost deposits stretching in a great arc from Siberia through Alaska and on into Northern Canada. Immense loads of fuel for a newly forming ring of fire that is now an entirely human invention.

image

(It was pretty darn hot near Great Slave Lake, NWT territory Wednesday. 80 degree readings in a polar region that, on average, should be in the mid 40s as a daily high for May 13. Image source: Earth Nullschool.)

Now, fires are starting to flare around this broad stretch of once-frozen lands rapidly warmed by an unprecedented belching of heat-trapping gasses into the Earth’s atmosphere. Though the fires are not yet widespread, many are rather large — erupting over a smattering of areas. It is not typical for large fires of this kind to appear at all in May. Nor is it usual to find them in regions girding the Arctic at this time.

Lake Baikal Fires Still Burn

The first set of blazes ignited during mid April of 2015 through a permafrost zone in the Lake Baikal region of Russia. Though the fires appear to have backed off from the towns and settlements they threatened at that time, they have continued to burn unabated — fading and flaring more than most of the past month.

Lake Baikal Wildfires

(In the above MODIS satellite shot from NASA we see numerous fires still burning near Lake Baikal in Russia. Note the multiple dark burn scars covering vast stretches of land near upper center frame. For reference, the larger, still burning fires in this shot range from about 3-8 miles wide. Image source: LANCE-MODIS.)

As the more southerly fires continued to burn through thawing permafrost zones, blazes began to erupt further and further north. As of this week, the fires have marched to the shores of Lake Baikal itself, scorching their black scars in the Earth like some great fire giant’s footprints.

Wildfires in Central Siberia

Leaping over Lake Baikal and moving north and westward we come to the great open spaces of Siberia. Here, in recent years, vast fires have burned through grass, forest and permafrost alike. Few settlements dot the wide expanses. So fire suppression efforts have only rallied when towns and cities were threatened. Meanwhile, the once frozen regions all about have increasingly caught fire. Turning the place into a land of summer flame.

Central Siberian Fires

(Fires igniting along valleys and ridge lines in Central Siberia. Image source: LANCE-MODIS.)

By Wednesday, a quartet of significant fires had erupted along a hilly region in Central Siberia. Tuesday, there was but a single blaze. Now four rage across a region that has felt an extraordinary warming not only this year, but for a long succession of years now stretching on for many decades.

Beyond these newly emerging fires, we begin a pass over the wide open plains of Siberia. There we note a tell-tale whiff of smoke or three. But no large burn points are visible in the moderate resolution satellite shot. Continuing on to just south of Yamal, Russia where the odd methane blow holes first appeared last summer we find a region still mostly frozen. But thaw is predicted to come quickly — coincident with a rapid warm up forecast for the next week.

Norman Lake Fires British Columbia

Shifting still westward we cross over Northern Europe, the Atlantic, a thawing Hudson Bay and return to where we started our narrative in Northwest Territory Canada. To near 80 degree Fahrenheit temperatures at Great Slave Lake. And to a thick cloud of smoke issuing up from the nearby valleys of Northern British Columbia.

Norman Lake Wildfire

(Norman Lake Fire in the MODIS satellite shot on Wednesday, May 13. Image source: LANCE-MODIS.)

There, near Prince George, at Norman Lake, a massive wildfire erupted earlier this week. Unable to contain it, more than 100 firefighters and numerous helicopter and heavy equipment crews quickly found themselves fighting a defensive battle against a rapidly expanding blaze. By this morning, the Norman Lake fire had more than quadrupled to 80 square kilometers in size. Indications from the above satellite shot are that the fire is still growing.

The massive blaze forced two regional districts to issue evacuation orders or alerts and more than 80 people to evacuate residences. Meanwhile, B.C. has closed its Dahl Lake and Bobtail Mountain provincial parks until further notice.

Conditions in Context

For wide stretches of the Arctic, especially in Central Siberia and Western Canada, winter heat and early spring melt are contributing to a very high risk of wildfires. In addition, the decadal warming forced by human-caused climate change is thawing ever greater portions of permafrost, which also adds near surface fuels to traditional brush and woodlands fires.

The early and intense fires we are seeing now represent just the beginning of what is likely to be an extreme fire event for these regions. At this point, we are looking at a worsening fire potential stretching from now through mid September for these vulnerable Arctic zones.

Links:

LANCE-MODIS

Earth Nullschool

UPDATE: Wildfire South of Norman Lake Now 8000 Hectares in Size

Siberia’s Road to a Permaburn Hell

Sea Ice Testing New Record Lows as Heat Wave Invades Northwest Territories

For 2015, it looks as if Arctic sea ice is sitting in some rather hot water.

For from the Chukchi to the Beaufort to Hudson Bay to Baffin Bay and on into the Kara, the edge region of the Arctic Ocean is feeling a very strong melt pressure during early May of 2015. And, according to 7-10 day forecasts, that melt pressure will only intensify. As a result, we could see new record lows for Arctic sea ice extent over the next few days.

Early Melt for the Chukchi and Beaufort

Arctic warming is now particularly intense along a broad region running from coastal Alaska through to the Mackenzie Delta and on into the northwestern portion of the Canadian Archipelago. It’s an area that typically waits until at least June to melt. But, this year, sea ice recession, break-up and opening of large polynyas for this far northern area is occurring almost in tandem with melt in more southerly regions like Hudson Bay.

For both the Chukchi and Beaufort Seas are continuing an early melt that began in March and has proceeded on to this day.

Chukchi melt may 11

(Chukchi Sea north of the Bering Strait showing early melt and break-up on May 11, 2015. Image source: LANCE-MODIS.)

In the image above we can see the MODIS satellite shot for the Chukchi Sea region on May 11, 2015. Note both the fractured nature of sea ice, the ice edge retreat that has already progressed well past the Bering Strait (a retreat far beyond a steadily retreating average extent line), and the very large polynya advancing into the Chukchi along the northern edge of Alaska.

It’s a melt that has been spurred by powerful southerly air flows and wind-driven currents issuing from the Bering Sea and Pacific Ocean to the south. There, a cluster of storms continued to back up and deflect northward toward the Arctic as powerful high pressure ridges remained entrenched over a pool of record warm water in the Northwestern Pacific.

Beaufort melt may 11

(Beaufort Sea ice near Mackenzie Delta showing advanced signs of break-up on May 11 of 2015. Image source: LANCE-MODIS.)

These same ridges are driving warm air up over the western region of the North American Continent. This flood of warm air has persistently invaded the Northwest Territory of Canada, forcing an early melt of the Mackenzie River. The heat has also frequently invaded the southern Beaufort Sea. The result is that the sea ice there is greatly fractured and that a large polynya dominates a wide area bordering Alaska, the Mackenzie Delta, and the Canadian Archipelago.

This polynya extends about 650 miles, has a width ranging from 15 to 80 miles and stretches 250 miles into the Canadian Archipelago between the Northwest Territory mainland and Banks and Victoria Islands. Many hundreds of miles to the north and east of this large polynya, is a mess of fractured ice rippling out through the Beaufort Sea. A massive disassociated ice flow that belies great general weakness for sea ice in the region.

Risk of Rapid Melt

As melt season progresses, these wide, dark areas of open ocean will serve to trap the radiant heat of 24 hour sunlight. The expansive stretches will generate swells that tear away at the surrounding ice. Already fractured ice flows will retain far less integrity than the contiguous, and far thicker, ice of years past. These combined factors set up conditions that can greatly enhance and speed the rate of ice loss as the spring advances into summer.

Arctic Sea Ice Extent May11

(NSIDC shows sea ice extent at second lowest on record for May 11, 2015. Rate of decline implies a plunge toward the 2006 record low line. Image source: NSIDC.)

This risk is particularly relevant when we consider that sea ice extent measures were at record low values throughout about half of March and for brief periods during early April. Currently, sea ice extent is at its second lowest level on record. A value that is now rapidly plunging toward the record low line set in 2006. Any continuation of the current rate of decline would bring the extent measure into new record low territory over the next few days.

A weekly continuation of this trend could push extent values far into record low territory, further worsening sea ice prospects for the broader 2015 melt season.

GFS 7 day Arctic Warmth

(7 day forecast shows Arctic heatwave building through the Northwest Territory. Image source: Climate Reanalyzer.)

To this point, 7 day forecasts predict a massive warm-up building over Alaska and the Northwest Territory through May 19th. Temperatures over land in this area are expected to build into the 70s and low 80s. This extreme warmth, in the range of 10-20 Celsius above average (18 to 36 Fahrenheit), will stretch all the way to Arctic Ocean shores off the back of a ridiculously resilient ridge in the Jet Stream. A ridge that has persisted, off and on, for much of the past three years. Above freezing temps will pulse out from the ridge to cover most of the Chukchi and almost all of the Beaufort — adding melt pressure to already fragile sea ice conditions for that region.

Links:

LANCE-MODIS

NSIDC

Climate Reanalyzer

Arctic Warmth Melting Greenland In October

greenland_melt_nomelt oct 8

(Anomalous late season melt for Greenland along the coastal regions both north and south. Image source: NSIDC.)

It’s Fall in the Arctic. Temperatures are dropping. Sea ice is expanding. Snow and frigid weather slowly advance through these extreme northern lands.

But the pace of cooling this year — as in recent years — is far slower than what we would have typically seen just a few decades ago.

For in a crescent encircling the North Pole from the Laptev Sea through the Beaufort through the Canadian Archipelago and on into Greenland, temperatures are ranging between 5 and 12 degrees Celsius above average (9-20 degrees F). This extra atmospheric heat has tipped the entire Arctic into a +2.3 positive temperature anomaly — a rather high range for so early in the season. A strong polar amplification evident well in advance of a winter which is likely to see total positive anomalies reach between 3-6 C for the entire Arctic.

October 9 GFS Anomaly

(GFS temperature anomaly map for October 9 of 2014 shows the world at a very hot +0.69 positive anomaly above the already hotter than typical 1979-2000 average. Arctic anomalies now average +2.3 C with spikes in the range of +12 C for some locations. Note the +3-11 C hot spot over Greenland. Image source: University of Maine.)

The oceans are bleeding record or near record heat into the Arctic atmosphere. The thinned sea ice, in the range of 6th lowest on record, allows more of that heat to hit the air. High amplitude waves in the Jet Stream deliver more heat than ever before from the lower latitudes.  An a heavy overburden of greenhouse gasses — at even higher concentrations than in the rest of the world — traps more and more long wave radiation trying to escape into space as the sun’s angle lowers and the long winter night approaches.

For many regions of the Arctic, what this means is more Summer-like conditions continuing on into Fall. For Greenland, this has meant levels of melt that are more than two standard deviations outside the norm for the month of October.

Greenland Still Melting in October

Over Southern Greenland, we’ve seen temperatures in the range of 10 to -14 C from the coastline to the top of the ice sheet. And over Northeastern Greenland, we still see temperatures approaching freezing — an up shot of the warm air and water pool in the ocean zone between Greenland and Svalbard.

As a result of this lingering warmth, NSIDC measures are showing melt through substantial zones — one around the western coastal region near the Jackobshavn Glacier and another in Northeast Greenland in the Zachariae Glacier outflow region. Pushing melt totals more into the range of what is typical for either late May or early September.

greenland_melt_area_plot oct

(Greenland melt plot for 2014 showing 3-4 percent of the ice sheet melting during early October. A rate of melt outside the 2 standard deviation range and one that is highly atypical for this time of year. Image source: NSIDC.)

Throughout the next couple of days, unseasonal warmth is expected to build back into Southern Greenland and to possibly take root in the northwestern coastal region. With 5-18 C above average temps expected for many areas, it is likely that the abnormal Greenland melt will continue for at least the next couple of days.

As noted above, conditions remain in place for the Arctic to continue to experience highly abnormal warmth as Fall continues its advance into winter — with warmer than normal temperature departures likely to peak coincident with the deepest periods of Arctic darkness.

Links:

University of Maine

NSIDC

Hat Tip to Andy

The Arctic Methane Monster Exhales: Third Tundra Crater Found

Yamal Hole

(One of three massive holes found in Siberia. The prominent theory for the holes’ formation is a catastrophic destabilization of sub-surface methane under thawing tundra. Image source: The Moscow Times.)

Add salt, sand, and thawing methane pockets buried beneath scores of feet of warming permafrost together and what do you get? Massive explosions that rip 200-300 foot deep and 13-98 foot wide holes in the Siberian earth.

The name for the place where this strange event first happened, in Russian, is Yamal, which roughly translates to mean ‘the end of the Earth.’ Now, three holes of similar structure have appeared over a 700 mile wide expanse of Siberian tundra. The most likely culprit? Catastrophic destabilization of Arctic methane stores due to human-caused warming.

A Tale of Dragon’s Breath: How the Yamal Event Likely Unfolded

About 10,000 years ago, as the great glaciers of the last ice age gave up their waters in immense surges and outbursts into the world ocean, a broad section of Siberian tundra was temporarily submerged by rising seas. But with the loss of the great glaciers, pressures upon the crust in these zones subsided and, slowly, the newly flooded tundra rose, again liberating itself, over thousands of years of uplift, from the waters.

The land remained frozen throughout this time, covered in a layer of ice — solid permafrost hundreds of feet deep. But the oceanic flood left its mark. Salt water and sand found its way into cracks in the icy soil, depositing in pockets throughout the frozen region’s earth.

And there this chemical brew remained, waiting to be deep-frozen and sequestered as the glaciers of a new age of ice advanced over the Earth.

Arctic Warming Trend 1960 to 1990

(Arctic warming trend from 1960 to 1990. Image source: NOAA.)

But this event, foretold and anticipated in the bones of Earth, did not come to pass. Instead, human beings began dumping billions of tons of heat-trapping carbon into the atmosphere. They dug up mountains of ancient carbon and burned it. And now those mountains of carbon lived in the air, thickening it, trapping heat.

For Siberia, this meant rising temperatures. At first, the increase was slow. Perhaps a tenth of a degree per decade. But by the time the 20th Century was closing and the 21st Century emerged, the pace of warming was greater than at any time even the Earth could remember — an increase of 0.5 degrees Celsius or more every ten years.

Now, the glaciers will probably not return for hundreds of thousands of years, if ever. And now, the brew that was waiting to be buried is instead thawing and mixing. A deep, heat-based cracking of the frozen soil that flash-bakes an alchemical mixture deposited over the ages. The result: dragon’s breath erupting from the very soil.

Explosive Eruptions From Smoking Earth

One Taz District local described the day the crater formed–

The earth was first observed to smoke. This continued for some time and then a bright flash followed by a loud bang exploded above the tundra. After the mists and smoke cleared, a large hole surrounded by mounds of ejected soil was visible. The hole tunneled like a cone more than 200 feet down. Its walls were frozen permafrost.

Siberian Craters Map

(Broad expanse of Siberia containing three massive holes, indications of explosive eruptions in the permafrost set off by thawing methane mixed with salt, water and sand. The holes are all in the range of 200-300 feet deep. Deep enough to contact subsoil methane pockets or, in some cases, frozen clathrate. Image source: The Daily Mail.)

A single event of this kind might be easy to overlook as an aberration. A freak case that might well be attributed to unique conditions. But over the past two weeks not one, not two, but three large holes, all retaining the same features, have appeared within the same region of Yamal, Russia.

A single event may well be easily marked off as a strange occurrence, but three look more like the start of a trend.

Weather Underground notes:

The holes may foreshadow bigger problems for our planet in the near future, scientists worry. Permafrost around the Arctic contains methane and carbon dioxide, and both could be dangerous to our environment if released, according to a report from the National Snow and Ice Data Center. As long as the permafrost remains frozen, the report adds, this isn’t a concern, but climate models have painted a grim future for rising temperatures in the Arctic.

And with temperatures in the Arctic, and especially over Siberia, rising so fast, the permafrost is not remaining frozen. It is instead thawing. And together with this thaw comes a growing release of carbon stored there over the 2-3 million year period since the ice ages began their long reign. It is a release we can expect to continue together with human-caused warming. One that is critical to abate as much as possible, if we are to have much hope for a climate favorable for human beings and the continuing diversity of life on this world. How rapidly and violently the Arctic responds to our insults depends on how hard we push it. And right now, through an amazing human carbon emission, we are now pushing the Arctic very hard.

Jason Box, a prominent Arctic researcher and head of the Dark Snow Project, noted Sunday in his blog, Meltfactor:

What’s the take home message, if you ask me? Because elevated atmospheric carbon from fossil fuel burning is the trigger mechanism poking the climate dragon. The trajectory we’re on is to awaken a runaway climate heating that will ravage global agricultural systems leading to mass famine, conflict. Sea level rise will be a small problem by comparison. We simply MUST lower atmospheric carbon emissions. This should start with limiting the burning of fossil fuels from conventional sources; chiefly coal, followed by tar sands [block the pipeline]; reduce fossil fuel use elsewhere for example in liquid transportation fuels; engage in a massive reforestation program to have side benefits of sustainable timber, reduced desertification, animal habitat, aquaculture; and redirect fossil fuel subsidies to renewable energy subsidies. This is an all hands on deck moment. We’re in the age of consequences.

If the warming trends continue and fossil fuel burning does not abate, these holes may be only minor explosive outbursts compared to what may follow. In any case, given current trends, it appears entirely possible that more and more of these strange holes will be appearing throughout the Arctic. An ugly sign of the danger inherent to our time.

Links:

Another Siberian Hole Discovered

Not So Mysterious Hole Found in Siberia

Two New Holes Appear in Siberia

Is the Climate Dragon Awakening?

Siberian Tundra Holes are a Mystery to Me

Is this the Compost Bomb’s Smoking Gun?

It’s All About Frozen Ground

Arctic Climate: A Perspective For Modeling


Constant Arctic Heatwave Sends World’s Largest Ice Cap Hurtling Seaward

Svalbard. Until lately, a little-known locale situated between the previously frigid extreme North Atlantic and the Arctic Ocean about 500 miles east of Greenland. Typically a frozen island Archipelago, this pristine and sparsely inhabited redoubt has, over the past few years been ground zero for the assaults of an ongoing and extreme polar heat amplification.

During winters, temperatures in Svalbard are generally, well, Arctic. But in recent years abnormal winter warmth featuring temperatures ten, twenty, even thirty degrees above 20th century averages have been experienced with increasing frequency. This year, during one of the warmest winters on record for the Arctic, local Svalbard temperatures rocketed to as much as 40 degrees F above the usual range and for extended periods remained in the range of +20 to +30 F positive anomaly.

For all of February of 2014, the average temperature for this Arctic island chain was -1 C (about 30 F), a full 15 degrees C above average and a period that featured many readings at or above freezing. It was an unprecedented event for an island that features one of the largest ice caps on Earth.

Austfonna, Svalbard’s Ice Giant, Takes a Fall

Austfonna sprawls across the northeast section of Nordaustlandet, one of Svalbard’s many islands. The ice cap covers fully 8,000 square miles and features an ice dome pinnacle looming 750 meters high making it the largest of its ilk. Though not as grand as the great ice sheets of Greenland or West Antarctica, Austfonna still contains an immense amount of water. Less stable than ice sheets, deteriorating ice caps currently contribute to almost 50% of global sea level rise.

Austfonna Sentinel 1 Pace of Outlet

(ESA’s Sentinel provides false-color imagery of the Austfonna Ice Cap sliding into the Barents Sea. Right panel imagery provides observed changes in outlet speed from 1995, 2008, and 2014. Flow rates are indicated by color contour as slow [dark blue] to fast [red]. Image source: ESA via BBC.)

But Austfonna, the largest of these, was thought to be somewhat insulated from the insults plaguing most of the world’s ice caps. Its far northern and previously frigid location at Svalbard made it less vulnerable. But that was before sea ice loss opened the gates to an ongoing and ever-increasing assault of warm winds.

Now, according to findings made by the European Space Agency’s (ESA) Sentinel 1 Spacecraft, it appears that the ongoing assault of heat has at last destabilized the great Austfonna. For according to radar altimetry readings, the pace of the ice cap’s motion toward the Barents Sea has, over the past three years, accelerated to an extraordinary speed ten times more rapid than its previous pace (Sentinel’s findings are due to be published soon in a prominent scientific journal).

Lead study author Prof Andy Sheperd of Leeds University notes:

“We’ve observed Austfonna with various satellite radar datasets over the past 20 years, and it hasn’t done very much. But we’ve now looked at it again with the new Sentienl-1a spacecraft, and it’s clear it has speeded up quite considerably in the last two or three years. It is now flowing at least 10 times faster than previously measured.”

Austfonna is just the most recent of many very large ice caps, ice sheets, or glaciers now showing increasing rates of motion toward the world ocean. In many cases, once destabilized, these great bodies of frozen water have reached a point of no return as they lunge toward an inevitable destiny of melt, outflow, and disintegration. The most recent and ongoing rash of destabilizations are likely to have significant implications for global sea level rise due to human caused warming going forward. And with human heat forcing and amplifying Earth System feedbacks still on the rise, the glacial butcher tally isn’t likely to end any time soon.

Links

Sentinel Spies Ice Cap Speed-Up

Arctic Heat in Winter: February 2 Temperature Anomaly Hits + 13 F For Entire Arctic

ESA

Warm February Provides Extreme Record on Svalbard

Hat tip to Colorado Bob

Sea Ice Loss, Human Warming Places Earth Under Ongoing Fire of Severe Weather Events Through Early 2014, Likelihood of Extremes For Some Regions Increases by 500%

Heat overburden at the roof of our world. It’s a dangerous signal that the first, worst effects of human-caused climate change are starting to ramp up. And it’s a signal we are receiving now. A strong message coinciding with a world-wide barrage of some of the worst January and February weather extremes ever experienced in human reckoning.

An Ongoing Arctic Heat Amplification

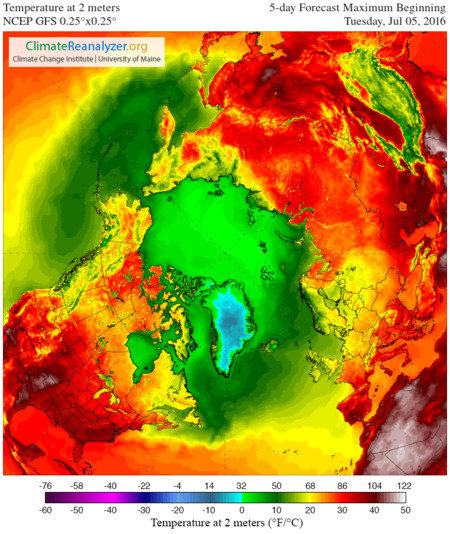
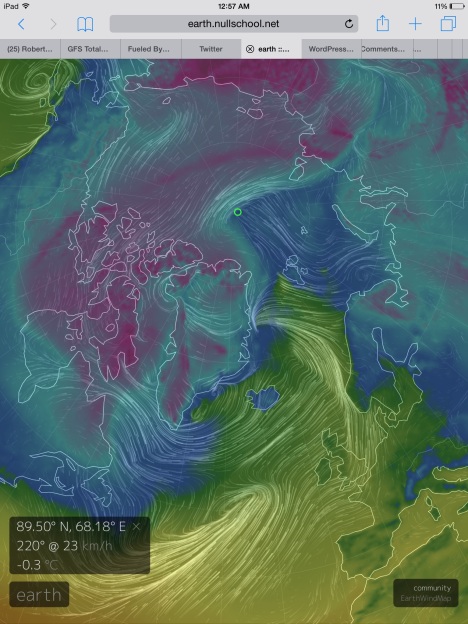
Ever since December, the Arctic has been experiencing what could well be called a heat wave during winter-time. Average temperatures have ranged between 2 and 7 degrees Celsius above normal winter time readings (1979-2000) over the entire Arctic basin. Local readings frequently exceed 20 degrees Celsius above average over large zones that shift and swell, circulating in a great cloud of abnormal warmth around the roof of the world.

Today is no different.

Global Temp amomaly March 4

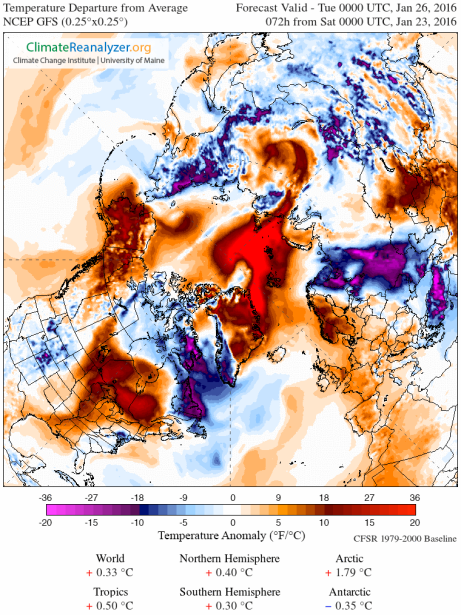
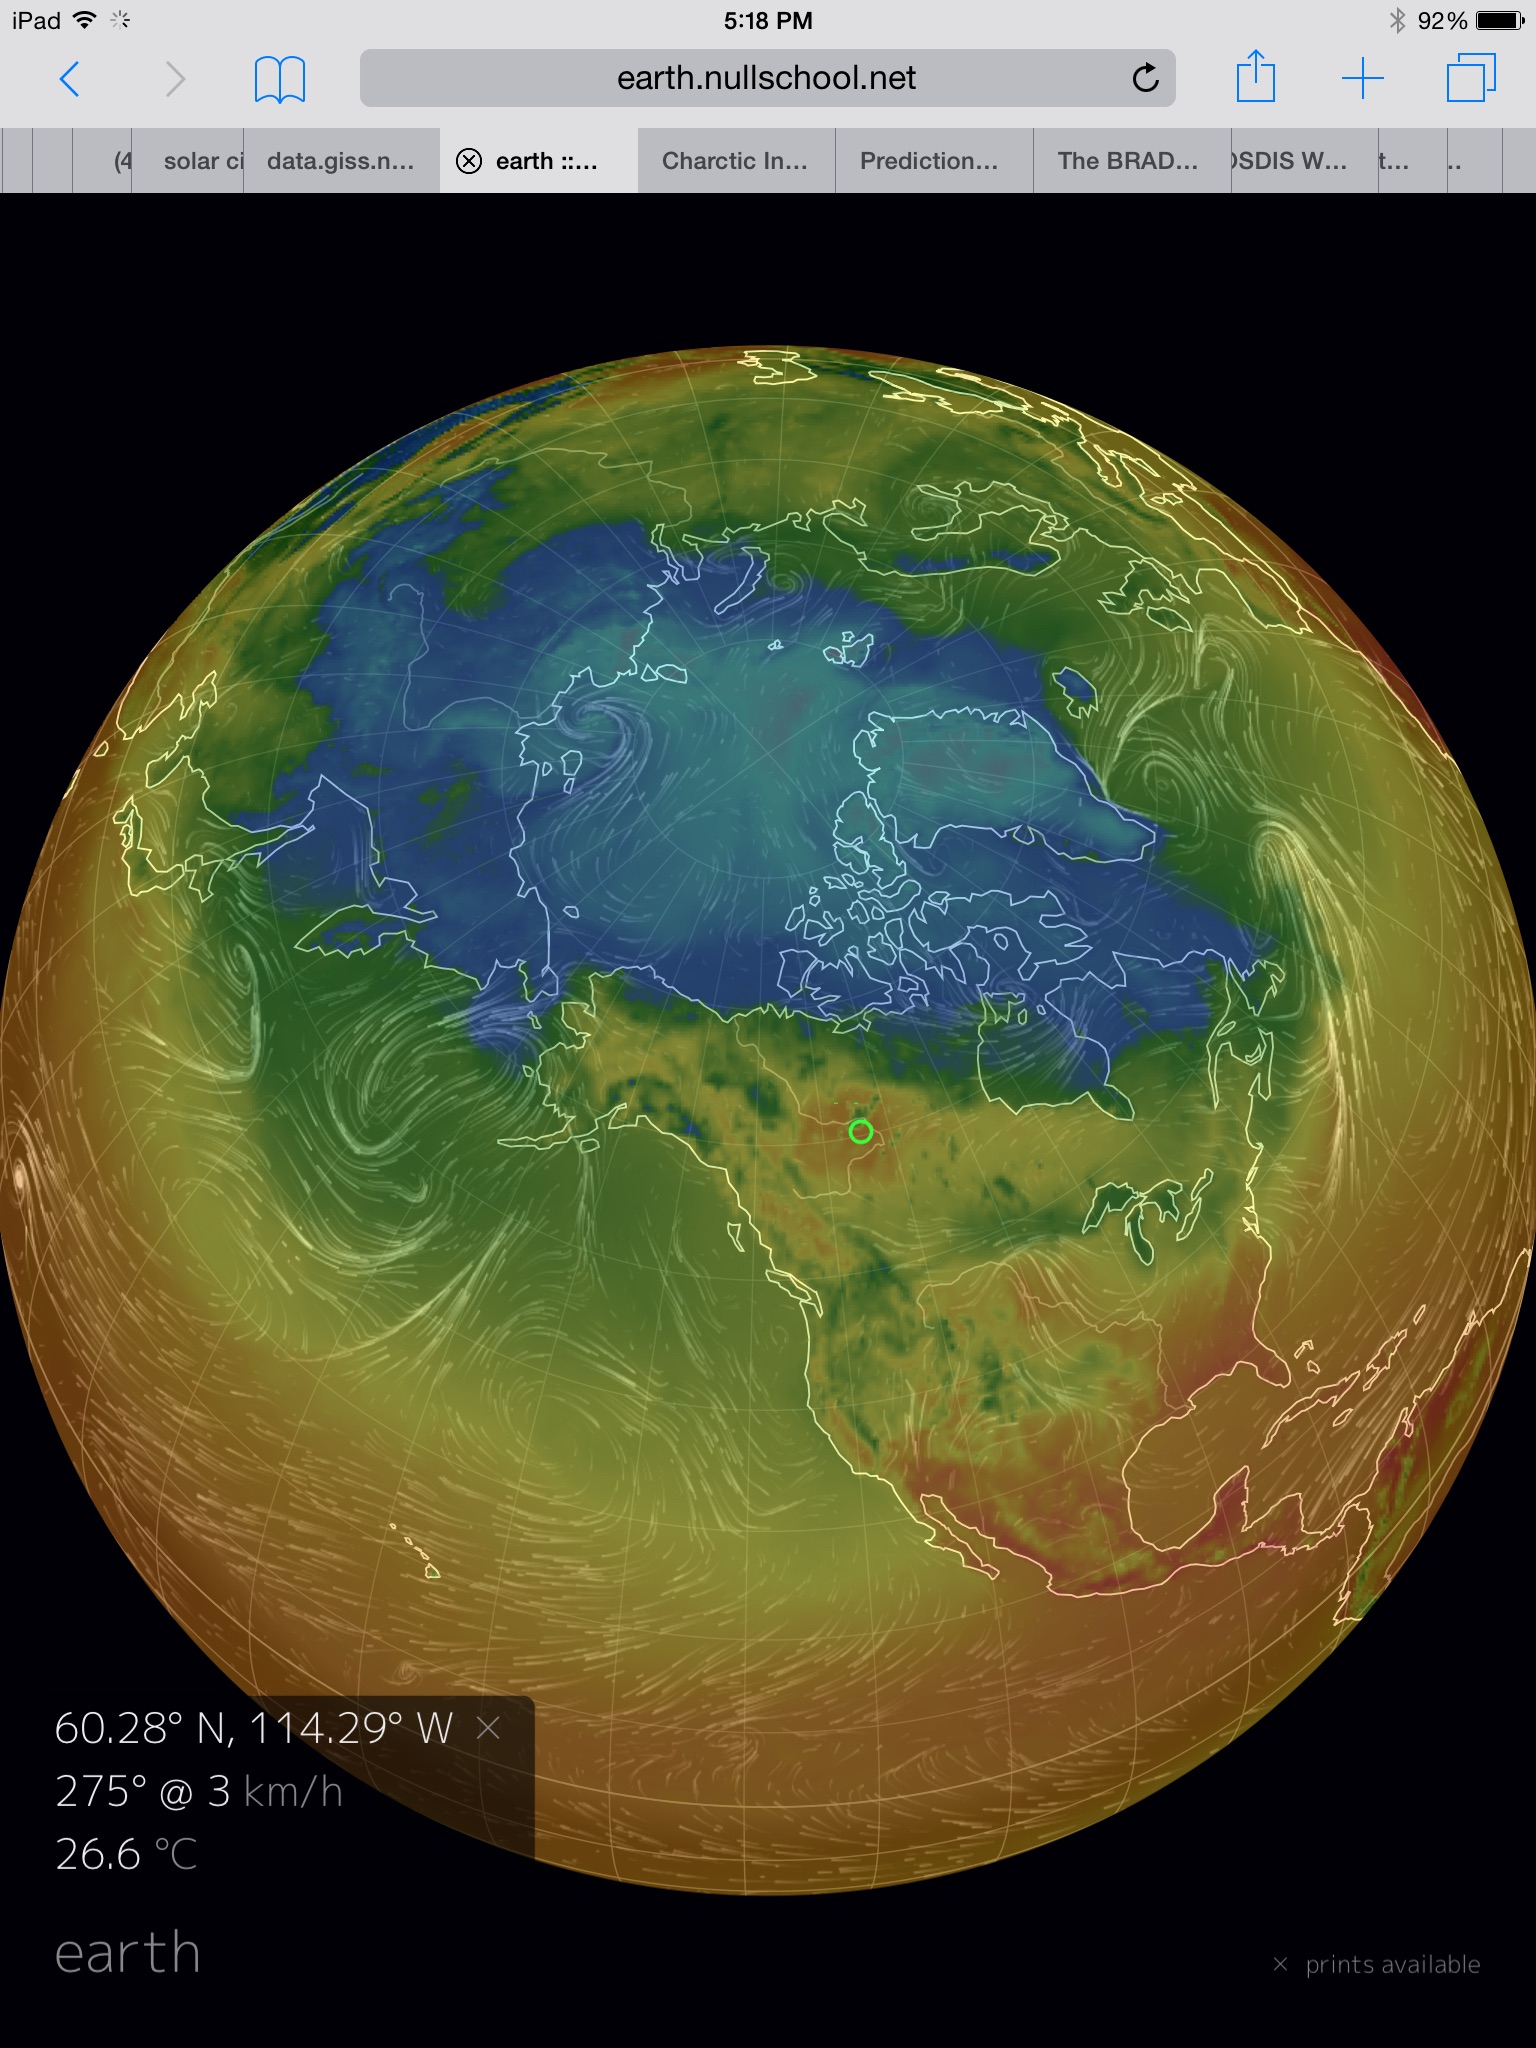
(Global Temperature Anomaly on March 4, 2014 showing a warmer than normal world sitting beneath an ominously hot Arctic. Image source: University of Maine.)

Average temperatures for the entire Arctic are 4.16 degrees Celsius above the, already warmer than normal, 1979 to 2000 base line, putting these readings in a range about 6 degrees Celsius above Arctic temperatures during the 1880s. When compared to global average warming of about .8 C above 1880s norms, this is an extreme heat departure that places the Arctic region well out of balance with both its traditional climate and with global climate at large.

Local large hot zones with temperatures ranging between 10 and 20 degrees Celsius above average appear east of Svalbard, in the Arctic Ocean north of the East Siberian Arctic Shelf, and over a broad swath of the Canadian Arctic Archipelago. These zones of warmth are as odd as they are somewhat horrific, creating regions where temperatures are higher than they would otherwise be in April or, in some cases, late May.

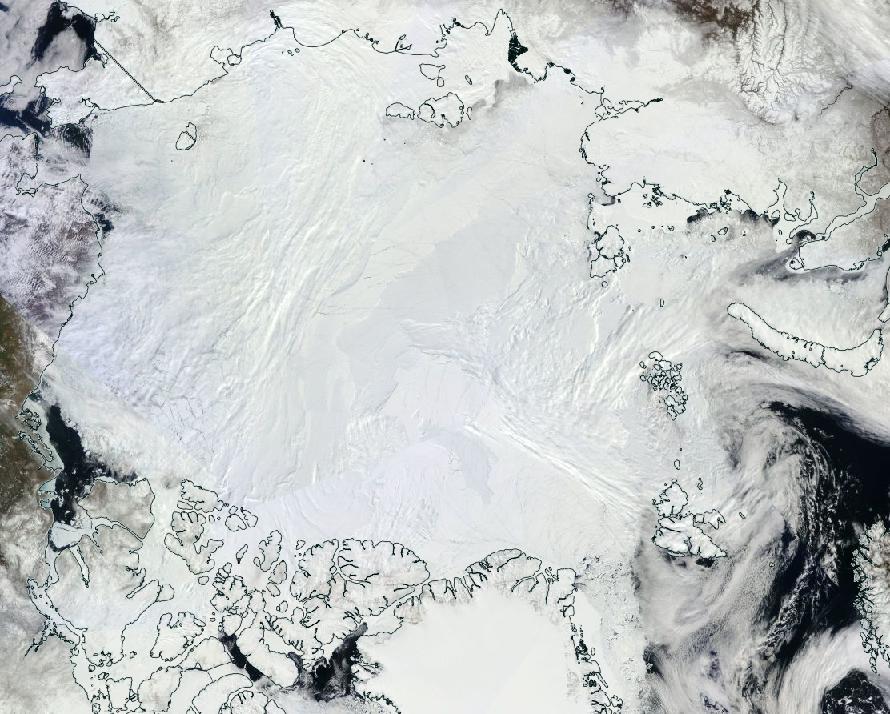
Sea Ice Melt Over a Warming Arctic Ocean

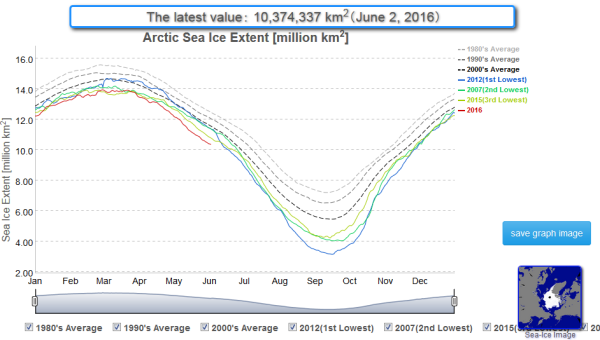
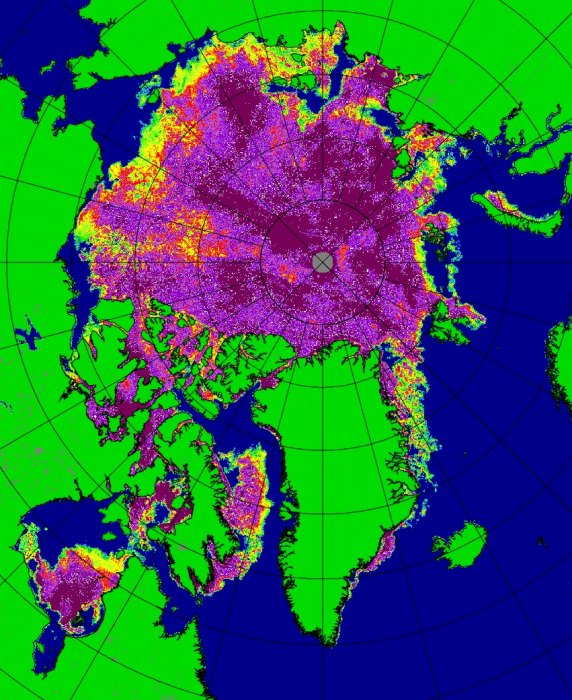
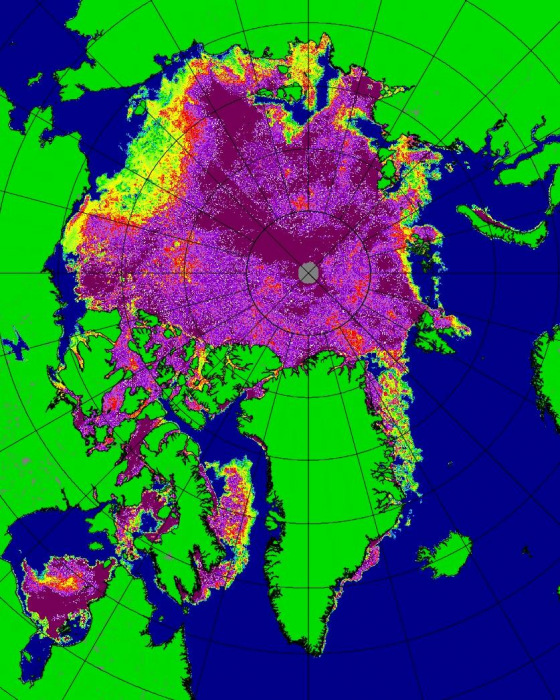
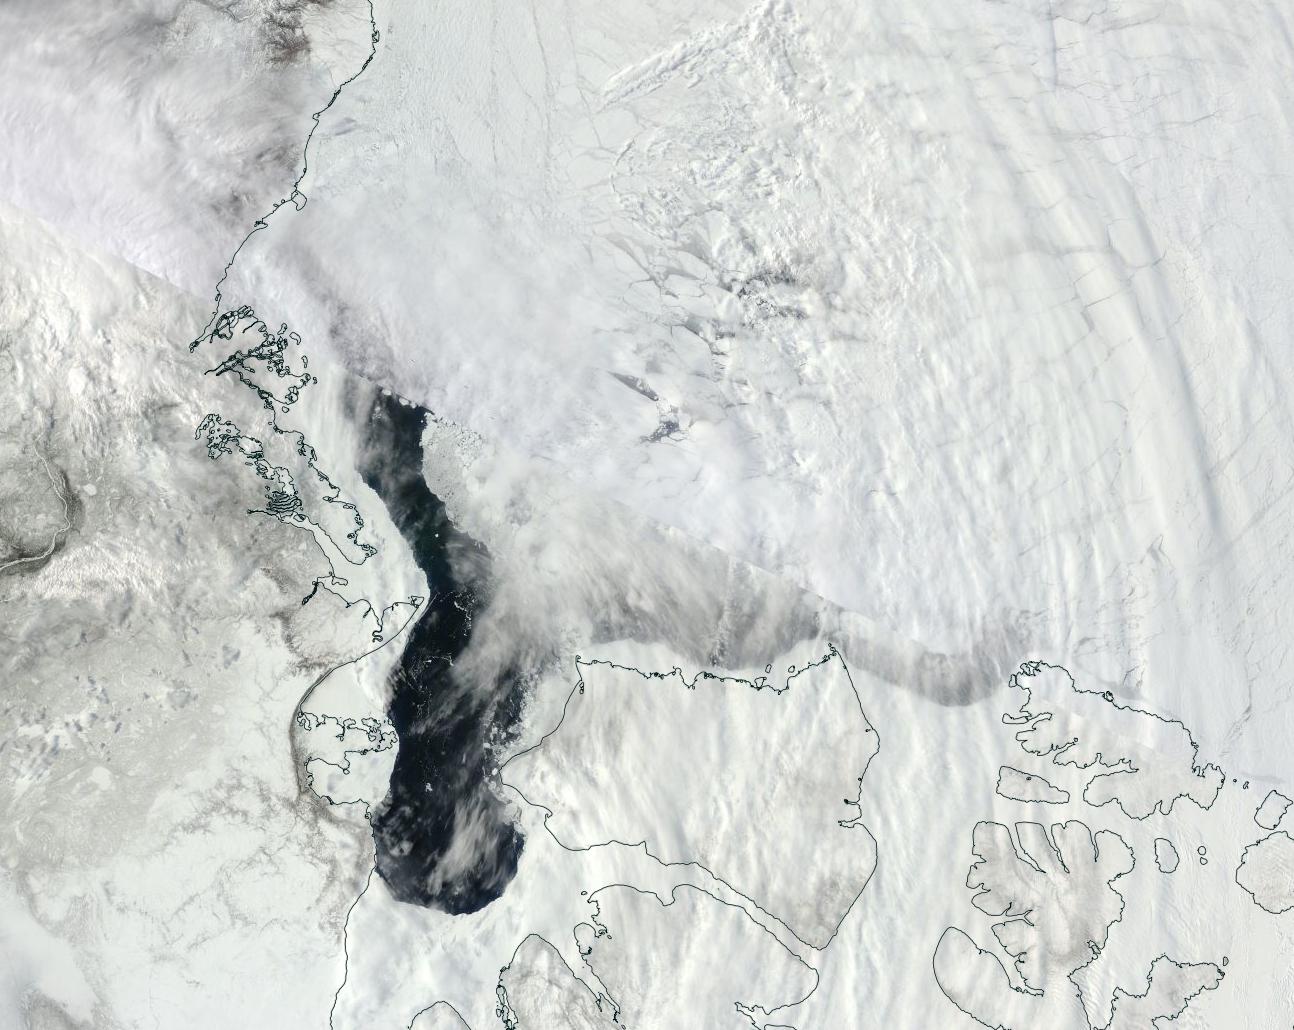
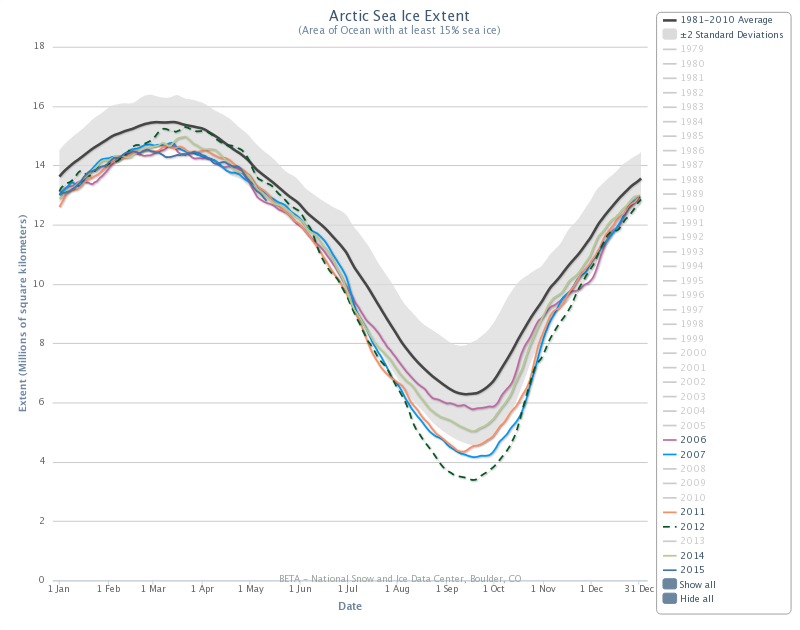
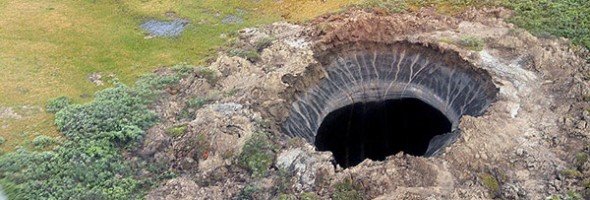
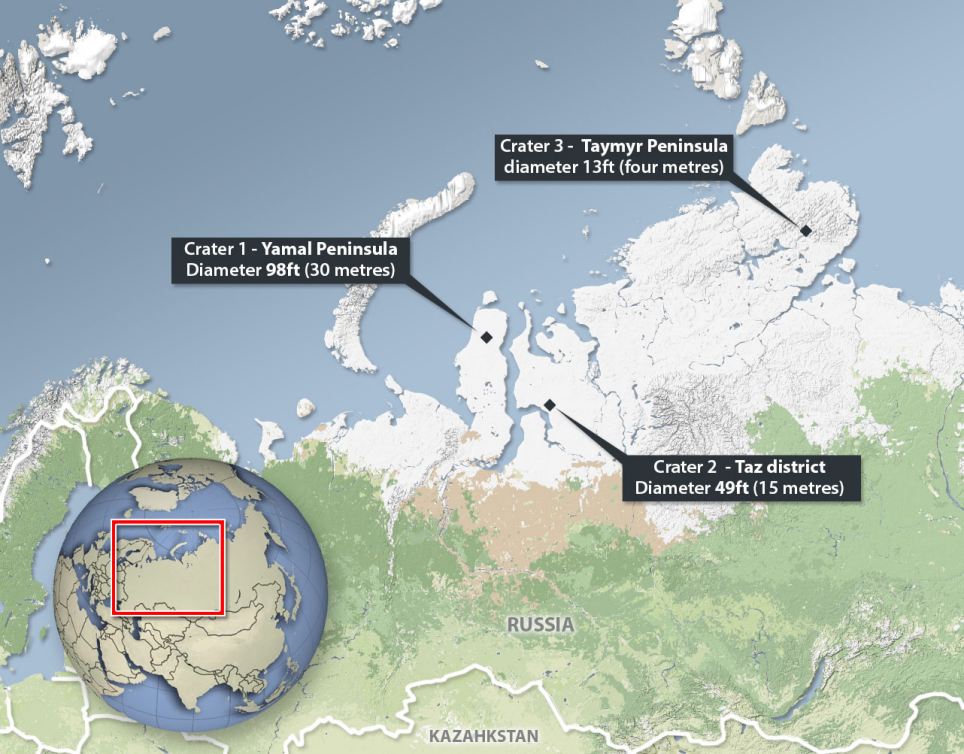
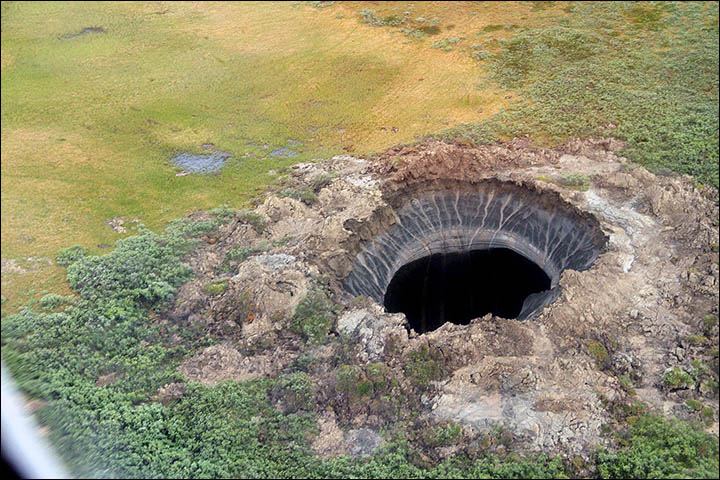
This ongoing condition of extreme Arctic heat is a symptom of overall Arctic amplification set off by a number of strong feedbacks now underway. These include sea ice measures that are currently at or near record low values (February saw new record lows in both extent and area measures) as well as a large and growing local emission of greenhouse gasses from polar stores long locked away by the boreal cold. Arctic geography also contributes to the problem as a thinning layer of sea ice rests atop an ocean that is swiftly soaking up the heat resulting from human warming.

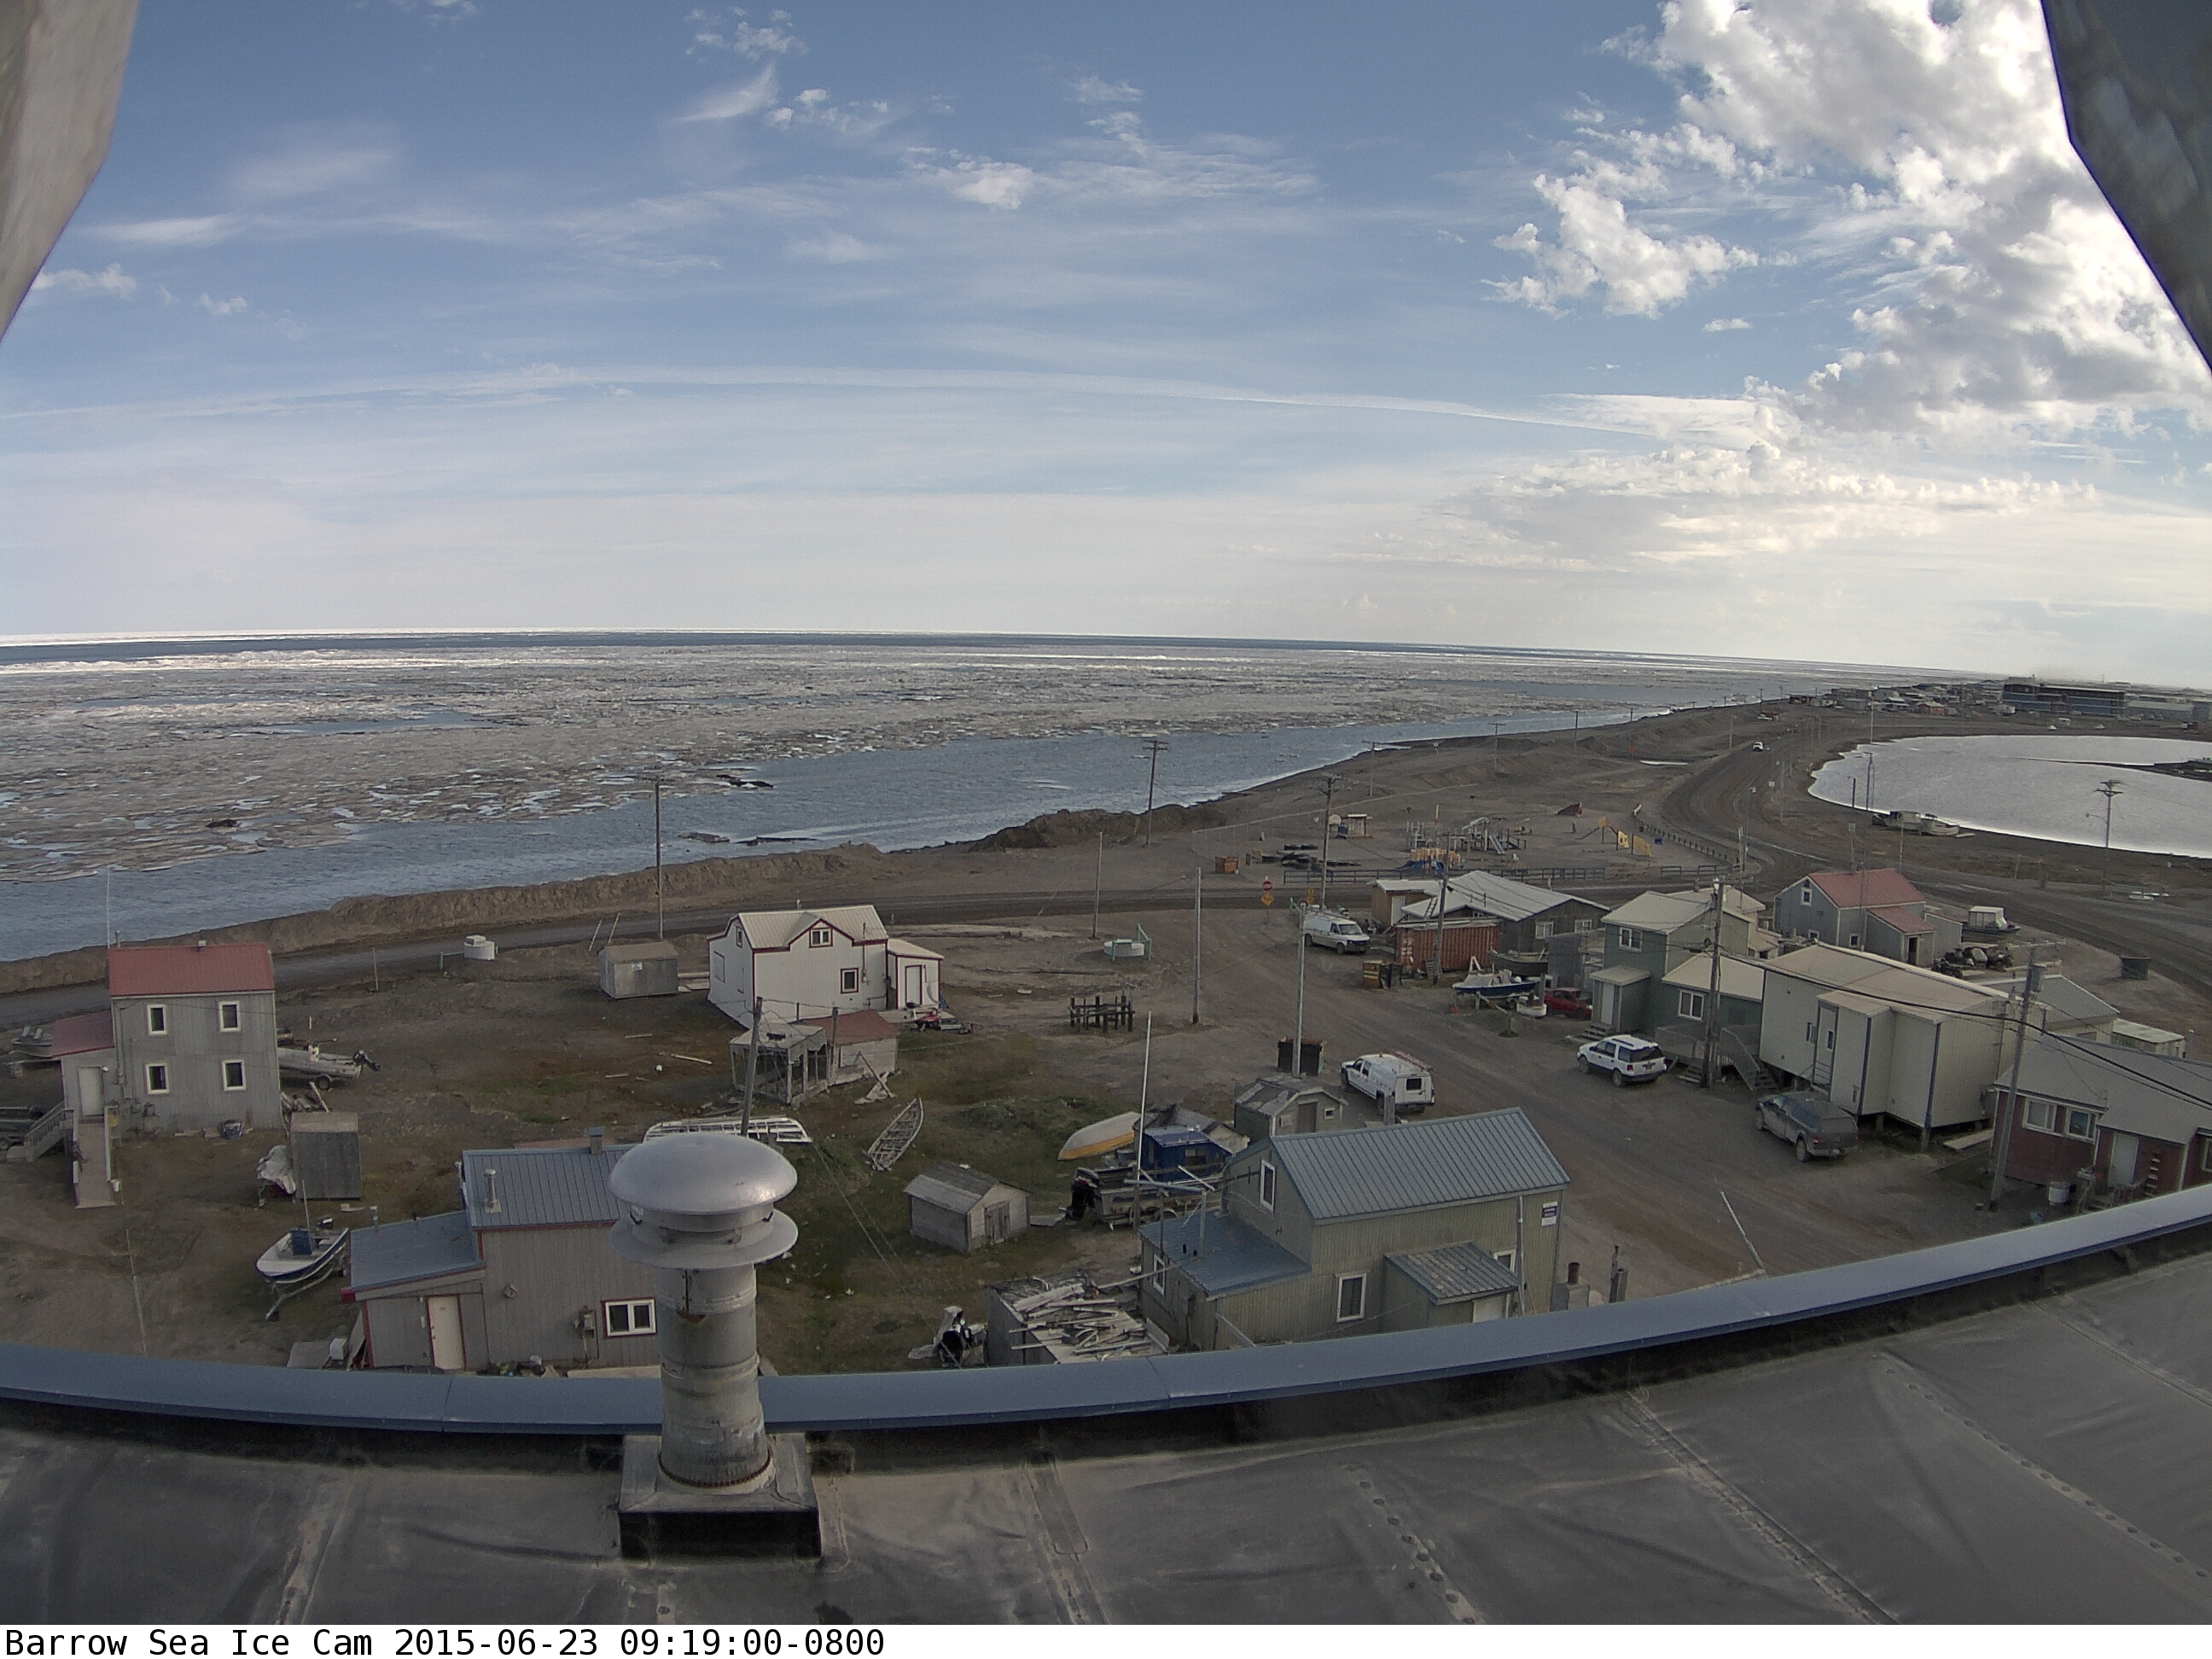
During winter time, the combination of thin sea ice, warm ocean, and higher concentrations of greenhouse gasses generates excess warmth over and near the Arctic Ocean basin. The warmer waters, having trapped solar heat all summer long, now vent the warmth into the polar atmosphere through the sparse, cracked, and greatly diminished sea ice. And while this increasing heat imbalance has been shown to be lengthening the melt season by 5 days per decade, it is also stretching its influence well into winter time as ocean heat now continually bleeds through a thinning and ever more perforated layer of sea ice.

Other effects include an overburden of greenhouse gasses trapping long wave radiation to a greater extent in the polar zone while the already warmer than usual condition creates weaknesses in the Jet Stream that generate large atmospheric waves. The south-north protrusions of these waves invade far into the Arctic Ocean basin over Svalbard and Alaska, transporting yet more heat into the Arctic from lower latitudes.

The net effect is the extraordinary Arctic warming we are now seeing.

Earth Under Continuous Fire of Extreme Weather

This rapidly increasing warmth at the Arctic pole generates a variety of weather instabilities that ripple on through the Northern Hemisphere. Meanwhile, the ongoing impacts of equatorial warming or such warming in concert with the far-flung effects of polar amplification and an increase in the hydrological cycle of about 6% are causing a number of extraordinary events over the Southern Hemisphere.

In short, the barrage of extreme weather is now entirely global in nature. A brutal if amazing phenomena directly associated with a human-heated climate system.

Extreme weather map

(Map of extreme weather events throughout the world from January 1 through February 14. Note that it is now difficult to find a region that is currently not experiencing exceptional weather. Image source: Japanese Meteorological Agency.)

Over the western US, Canada, and Alaska, a Jet Stream ridge that has persisted for a year has generated both abnormally warm conditions for this region, with Alaska experiencing its third hottest January on record, and an extreme drought for California that is among the worst in its history. This drought is now poised to push US food prices up by between 10-15 percent as California officials are forced to cut off water flows to farmers.

Only the most powerful of storm systems are able to penetrate the ridge. And the result, for the US West Coast, is a condition that either includes drought or heavy precipitation and flooding events. A condition that became plainly apparent as winter storm Titan dumped as much as 5 inches of rainfall over drought-stricken southern California, setting off landslides and flash floods that sent enormous waves of water and topsoil rushing down roads and gullies alike. And though the storms came, the drought still remains.

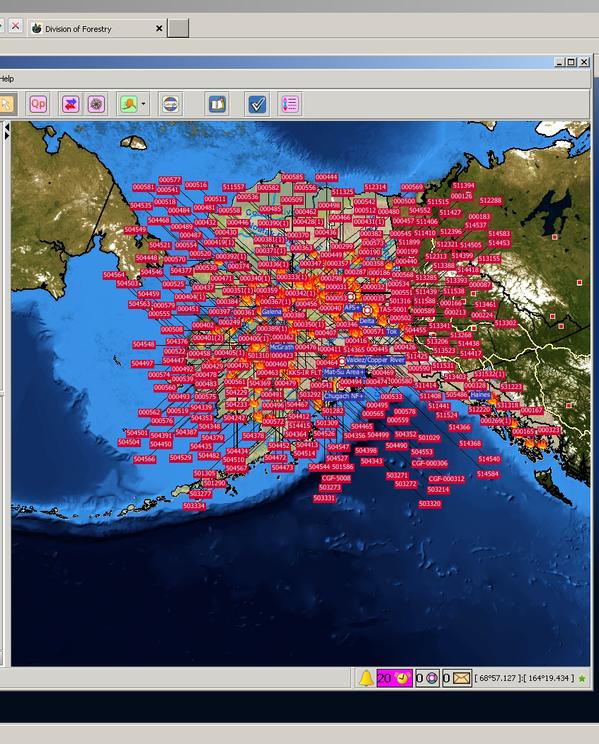
Added to the list of extremes for the Western US are a number of early starts and/or late ends to fire seasons with California, Arizona and New Mexico all experiencing wildfires during the period of December through February.

Moving east, we encounter the down-sloping trough that is the flip side of the ridge bringing warmth and drought to deluge conditions to the west. So, for the Eastern and Central United States, we see the transport of chill air down from the Arctic Ocean, over Canada and deep into a zone from The Dakotas to Texas to Maine. As a result, we have seen winter storm after winter storm surge down into these regions, dumping snow, ice, and heavy rain while occasionally coming into conflict with Gulf warmth and moisture to spark tornadoes and thunderstorms over snow-covered regions.

One cannot separate the warm air invasion over Alaska and the heat radiating out of the perforated sea ice from the numerous polar vortex collapse events that have led to this extreme winter weather over Central and Eastern parts of the US. And so, it is also impossible to ignore the warping and deleterious impacts of human-caused climate change on the world’s weather.

The World Meteorological Organization (WMO), in its latest extreme weather assessment notes:

In the winter a deep reservoir of cold air becomes established through the atmosphere over the Arctic because of the lack of sunlight. This is usually held over high latitudes by the Jet Stream, a fast moving band of air 10 km up in the atmosphere which drives weather. This year, a “kink” in the jet stream allowed the reservoir of cold air to move southwards across the USA. A blocking pattern meant it was locked into place, keeping severe weather systems over much of the Eastern United States extending down to northeast Mexico.

This ‘kink’ and related blocking pattern the WMO mentions is also the leading edge of the advance of cold Arctic air over the North Atlantic which combined with ocean heat and moisture to aim intense storms at Western Europe. In essence, a powerful planetary wave or Rossby Wave type feature:

Planetary Wave

(The Northern Hemisphere Jet Stream takes on Planetary Wave pattern with an extreme high amplitude ridge over the Western US, Canada, Alaska and the Beaufort Sea and a deep, cold trough digging into the Eastern US and spreading out over the North Atlantic on February 26th. Image source: University of Washington.)

For as we look yet further East we come to a North Atlantic Ocean that has been little more than the barrel of a gun firing a two and a half month long barrage of storms at England and Western Europe. For the Jet Stream, at this point, is intensified by Arctic air fleeing from a warming north coming into contact with the also warming waters of the North Atlantic. In this region, the planetary wave feature developed with severe and lasting consequences for England, France, Portugal and Venice.

The upshot was the wettest period in over 250 years for England as well as the windiest period since at least the 1960s. During February, two of these storms generated 80-100 mph winds and waves off Ireland and the UK that were the highest ever recorded for this region. Meanwhile, the powerful storm surges associated with these storms reshaped the English coastline, uncovered bombs dropped during World War II and unearthed the stumps of an ancient forest that spread from England to France before it was buried in the floods of glacial melt at the end of the last ice age. The battering continues through early March with England suffering losses in excess of 1 billion dollars.

The storms ripping across the Atlantic also resulted in the loss of over 21,000 sea birds and have heavily impacted France, Spain and Portugal with record rains, gales and tidal flooding. During early February, a series of gales also drove high tides along the coast of Italy and spurred flooding in Venice.

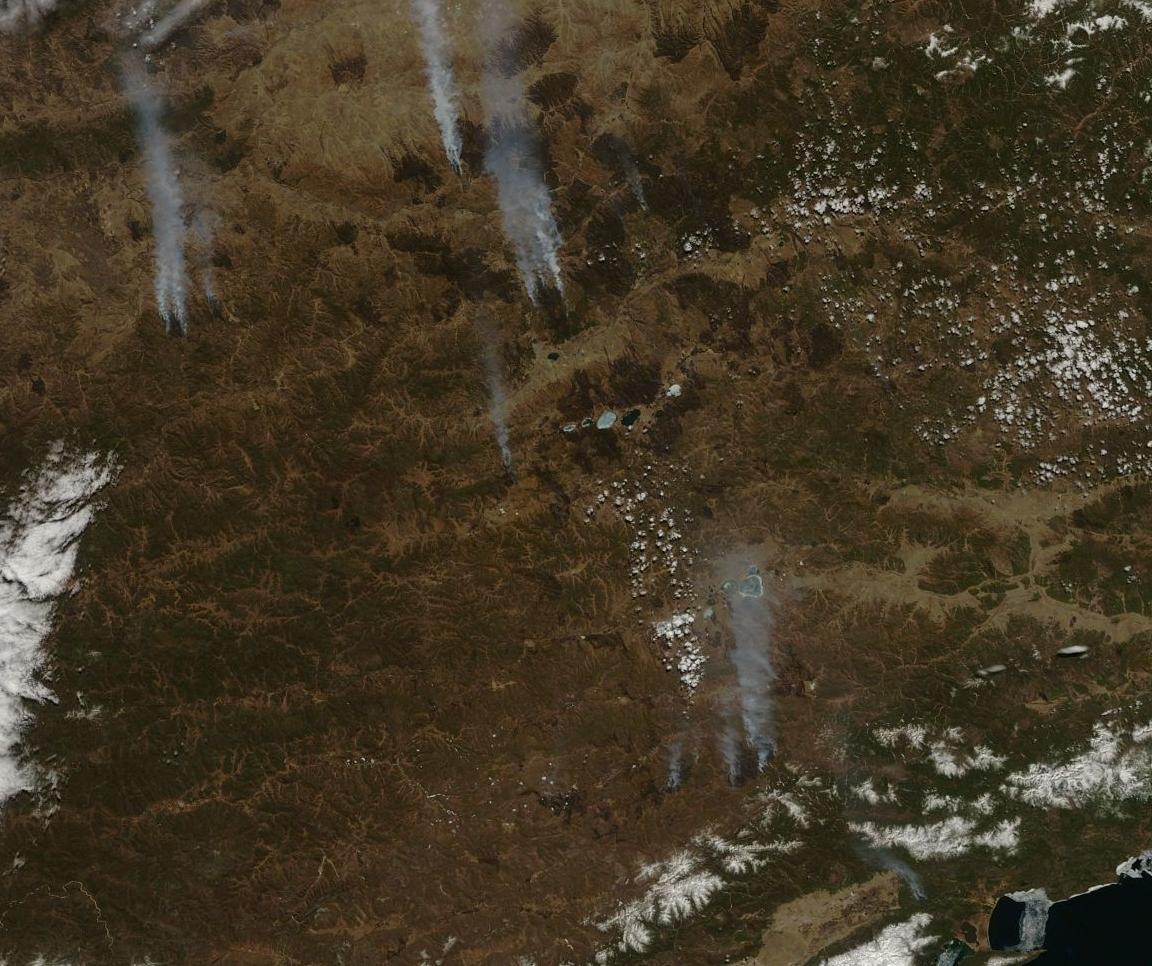
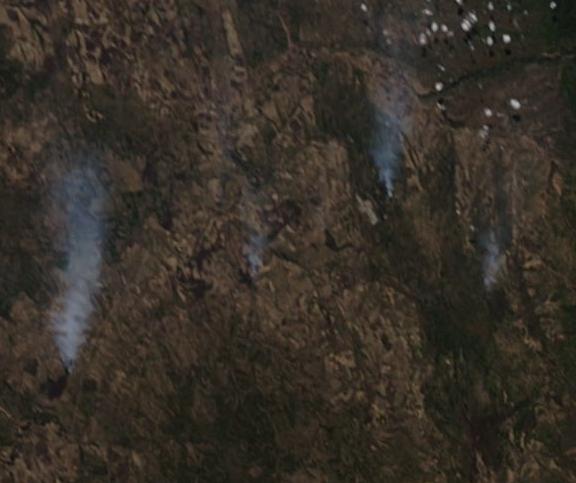
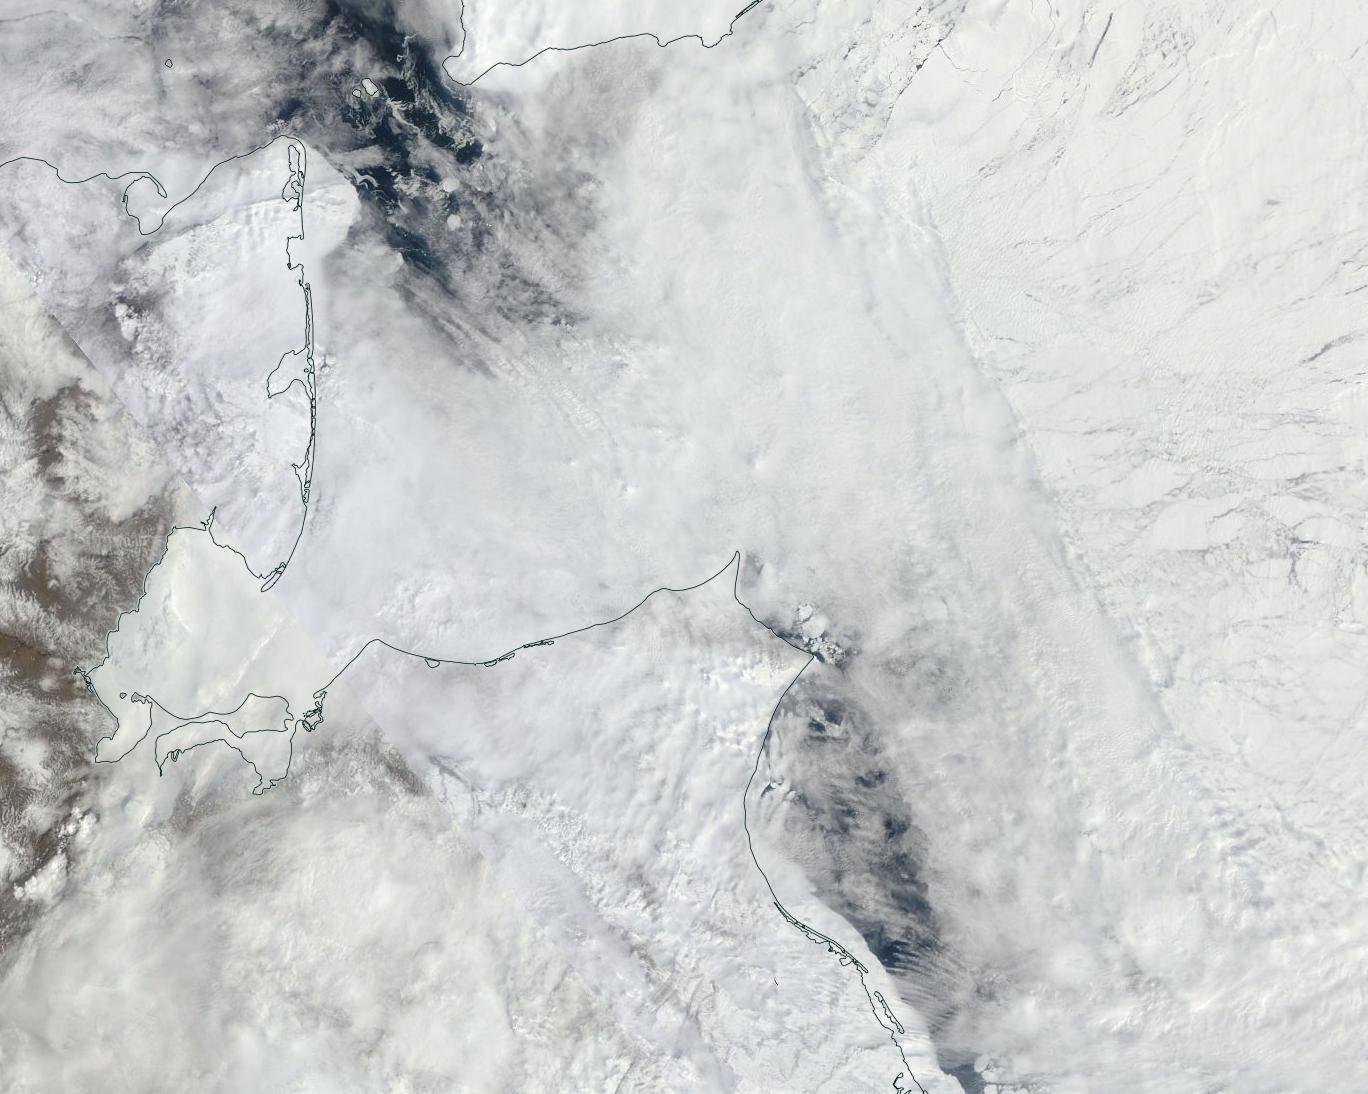
As storms slammed into coastal western Europe, strange fires were also burning along Arctic shores as a very dry and windy winter sparked blazes along the coastlines of Norway. These fires, some of the worst in Norway’s history, occurred during January and February, months that have never seen wildfires before. So the strange story of flood and fire that tends to come with climate change may seem yet more radical and extreme when we include what has happened over this section of Europe during 2014.

By the time we enter Eastern Europe, Turkey, Jordan, Israel and Russia we again encounter an up-slope in the Jet Stream along with related periods of heat and drought. Record highs were set throughout a zone from Germany to Slovenia to Russia. Germany experienced January temperatures that were 2.8 degrees Celsius above the 20th Century average while Russia experienced heat anomalies approaching 10 degrees Celsius hotter than normal that persisted for up to a week in length. In Turkey, farmers frantically drilled into drying lake-beds for water as both warmer and drier than normal conditions combined with ground water depletion to generate severe agricultural stress.

But the strain for Israel, which experienced lowest ever winter rainfalls and one of the worst droughts in its history, was far worse. According to the Israeli Water Agency’s March 4 Statement, water supplies across the country were now at record low levels:

“Such low supply during this period has never before been documented and is unprecedented in Water Authority records,” the agency said. “The negative records broken in February are much more dramatic and significant than those of January.”

Drought-stressed Jordan has also been forced to ration water supplies, with rainfall levels now only 34 percent of that received during a typical January and February.

Abnormal warmth and drought also extended into China as most parts of the ancient empire received between 50-80 percent below average rainfall. Temperatures averaged over the entire country were the warmest seen since at least 1961. The warmth and dryness resulted in record low river and lake levels across the country with China’s largest lake turning into a sea of cracked mud and grasses.

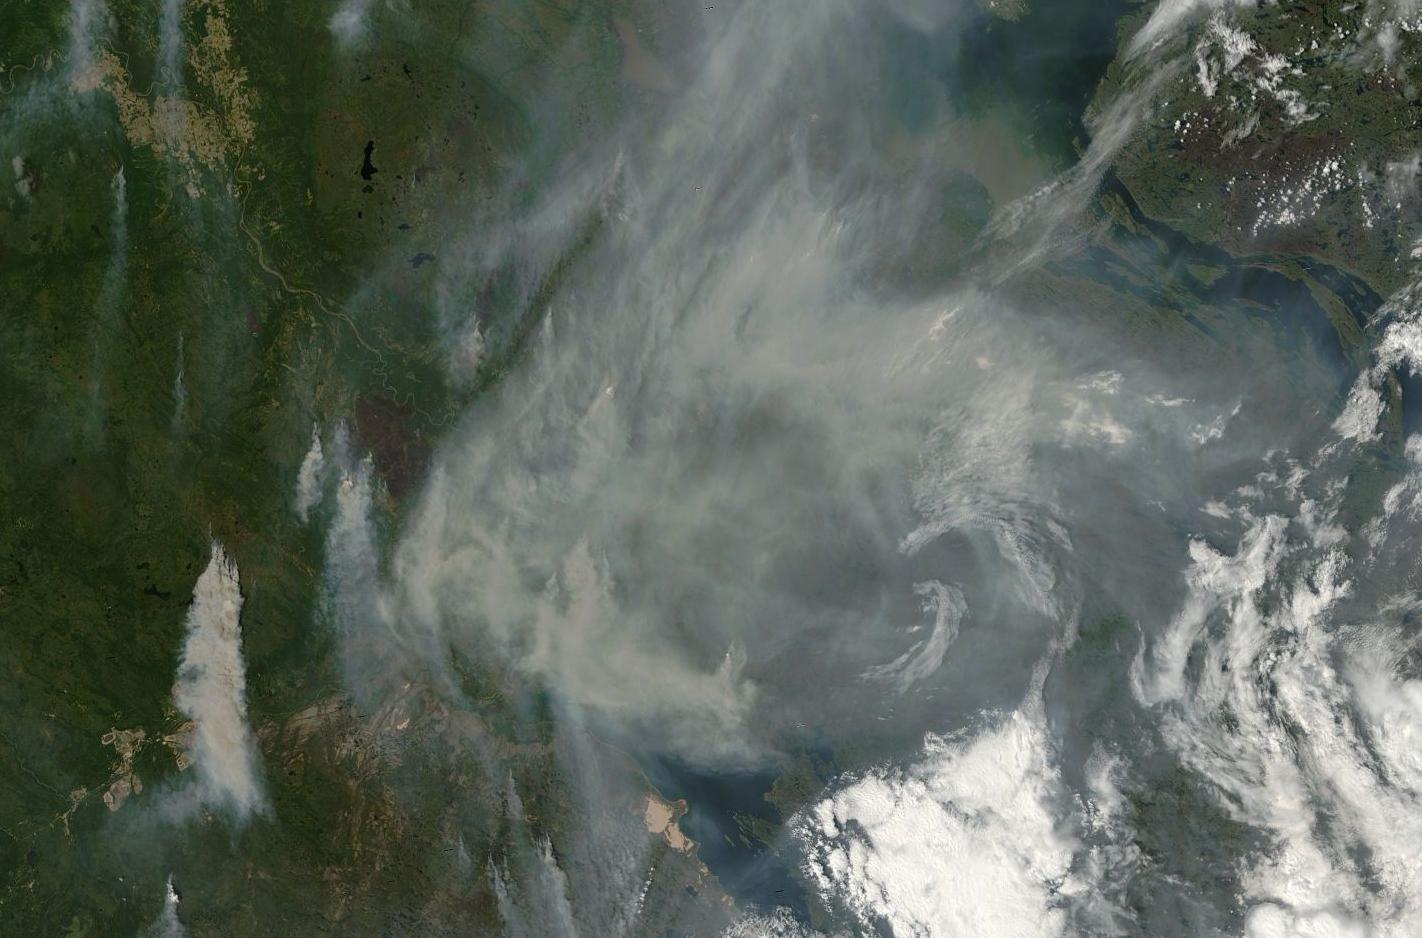
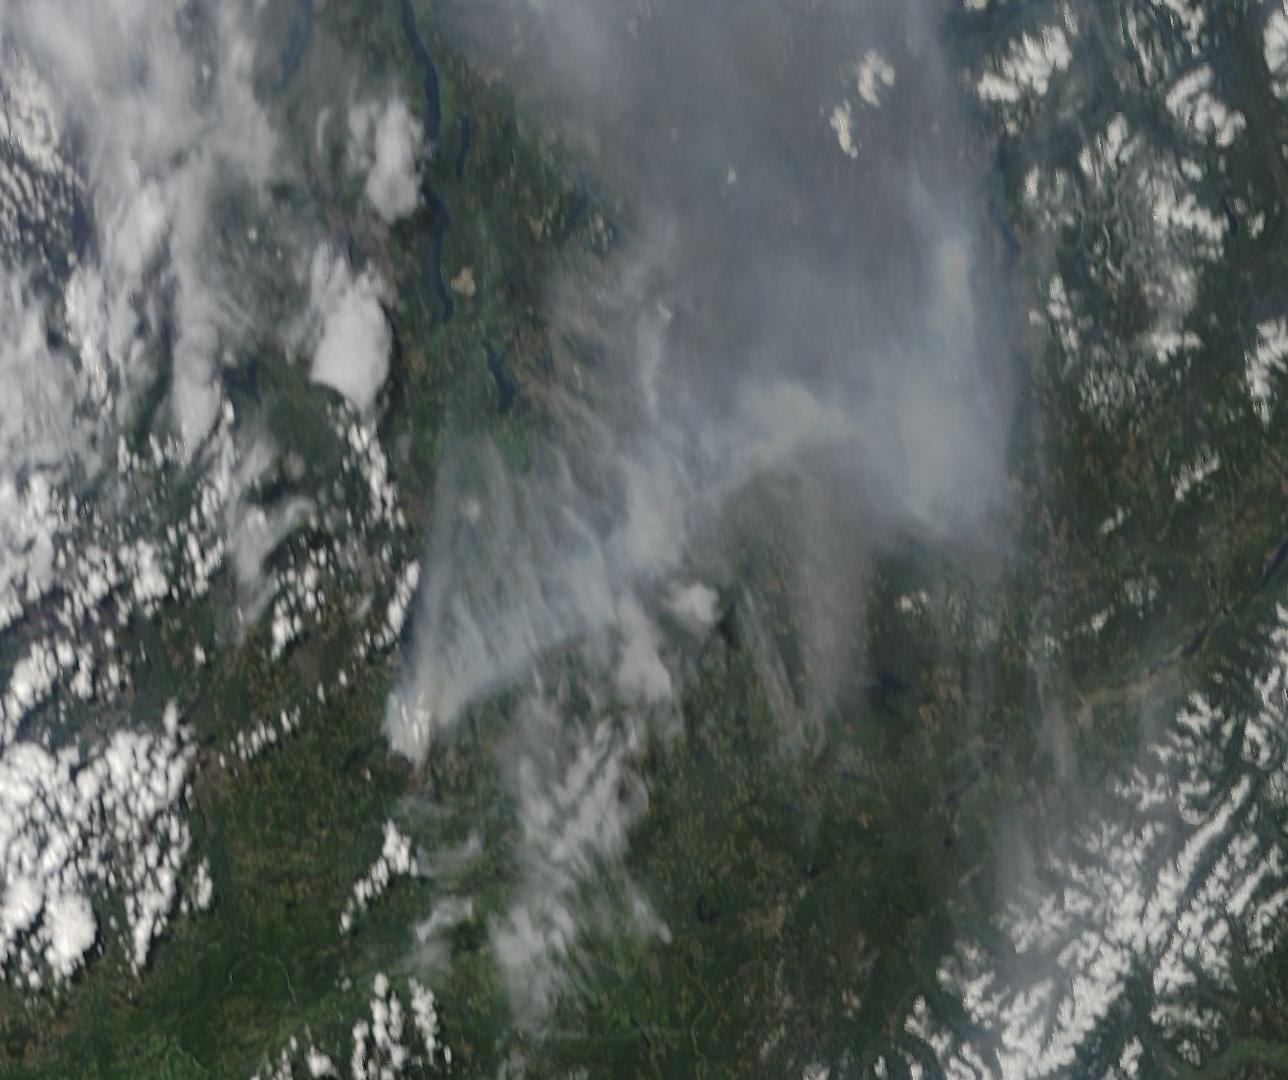
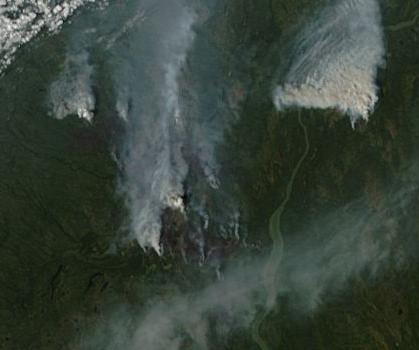
In Singapore and nearby Malaysia, a two month-long heatwave is now among the worst ever recorded for this region. The situation has been worsened as nearby forest fires have combined with industrial pollution to produce a kind of all-encompassing smog. A nasty brew that cut visibility in the region to less than one kilometer.

Smoke Smog Singapore Maylaysia

(Smoke and smog from fires and industrial activity visible over Singapore and Malaysia. Image source: Lance-Modis.)

One would think that, with major heat anomalies occurring over the Arctic, the far removed Southern Hemisphere would be somehow insulated from impacts. But whether from far-reaching Arctic influence or simply from other factors related to human-caused climate change, austral regions were among the hardest hit by the, now global, spate of extreme weather events.

Australia’s record 2013 heatwave didn’t miss a beat as a hottest ever summer continued on through January and February. A period in the middle of January showed exceptionally severe high temperatures with World Meteorological Agency reports noting:

One of the most significant multi-day heatwaves on record affected southeast Australia over the period from 13 to 18 January 2014. The major area affected by the heatwave consisted of Victoria, Tasmania (particularly the western half), southern New South Wales away from the coast, and the southern half of South Australia. Over most parts of this region, it ranked alongside the heatwaves of January-February 2009, January 1939 and (from the limited information available) January 1908 as the most significant multi-day heatwaves on record.

A number of site records were set during the summer, including:

• Melbourne had seven 40ºC days; annual average is one day

• Adelaide had 11 days of 42ºC or above; annual average is one day

• Canberra had 19 days of 35ºC or above; annual average is 5.4 days

While Australia was sweltering under its hottest summer on record, south-central Brazil was suffering its worst-ever drought. By mid February, Brazil had been forced to ration water in over 140 of its cities. The result is that neighborhoods in some of Brazil’s largest cities only receive water once every three days. During this, extraordinarily intense, period of heat and dryness, untold damage was done to Brazil’s crops. But, by early March, a doubling of prices for coffee coming out of Brazil gave some scope to the damage. January was also Brazil’s hottest on record and the combination of extreme heat and dryness pushed the nation’s water reservoirs for southeastern and west-central regions to below 41 percent of capacity driving utility water storage levels to a critically low 19 percent.

In near mirror to the US weather flip-flop, northern Brazil experienced exceptionally heavy rainfall, apparently gaining back the lion’s share of moisture lost in the south and stalling a two year drought affecting north-eastern regions.

In combination, these crazy weather extremes are thought to have done nearly $5 billion in damages to Brazil’s crops so far this year, on top of $9 billion in losses last year. Losses run the gambit from coffee to beef, soy, citrus, and sugarcane. It is worth noting that Brazil is the largest producer of all these foodstuffs with the one exception being soy.

The same drought impacting Brazil also damaged crops in Paraguay and Argentina with soybeans among the hardest hit.

Given the ongoing extreme weather impacts, it is worth noting that world soybean prices are now up by more than 9 percent over the 2012-2013 period with almost all foodstuffs seeing price increases in the global marketplace. The UN FAO food index remained over 200 through late January, a dangerously high indicator that shows numerous countries having difficulty supplying affordable food to their populations.

Extremes Cover the Globe

The above list does little justice to the depth and scope of extremes experienced, merely serving to highlight some of the most notable or severe instances. In general, it could well be said that the world climate crisis is rapidly turning into a world severe weather crisis. January and February are usually rather calm months for the globe, weather-wise. So the fact that we are seeing record storms, rainfall, snowfall, floods, fires, droughts, winds, and heatwaves in every corner of the globe during what should be a relatively mild period is cause for serious concern.

And many scientists are taking notice. For example, Omar Baddour, Chief of the WMO’s data division observes an amazing ramping up of extreme weather events worldwide, citing preliminary model assessments in an interview with The Guardian, he notes:

“We need more time to assess whether this is unusual [on a global level] but if you look at the events in individual regions, like the heatwave in Australia or the cold in the US, it looks very unusual indeed. Next month we will publish a major report showing the likelihood of extreme heatwaves is increased 500% [with climate change].”

The shadow climate change casts has grown very long and there is little that has not now been touched by it. But, sadly and unfortunately, even under a regime of full mitigation and adaptation, the worst effects are yet to come. If we are wise, we will do our best to mitigate as much as we can and work together to adapt to the rest.

Hat Tip to Colorado Bob

Links:

The World Meteorological Organization

University of Maine

University of Washington

Japan Meteorological Agency

Lance-Modis

UK Endures Endless Barrage of Storms

Ice-free Season Getting Longer by Five Days Per Decade

Mangled Jet Stream Sparks Drought, Winter Wildfires in California

For Arizona and New Mexico, Climate Change and a Mangled Jet Stream Means Fire Season Now Starts in February

World Food Security in the Cross Hairs of Human-Caused Climate Change

Arctic Wildfires in Winter

California Storms Didn’t End Drought

The Biggest Disaster You’ve Never Heard of

Haze Shrouds Malaysia

Brazil Rations Water in Over 140 Cities

World Begins 2014 With Unusual Number of Extreme Weather Events

Brazil Loses Billions as Crops Reduced By Wacky Weather

Arctic Heat Wave Sets off Hottest Ever Winter-Time Temperatures, Major Melt, Disasters for Coastal and Interior Alaska

Major melt in the midst of winter. Doesn’t sound quite right, does it? We tend to think of winter as the time of freezing, as the time of ice accumulation. Not the time of melt and thaw.

Now try this — major melt in Alaska in the midst of winter. Average temperatures 40 degrees hotter than normal in the midst of winter. Rainfall over snow and ice causing avalanches, major road blockages and ice dams to rivers in the midst of winter.

In this instance we have been transported from the somewhat odd into a reality that is completely outside of our previously ‘normal’ context. In this instance we are transported to a time that may well seem like the beginning of the end of the age of ice on planet Earth.

And yet this is exactly what is happening: one of the coldest regions on the planet is experiencing melt and related record heat in January.

For the state of Alaska, the consequences are a strange and freakish winter heat wave, one that features the extreme temperatures mentioned above. For the city of Valdez, as we shall see below, the situation is far more stark.

valdez-avalanche

(Massive Avalanche set off by rainfall, winter warmth, cutting off Richardson Highway to Valdez Alaska and forming a dangerous ice dam of the ironically named Keystone Canyon’s Lowe River. Image source: Alaska Department of Transportation and Public Facilities.)

Hottest ever Winter-time Temperatures for Alaska

On Sunday, a collapse event that flooded the Arctic with heat and ripped the polar vortex in half began. A freakish high amplitude ridge in the Jet Stream that had been pumping warmth over Alaska and into the Arctic for ten months running strengthened. The result was that many regions throughout the state experienced their hottest temperatures ever recorded for that day, month, or season.

Global Temperature Anomaly Reanalyzer

(Global Temperature Anomaly Data vs 1979-2000 mean with focus on Arctic for January 29. Note the extreme Arctic deviation of +5.58 degrees Celsius and the pool of 36+ F high temperature deviations still lingering over Alaska. Also note that global anomalies are +.32 C above the 1979-2000 mean which is, itself, about +.5 C above average temperatures during the 1880s, for a total of about +.82 globally. The above measure is an excellent illustration of both extreme polar amplification and very rapid warming coinciding with a strong negative Arctic Oscillation, related warm air influx, and polar vortex separation. Source: Climate Change Institute.)

According to reports from Weather Underground, Homer Alaska, for example, experienced an all time record high for the day of 55 degrees Fahrenheit, 4 degrees hotter than the previous all-time high set just a few years earlier. And Homer was just one of the many cities sitting in a broad region of extraordinary, 40 degree hotter than normal temperatures. A region extending from the interior to the southern and western coasts. Bolio Lake Range, about 100 miles south of Fairbanks in central Alaska, saw temperatures rocket to 60 degrees, just 2 degrees short of the all-time record high for any part of the state during January (the previous record high of 62 was set in Petersburg, nearly 700 miles to the south and east).

Typically colder high mountain regions also experienced record warmth for the day. A zone 10,600 feet above Fairbanks hit 32 degrees Fahrenheit on Sunday, the highest temperature ever measured for this region during any winter-time period from November through February.

Even before the most recent extreme Arctic temperature spike, January saw numerous powerful heat influxes for Alaska with Nome, Denali Park, Palmer, Homer, Alyseka, Seward, and Talkeetna each setting all-time record high temperatures during the month.

These records come on the back of a long period of rapidly increasing Alaskan heat stretching all the way back to the 1970s. In many cases, we are seeing all-time record highs broken with 5-10 year frequency. In the most extreme cases, these records fall again after only standing for 1-5 years.

Taken in this context, what we are seeing is the freakish continuation of an ongoing period of inexorable Arctic warming providing yet one more major insult to the Alaskan climate during the winter of 2013-2014.

Rain and Melt Sets off Major, Spring-like, Outflows From Streams and Rivers

The same anomalous Jet Stream pattern that has acted as a conveyer belt continuously transporting heat into the high north over Alaska has brought with it an almost endless series of rain events to coastal Alaska. Storm after storm, fueled by heat and high rates of evaporation over the northern Pacific, slammed into the Alaskan coastline, disgorging record levels of precipitation.

With temperatures freakishly high, mirroring conditions typically present during late spring or early summer, much of this precipitation fell in the form of rain. Valdez, Alaska, for example, has likely experienced its wettest January ever with rainfall measures just 1.35 inches short of the record on Sunday and a series of strong storms rushing into the city on Monday and Tuesday. Given the nearly endless train of storms lining up to sweep over Valdez, it is possible that its previous record of 15.18 inches for January could easily be surpassed by an inch or two at month-end.

The storms and cloudiness make it difficult to peer down and get a good view of what all this heat and rainfall is doing to the Alaskan snow and ice pack. But, for brief respite, on January 25th, just ahead of the most recent influx of rain and warmth, the clouds cleared, revealing the land and sea surface. And what we witness is extraordinary:

Alaska Melt Rain Sediment January 25

(Southern Coast of Alaska with major sediment outflow from snow and ice melt, record heat and rainfall in January 2014. Image source: Lance-Modis)

The entire southern coast of Alaska from Prince William Sound to Cook Inlet are visibly experiencing major snow and ice melt along with flooded streams and rivers flushing out a massive volume of sediment into the Gulf Alaska. Clearly visible in the satellite shot, the sediment now streaming into the ocean is more reminiscent of a major late spring flood event than anything that should be ongoing for Alaska in the midst of winter.

Yet here we are. A situation of continuous, never-before seen heat for Alaska during winter time bringing on a flooding thaw that is far, far too early.

Rainfall over Glaciers, Snow Pack Triggers Massive Avalanche that Cuts off Valdez

The constant assault of heat and record temperatures combined with an almost endless flow of moisture riding up from the Gulf of Alaska set off a devastating and freakish event near Valdez on Saturday. Severe and record rainfall over the mountain regions have continuously softened glacial ice and snow packs above this major Alaskan city. On Monday, the continuous insults of heat and water passed a critical threshold.

As the warm water filtered down through the colder snow and ice, the anchoring base was lubricated even as the capping snow grew heavily burdened with water. Eventually, the insults of heat and rainfall became too great and a major snow and ice slope system above the main road linking Valdez to mainland Alaska collapsed. The immense volume of snow and ice unleashed, spilling down to fill the base of Keystone Canyon, blocking both the Lowe River and the Richardson Highway running through it.

This snow and ice dam rose as high as 100 feet above the Canyon floor, causing the Lowe River to rapidly flood, inundating the already snow-and ice buried road under an expanding pool 20 to 25 feet deep and filled with ice-choked water.

You can see the massive avalanche-created ice dam and related road inundation in the video provided by akiwiguy below:

(video source: akiwiguy)

Warming-related rainfall events of the kind that has now cut Valdez off from the mainland are just one of the extraordinarily dangerous consequences of human-caused climate change. They are a phenomena linked to the massive glacial outburst flood that killed thousands in India this year together with other dangerous snow and ice melt events. Should such major heating and rainfall events impact Greenland and West Antarctica, the consequences could be even more extreme than what we are currently witnessing in Alaska.

Conditions in Context

In the context of our present extreme Jet Stream pattern that is setting off warmest-ever conditions for Alaska during January together with dangerous melt-outburst related events while at the same time periodically flushing Arctic air and extreme winter weather south into the United States, it is important to remember a few things. The first is that the Arctic is now experiencing never-before observed warmth with stunning frequency. Scientific papers now show that the Arctic is hotter than it has been for at least 44,000 years and possibly 120,000 years.

By comparison, the cold snaps, that could very well be seen as the death gasps of the Arctic we know, impacting the eastern US are relatively minor when put into this larger, more ominous context. Similar cold events were last seen about 20 years ago in the US. And so there is simply no comparison that can generate a rational equivalency between the, hottest in an age, Arctic temperatures and the, coldest in a few handfuls of years, temperatures in the Eastern US.

And if you’re one of those sensitive, perceptive souls who feels that the weather events you’re seeing, the extreme swings from very hot to somewhat cool temperatures, the extreme swings from drought to record rainfall, and the extreme events now accelerating the melting of the world’s ice and snow, are freakish, strange, and terrifyingly abnormal, then you are absolutely correct. Don’t let anyone, be they friends or family, or journalists in the media, tell you otherwise. There is reason for your discomfort and there is very serious cause for concern.

Links:

Colorado Bob’s Climate Feed

Weather Underground

NASA: Lance-Modis

Alaska Department of Transportation and Public Facilities

Climate Change Institute

Alaska All Time High For This Date, Warmer than Alabama

The Glacial Megaflood

Arctic Experiencing Hottest Temperatures in at Least 44,000 Years

Arctic Heat Wave to Rip Polar Vortex in Half

akiwiguy

Arctic Burning: 3/4 Mile Wide Fire Tornado Over Tetlin Junction, Alaska

(Hat tip to Peter Sinclair who thumbs his nose at the deniers stating, in reaction to this Fire Tornado: “sure, happens all the time.”)

The above is a film recorded on August 16th, 2013 of an explosive fire complex forming a massive fire and smoke tornado 3/4 of a mile across and towering thousands of feet into the air over a ridge line near Tetlin Junction Alaska. Close inspection of the video reveals trees and branches being sucked into the large fire ‘tornado’ caused by very strong inflow along the fire’s leading edge. Tim Whitesell, a firefighter at the scene noted:

“A picture probably is worth a thousand words, but there are indeed times when a picture just doesn’t do it justice. I’ve never seen anything like it until now.”

The terrain features in this region include boreal forest and soil that is mostly permafrost. The film shows both burning trees and ground along with a section involved in an episode of explosive outburst.

Reports from from The Alaska Fire Service are nothing short of stunning:

“This wildland fire footage was captured on August 16, 2013, on the southeast perimeter of the Tetlin Junction Ridge Fire (#414), burning east of Tok and Tetlin junctions, north of the Alaska Highway.

Fire behavior increased into the later part of the afternoon on August 16. At approximately 7:00 p.m., the Alaska Division of Forestry Aerial Supervision Module (consisting of Tim Whitesell and Doug Burts) reported the fire vortex to be about 3/4 of a mile wide; it lasted for about an hour. The extreme fire behavior uprooted trees, a scene that was captured by this footage- look for trees being blown around in the smoke column at the end of the clip.”

The blaze that sparked this massive fire tornado is arguably one of the smaller events to impact the Arctic this year, just a fraction of the size of larger infernos that have raged through areas of Canada and Russia since June. In ‘Russia Experiences Great Burning’ MODIS shots identified fire complexes and burn scars that covered 100 to 300 square miles or more (one fire burn scar measured a massive 30×70 miles). These events happened ‘off camera’ so there is no way to know if they also spawned very large fire tornadoes similar to the kind witnessed at Tetlin Ridge. What is clear from this fire and from fires across the Arctic this year and last is that the far north is burning like never before. As Russia’s eastern provinces experienced some of their worst flooding in 120 years, massive wildfires continued to burn even as the terrible rains and storm complexes advanced in an ominous Song of Flood and Fire. By now, the extent of Russian blazes has been somewhat lessened by these storms, although fire maps still show numerous active blazes.

A satellite picture of the blazing ridge-line on August 15 is given below.  The fire is located in the center of the image and spans about 5×10 miles of the affected ridge line. You can also see the burn scars of previous wildfires in the lands surrounding the August 15-16 blaze.

Tetlin Junction Fire Tornado

Tetlin Junction Fire Tornado

(Image source: NASA/Lance-Modis)

Thawing permafrost, warming forests, Arctic heatwaves and more energetic storms combine to provide massive volumes of warming fuel and increasingly powerful ignition events in the Arctic. Not only can trees burn, but the organic carbon stored in permafrost and sometimes bottled up as methane beneath the surface also provides fuel. In many cases, fires have burned three feet deep into what was the permafrost bed below consuming roots, stumps and soil.

Very large and energetic fire outbreaks have been increasing throughout the Arctic with recent years seeing some of the worst fires on record.

Links, Credits and Hat Tips:

The Alaska Fire Service

Climate Crocks

NASA/Lance-Modis

Colorado Bob

Robin Westenra

It’s Hotter Up North than Down South: Tundra Fires Erupt Over Canada as Heatwave Pushes to Arctic Ocean Shores

Tundra Fires Near Lake MacKenzie

Tundra Fires between 62 and 66 degrees North

(Image source: NASA/Lance-Modis)

Over the past week, large tundra fires have been erupting over a section of extreme northern Canada between the Great Slave Lake and the shores of the Canadian Arctic Archipelago. With a major Arctic heatwave predicted as various extreme weather conditions arise, this region will be worth very close monitoring over the next few days.

The fires are emerging in a region of the Arctic between 62 and 66 degrees north latitude, near the Arctic Circle. In the image above, we see the Great Slave Lake in the lower left hand corner, the Great Bear Lake in the upper center, and Coronation Gulf and Amundsen Bay bordering the map’s right hand side. The fires are visible, along with their tell-tale smoke plumes and underlying scorch marks, in a region between the Great Slave Lake and Great Bear Lake. Terrain type in the regions burned include boreal forest and tundra.

Weather conditions over the past two weeks have been both warm and dry for this Arctic region. But over the past few days, temperatures have been heating up. As temperatures rose, wildfires sparked and grew. Forecasts now call for a region of very hot Arctic weather to stretch all the way to the shores of the Beaufort Sea by Friday with temperatures likely to exceed 30 degrees C (86 degrees F) over the broad stretch of land surrounding the Mackenzie Delta.

This high Arctic heat pulse is being driven north by a powerful high amplitude wave in the Jet Stream which is setting up very extreme temperature differentials between the Beaufort Sea and North Canadian land masses. Temps over the Beaufort are now in the range of -5 degrees C in some areas (about 22 F), with temperatures over land hovering, at this time, in between 15 and 23 C (60s and 70s) and predicted to surge as high as 30 C + (86 F+). This amazing temperature differential is likely also providing fuel to a powerful 978 mb (Smokey) Arctic Cyclone now traversing from the Laptev and into the Central Arctic. It will also intensify winds and drive greater heating over Arctic land masses over the next few days.

Heatwave Hits Arctic Ocean Shores

(Image source: Arctic Weather Maps)

The map indicates forecast daytime temperatures for the Northern Hemisphere land masses bordering the Arctic on Friday, August 9, 2013. Note the highly anomalous condition in which temperatures are predicted to be hotter further north, over regions near the Mackenzie Delta, than they are further south. This is an extraordinary inversion and one certainly worth putting into the context of the extreme weather conditions that are now ongoing. (Areas of red on the map indicate average temperatures in the range of 77-86 degrees (F). Maximum daily values are likely to exceed this average predicted range.)

Though not as massive or extensive as the fires raging across the Arctic Ocean in Russia, these fires are still quite large — with burn marks stretching 6 or more miles at their widest point in many cases. Another region just west of the fires shown in the image above is also experiencing a very large blaze. This complex of fires is raging along the banks of the Mackenzie River and is shown to have a fire line more than ten miles across at its widest point.

Mackenzie River Fire

Mackenzie River Fire

(Image source: NASA/Lance-Modis)

Note the extremely large scorch mark to the lower center portion of the map, with a large, energetic fire blazing in the upper right portion of the map and a smaller, though still substantial, blaze erupting to the upper left.

As noted above, fire-conducive conditions for this region are forecast to intensify well before they moderate. So this particular spate of fires may well be just starting to ramp up.

For a final note, I’d like to add the observation that this event represents a bit of rather harsh irony. These fires now rage in a region dominated by Canada’s Tar Sands Industry. Carbon is being baked and burned out of the land and soil by anomalous heat caused by human warming and not just by the immense grind and crush of fossil fuel industry. The steps of carbon extraction, in this case, have been shortened and are now out of our control.

Large, Troubling Methane Pulse Coincides With Arctic Heatwave, Tundra Fires

Siberian Heatwave July 23

Temperature color graphic. Areas in red indicate temperatures in the range of 77-86 degrees (Fahrenheit) but may not fully capture daily maximum temperatures.

(Image source: Arctic Weather Maps)

During a murder investigation, sometimes you find traces of smoke from a gun fired in relation to the crime. In other cases, sometimes you find the gun itself. Even more rarely, do you find a smoking gun dropped at a still fresh crime scene. Such was the case with the Arctic today.

The crime scene: another anomalous Arctic heat wave. The suspect: human caused climate change. The accessory: Arctic amplification. The smoking gun: major methane emission in the Arctic.

****

Yesterday, I reported that a large Arctic heat wave had settled over Siberia, once again setting off tundra fires. The heat wave was so intense that it pushed temperatures in a range of 77 to 86 degrees all the way to the shores of the Arctic Ocean even as it caused numerous massive blazes to emerge both on open tundra and throughout Siberia’s boreal forests. Atmospheric conditions — a Jet Stream mangled by human caused climate change and a large heat dome had enabled the formation of this heat wave.

But now we find something even more ominous than evidence that human global warming is moving the Jet Stream about all while pushing polar amplification into such a high gear that the terms ‘Arctic Heat Wave’ and ‘Tundra Fire’ have now become common meteorological parlance. And that thing is a large and disturbing methane pulse.

Methanesiberia7-23-13_zps5be4f30e

(Image source: Methane Tracker)

On July 21-23, a large methane emission in which numerous sources caused atmospheric spikes to greater than 1950 parts per billion flared over a wide region of Arctic Russia and the Kara Sea. This event was so massive that an area of about 500 x 500 miles was nearly completely filled with these higher readings even as a much broader region, stretching about 2,000 miles in length and about 800 miles at its widest, experienced scores of large pulses. You can see a visual representation of these emissions in yellow on the image above, provided by Methane Tracker which compiles data provided by NASA’s Aqua Satellite.

As noted above, this major event coincided with a large Arctic heat wave and numerous tundra fires that raged throughout the region. Another unprecedented occurrence in a summer of strange weather and mangled climate.

Conditions in Context

Average global methane levels are currently around 1830 parts per billion (Mauna Loa surface data). This level, about 1130 parts per billion higher than the pre-industrial average of 700 parts per billion represents an additional global warming forcing equal to at least 28% of the added CO2 forcing provided by humans. It has long been a concern among scientists that the Arctic environment, as it is forced to warm by human-caused climate change, would emit an additional significant volume of methane from carbon stocks locked in tundra and in methane stores sequestered on the sea bed. Since methane has between 25 and 105 times the heating potential of CO2, the possible added additional warming is quite substantial.

In the 2000s, a number of Arctic researchers found disturbing evidence of methane emissions coming directly from the Arctic environment. In 2013, NASA began its CARVE mission to more clearly define the Arctic’s response to human-caused warming. Its preliminary research has found methane plumes as large as 150 miles across.

Overall, the Arctic environment is already clearly adding its own methane to the global mix. We can see this in local Arctic methane measurements that average around 1900 parts per billion and above in many Arctic locations. These readings are about 70 parts per billion above the global average. This week’s large methane pulse where a broad region experienced methane levels of 1950 to 1980 parts per billion is yet more evidence that the Arctic is beginning to provide a dangerous and troubling amplifying feedback to the already break-neck pace of human warming. In total, around 2,500 gigatons of methane are thought to be locked in carbon stores both in the Arctic tundra and in hydrates (frozen methane and water) on the Arctic Ocean floor.

Though a dangerous and troubling addition to a human-caused warming that is already changing the world’s weather in harmful and damaging ways, this particular methane pulse is not yet evidence of runaway global warming. In a runaway, Arctic methane emissions would likely exceed 500 megatons per year, which would be enough to raise global levels by about 150 parts per billion or more annually. Such a runaway would be a global nightmare requiring an unprecedented human response if Earth’s life support systems were to be preserved in any rough corollary to what we enjoy today. Though such an event is probably still low-risk (but perhaps as high as 10-20 percent), it cannot be entirely ruled out due to the speed and violence at which human greenhouse gas emissions are altering Earth systems.

So the prudent course would be for a rapid response as if such an event were imminent. The reason is that a runaway methane emission in the Arctic would cause severe and untold damage and harm.

To this point, Peter Wadhams is warning that about 50 gigatons of methane are at risk of rapidly destabilizing should the Arctic sea ice melt in the next two years. The region in which these methane stores are locked is the East Siberian Arctic Shelf, a shallow sea that is very vulnerable to rapid warming and methane release. Wadhams notes:

The loss of sea ice leads to seabed warming, which leads to offshore permafrost melt , which leads to methane release, which leads to enhanced warming, which leads to even more rapid uncovering of seabed. If a large release has not occurred by 2016 the danger will be continuously increasing. It is thought that at 2-3C of global warming, which means 6-8C of Arctic warming, methane release from permafrost on land will be greatly increased.

Those who understand Arctic seabed geology and the oceanography of water column warming from ice retreat do not say that this is a low probability event. I think one should trust those who know about a subject rather than those who don’t. As far as I’m concerned, the experts in this area are the people who have been actively working on the seabed conditions in the East Siberian Sea in summer during the past few summers where the ice cover has disappeared and the water has warmed. The rapid disappearance of offshore permafrost through water heating is a unique phenomenon, so clearly no “expert” would have found a mechanism elsewhere to compare with this.

Perhaps, equally troubling, is that large regions of permafrost are now also thawing. In the Hudson Bay region, an area that saw unprecedented heat, dry conditions and wildfires this year, permafrost temperatures have risen by .45 degrees Celsius. Peter Kershaw, an adjunct professor of earth sciences at the University of Alberta, who was in Churchill recently on a research project noted:

“It’s a big concern and so far not well-quantified. That organic material is being made available for decomposition. It’s out of the freezer and sitting on the counter.”

Though most climate scientists do not currently believe that such a rapid release of methane is possible over such a short period, we do have to ask ourselves — what if Wadhams and others like him are right? In such a case we could see a catastrophic warming of up to 5 degrees C by 2050, far beyond anything mainstream models or paleoclimate would suggest. But the human rate of climate forcing that is now more than ten times anything seen during the geological record puts us in a context that is entirely out of previous reckoning. So these warnings by Wadhams should be listened to, heeded, and taken into account. (Hat Tip to commenter Colorado Bob for the head’s up on these articles).

More likely, however, is that a combination of methane release from the tundra and the ocean floor and a loss of albedo (reflectivity) due to ice sheet loss will result in an effective doubling or more of the initial human greenhouse gas forcing over the coming decades and centuries. Such a response is still very dangerous in that it risks locking in, long term, already damaging changes to the world’s environments. Should the Earth System fully respond to the 400 ppm CO2 and 1830 ppb methane we’ve already achieved through our emissions , we can expect at least a 3 degree Celsius global temperature increase and long-term sea level rise of between 25 and 75 feet. Such changes would severely damage both human infrastructure and the environments upon which human-based agriculture depend for its now vast food production. In addition, a 24% increase in the hydrological cycle and a number of destabilizing changes to the world’s weather systems would cause severe added damage.

A rapid Earth Systems feedback response risks these changes at current greenhouse gas levels. And since we are now seeing both methane release and ice sheet response, a level of these feedbacks are already in play, showing a far greater risk than initial forecasts indicated. Further greenhouse gas emissions risk even more damaging potentials, possibly locking in ever-greater consequences. For this reason, any global policy that does not seek to fully mitigate such new and over-riding risks by planning a complete phase out of carbon emissions is an unconscionable policy to open the door to immeasurable harm to human lives and the living systems of our world upon which we depend.

These first methane burps are a warning for us to act now, before our capacity to act is seriously degraded and before events start to spiral beyond the point of rational control. We have had other warnings which we have, so far, mostly ignored. And though the responses by the Obama Administration and World Bank to de-fund new coal plants are encouraging, we should redouble our efforts now, lest we enter an age of bitter regret as the consequences of our carbon emission form a trap that is difficult or impossible to escape.

From Archangel to Alaska, Heatwaves, Extreme Weather Now Flank the Arctic

Arctic Heatwave June 26th

(Image source: Uni Koeln)

Yesterday in Alaska, as wildfires raged through interior regions, temperatures rose into the high 80s (Fahrenheit). Now, during relative night-time in the land of the midnight sun, lows are hovering around 70 in many places (near record daily highs for this time of year). Meanwhile, at the Arctic’s opposite end, temperatures in the region of Archangel, near the Arctic Ocean are in the range of 90 degrees. Nearby, Finland also sees temperatures rocketing up through the 80s as a Scandinavian heatwave that began in June reasserts itself.

The Arctic Heatwave: A Pervasive Feature for Summer 2013

The Arctic heatwave that started in Scandinavia then moved to Alaska and flared in Russia and Siberia has now become nearly ubiquitous. Record hot temperatures range the Arctic from shore to shore. These record heat invasions have been enabled by a combination of factors that include rising global greenhouse gasses, above average atmospheric methane and CO2 concentrations in the Arctic, and a rapid retreat of snow and sea ice cover that has enabled the Jet Stream to range further and further north, bringing temperatures from more southerly climates with it.

As a sample, atmospheric CO2 is now at about 403 parts per million at Barrow Alaska, while methane levels are around 1890 parts per billion. These levels are about 4 parts per million and 60 parts per billion above current global average CO2 and methane levels respectively. Higher levels of these heat trapping gasses in the Arctic are a direct result of environmental emissions sources including thawing tundra, melting permafrost, and destabilizing frozen methane on the Arctic sea bed. Together, these sources result in substantially higher levels of almost all greenhouse gasses over a broad range of the Arctic.

Extreme Jet Stream positions are also plainly visible today with a large, anomalous peak in the Jet Stream over Scandinavia and extending into Russia along with a fading, but still apparent, ‘heat dome’ high pressure system over central Alaska:

Extreme Jet Stream June 26

(Image source: California Regional Weather Service)

Both these features continue to bring much warmer than normal conditions in regions beneath their influence. The Scandinavian blocking pattern has been particularly persistent, with weather impacts stretching all the way back to early June. One last feature of note is a cut-off upper level low just off the Pacific coast of British Columbia. This particular low pressure system was the one that resulted in so much flooding over regions of Alberta and Calgary last week with rainy conditions persisting through today. A large band of clouds and rain storms continues to stream off this low, dumping more un-needed moisture over central Canada. Among today’s impacts was the flooding and shut-down of a meat-packing plant, yet one more ding to the world’s food supply.

ECMWF forecast models show this rough configuration of the Jet Stream remaining in place at least until July 6th when the Scandinavian blocking pattern begins to stage a major warm-air breakthrough to the Central Arctic. At the same time, a large trough of low pressure systems emerges again over regions of Alberta and northern Canada as a ridge of high pressure shoves what remains of PAC 2013 over Greenland and comes to take tenuous hold of the Central Arctic.

Forecast Model July 6

(Image source: ECMWF)

Note the above freezing 5,000 foot temperatures plunging all the way through the Central Arctic (which should translate to around 40-45 degree [F] surface temperatures). It is also worth noting the large pulse of warm air riding all the way up to the Canadian Archipelago ahead of the developing trough.

This forecast is still very far out, so we’ll have to keep watch for any changes. Yet given the history of summer 2013 Arctic weather, it appears likely that the ongoing extreme configuration of the Jet will result in more unusual events.

As a final, I’ll leave you with this picture of the expanding open water at Barrow, Alaska. Note that the off-shore ice has been gone since June 24th.

Open Water Barrow June 26

(Image source: Barrow Sea Ice Cam)


Links:

Uni Koeln

California Regional Weather Service

ECMWF

NOAA