Glacial Outburst Flood — Human Hothouse Displaces Hundreds in Tajikistan

If you lived during the 1880s, when the globe was one degree Celsius cooler than it is now, you’d see far less in the way of heatwaves. But an immense vomiting of greenhouse gasses into our atmosphere and oceans by fossil fuel industry since that time has greatly multiplied these periods of extreme temperatures. So much so that you are now four times more likely to experience a heatwave anywhere on the globe at any given time than you were 135 years ago.

Heatwaves, depending on their intensity, can have serious consequences. The most direct impact is due to the excess heat itself. In the more extreme instances, heatwaves during recent years have featured an ominous capacity to hospitalize tens of thousands. These heat stroke victims, in the worst cases, perish. Such was the case for India and Pakistan this year where hundreds tragically lost their lives due to the impact of increased heat alone.

But if heatwaves occur in regions where glaciers still exist, the impact can be even more profound.

Glacier Outburst Flood In Tajikistan


(“The lake disappeared and turned to salt…” Melting of glaciers in Tajikistan is having a far-reaching impact. This UN-based program describes how the lives of Tajikistan’s people are being threatened by water loss due to glacier decline. But the impacts of glacier outburst floods can be more directly destructive.)

In Tajikistan, the heat is bringing with it a great decline in high elevation glaciers. Some have already disappeared. It’s a loss resulting in severe impacts to both energy and water security for the country. But perhaps even more disturbing is what happens when water is suddenly released from the dwindling glaciers.

Such was the case with Tajikistan this month. Beginning on July 16, an oppressive heatwave settled over this Central Asian nation. Temperatures rocketed to record levels. Baking its broad mountains — valleys, slopes and glaciers alike.

Crammed between Afghanistan, Pakistan, China, Kyrgyzstan and Uzbekistan, Tajikistan squats along the northwest boundary of the Tibetan Plateau. The upthrust of great glacier-capped peaks tower over this country. Peaks whose heads are loaded with a great volume of ice that is now being forced to rapidly melt.

This month’s record heatwave dealt a terrible blow to that ice. The glaciers, of which Tajikistan boasts 8,492, were already greatly weakened by a 3 degree Celsius temperature increase over the past five years. All it took was the shove of the most recent temperature surge to push some of these to the breaking point. By Tuesday, a great outburst flood had ripped through the mountain valleys of the Central Asia country. The outburst flood waters roared out, overtopping rivers — washing away more than 50 homes, cutting off major roadways, and driving 620 persons into government disaster shelters.

Unfortunately, this most recent climate change mass casualty event may be just one of many. In Tajikistan, a mud dam has developed along the path of major glacial melt. Water pressure is building behind the dam. Should it release, more than 30,000 people will be in the path of the outburst flood.

Risk of Outburst Flooding Near Large Glaciers is a Global Hazard

All throughout the Tibetan Plateau region glacial outburst floods related to human-caused warming are on the rise (see the glacial megaflood). As much as 70 percent of the ice within the great Himalayan glaciers could melt out by 2100 under business as usual fossil fuel burning. The result would be a crescendo of glacial outburst floods followed by a period of drastically increased aridity for the lands around Tibet.

Alaska. Prince William Sound, waterfall flows from under Blackstone Glacier.

Alaska. Prince William Sound, waterfall flows from under Blackstone Glacier.

(The high elevation of glaciers combined with the vastness of their captured water and the often steep grades upon which they perch can generate violent flooding in the event of rapid melt. In many instances, silt from glacial outflows can develop a dam downstream of the glacial flood. Such dams are often unstable and can be subject to catastrophic collapse. In the worst cases, ice dams can form in the interior sections of very large ice sheets — such as those seen in Greenland and Antarctica. Glacial outburst floods due to such melt and ice dam formation in the major ice sheets are catastrophic events of geological scale and impact. Image source: ADT.)

Glacial outburst floods are sudden, powerful, violent, and difficult to predict. They are limited only by the amount of water the glaciers themselves release — ice masses that hold volumes of water often measured in cubic kilometers. The drastic impacts and terrible violence due to this kind of flooding was also recently witnessed during 2013 in Kedarnath, India. And what we see in Tajikistan and India during recent years is, sadly, just a taste of what’s to come in a fossil fuel emissions warmed world.

Finally, in this narrative, we cannot ignore potential glacial outburst flood impacts from melting over the Greenland Ice Sheet and Antarctica. And unlike Tibetan glacial melt, potential outburst flood events issuing from Greenland or Antarctica are a hazard of global scope. Such events would likely be driven by extended periods of rainfall over the ice during summer heating events. An ominous melt-driving phenomena that science is just now starting to track.

Links:

Heatwave + Glacial Melt Forces Hundreds to Flee in Tajikistan

Human Hothouse Death Toll Climbs to 2300 in India

Wet Bulb at 33 C

Freakishly High Temperatures Trigger Melt, Mudslides, Flooding in Tajikistan

The Glacial Megaflood

ADT

Amplified Melt and Flow of Greenland Ice Sheet Driven by Late Summer Rainfall

Hat Tip to TodaysGuestIs

Hat Tip to Colorado Bob

Bill’s Extreme Rains Heading Toward Global Warming’s Brown Ocean Over Central US

At 11:45 AM EST today Tropical Storm Bill slugged its way over the Texas Coastline near Matagorda Island. The storm, packing sustained winds of 60 miles per hour and a minimum central pressure near 997 mb was relatively mild as Tropical Cyclones go. But Bill is heavily entrenched in a long train of tropical moisture straddling the Gulf of Mexico and flooding up from an intensifying Pacific El Nino. It therefore represents an extreme flood risk for a massive region stretching from Texas through a good chunk of the Central US.

Bill Landfall

(Bill makes landfall along Texas’s Central Gulf Coast dragging a huge train of thunderstorms along with it. Recent extreme floods have saturated the lands of Texas, Oklahoma and the Central US creating a condition that NASA researchers now call a Brown Ocean. The water saturation of the land mass due to extreme rainfall events and increased atmospheric moisture loading associated with climate change is a condition that some scientists believe may increase the likelihood of tropical storms, like Bill, intensifying over land. Image source: NOAA.)

As Bill moves northward, it is expected to pull this massive band of moisture behind it. The result is that areas of Texas already saturated with moisture from last month’s heavy rains could see 6-10 more inches in a broad band and greater than 12 inches locally near the San Antonio and Dallas region. Bill is projected to then sweep northward through Oklahoma and on through a wide crescent of the Central US — dumping 2-6 inches of rain with locally as much as 8 inches directly along its path.

Such heavy rainfall and thunderstorms associated with Bill have the potential to set off a repeat of the kind of epic deluges this same region witnessed over Memorial Day. And due to the fact that grounds are already saturated and many streams remain near flood stage, this particular event has a high risk of producing even more extreme flooding.

Bill extreme rainfall potential

(Bill shows extreme rainfall potential over areas still recovering from record flooding late last month. Image source: National Hurricane Center.)

Bill and Global Warming’s Brown Ocean

This extreme rainfall potential arises from a combination of factors. The first is the added moisture loading over the region due to El Nino combined with the record high global temperatures of human caused climate change — which increases the atmosphere’s ability to carry water vapor and accelerates the hydrological cycle. The second is a related potential feature likely linked to this extra moisture — a circumstance that scientists have called ‘the Brown Ocean.’

The 2013 NASA Brown Ocean study showed that:

A Brown Ocean environment consists of three observable conditions. First, the lower level of the atmosphere mimics a tropical atmosphere with minimal variation in temperature. Second, soils in the vicinity of the storms need to contain ample moisture. Finally, evaporation of the soil moisture releases latent heat, which the team found must measure at least 70 watts averaged per square meter. For comparison, the latent heat flux from the ocean averages about 200 watts per square meter.

Brown Ocean Cyclones

(Since 1979 16 Tropical Cyclones have maintained TC characteristics while intensifying or keeping a steady strength over land. Bill has a potential to become one of these freakish systems. Image source: NASA.)

Brown Oceans can thus form over areas that have received extremely heavy rainfall and are experiencing hot, moist tropical conditions. The result is increased evaporation that mimics features similar to those of a warm sea surface. In such cases, Tropical Cyclones can intensify over land due to the effect of the extra moisture bleed-off. And it is these conditions that atmospheric scientists are warning now predominate over Texas:

“All the things a hurricane likes over the ocean is what we have over land right now,” said Marshall Shepherd, director of atmospheric sciences at the University of Georgia and one of the leads of a NASA-funded Brown Ocean study.

It’s worth noting that Brown Oceans have not been officially linked to human caused climate change. But the factors that feed Brown Oceans — high heat and humidity that is the upshot of very extreme rainfall events — are multiplied in a warming world. And it’s this kind of moist hot zone that Bill is now barreling toward.

Links:

NASA’s Brown Ocean Hurricane: Global Warming Amps Up Hydrological Cycle to Produce Cyclones that Strengthen Over Land

Brown Ocean Can Fuel Inland Tropical Cyclones

Brown Ocean May Fuel Tropical Storm Bill Over Land

National Hurricane Center

NOAA

Global Warming Accelerates the Hydrological Cycle, Resulting in More Extreme Drought and Precipitation Events

Steaming Equatorial Pacific Sees Winds Blowing Toward Monster El Nino

Last year, we raised a warning that the 2014-2015 El Nino could develop into a monster event. And, unfortunately, there is some indication that conditions may well be continuing in that direction.

*   *   *   *

All across the broad belt of the Equatorial Pacific, sea surface temperatures are running in the hot-to-extraordinarily hot range. Starting just north and east of New Guinea, 1 C + above average temperature anomalies run uninterrupted to a zone near the date line where they encounter a hot pool in the range of +2.6 to +3.1 C above average. Running eastward, these high heat anomalies gradually taper off to +1.4 to +1.7 C along a 5,000 mile stretch before they again spike to +3 to +4 C above average just off the west coast of South America.

A massive zone of above average sea surface temperatures encompassing almost the entire width of the Equatorial Pacific:

image

(Pacific Ocean showing extreme heat anomalies across most regions. Image source: Earth Nullschool.)

Hot equatorial waters in a Pacific Ocean that, from Arctic north to Austral south, from East Asian shores to the west coasts of the Americas is a morass of record high temperatures. An ocean zone featuring few and dwindling pools of lower than average readings. Oceans undergoing rising rates of heat-related sea creature die offs in waters that, when they warm, lose vital oxygen and host toxin-producing microbes that thrive in hot water.

It’s a freakishly hot Pacific. A strange ocean. One that we aren’t quite accustomed to. One in the grips of what is already a moderate strength El Nino. An El Nino that, combined with an extraordinary human greenhouse gas heat forcing, has pushed global surface temperatures into record high range for 2014 and the first three months of 2015 thus far. An El Nino which is now threatening a new leap to monster status.

For a powerful Kelvin Wave is presently lending heat to equatorial surface waters after receiving a boost from gale force westerly winds associated with the strongest Madden Julian Oscillation on record this past March. An raging equatorial heat engine that is now drawing yet more energy from a second set of strong westerlies developing this week.

image

(Strong westerlies emerging in the Western Pacific on May 6 may provide yet another boost to the 2014-2015 El Nino. Image source: Earth Nullschool.)

In the above GFS summary, we find sustained winds in the range of 30 mph with gale force gusts in a region along and just north of the Equator near New Guinea. The winds are in association with a developing cyclone, one that models indicate will reach strong Typhoon status later this week. The westerlies stretch westward along the back of New Guinea and on toward the Philippines. There, they receive a boost from another cyclone — Tropical Storm Noul.

The result is a brisk set of westerlies running against the trades along hundreds of miles of open ocean. The kind of event with the potential to further strengthen an El Nino that is already at respectable intensity.

This week’s CFSv2 NOAA forecast models continued to indicate an extreme strength El Nino by later this year. Weighted models are now showing seasonal anomalies in the Nino 3.4 zone peaking out at +2.3 C. Weighted monthly models are showing peaks in the range of +2.5 C above average for Nino 3.4. And unweighted models are showing peak averages that now exceed +3.1 C. This is a jump from last week’s CFSv2 forecast. Another set in a continued trend for higher intensity.

Monster El Nino forecast

(NOAA’s forecast models show potential for extreme El Nino starting in June and extending into January. Image source: NOAA.)

Should such an event emerge it would truly be a monster. Something far worse than even the Super El Nino of 1998.

An extraordinary El Nino of this kind would have far-reaching climate and weather related impacts. It would push global temperatures into ever more dangerous ranges. It would strain global carbon sinks. And it would worsen drought and/or set off heavy precipitation events in various, already vulnerable regions of the globe. With model forecasts continuing to hit higher values, with so much available heat to fuel El Nino ranging the Pacific, and with strong westerlies continuing to reinforce the current El Nino, this is a situation that bears very serious continued monitoring.

Links:

Monster El Nino Emerging From the Depths

NOAA’s Climate Prediction Center

Earth Nullschool

March Shows Strongest Madden Julian Oscillation on Record

Starving Sea Lion Pups and Liquified Starfish


Ocean Dead Zones Swirl Off Africa, Threatening Coastlines with Mass Fish Kills

The world ocean is now a region of expanding oxygen-deprived dead zones.

It’s an upshot of a human-warmed ocean system filled with high nutrient run-off from mass, industrialized farming, rising atmospheric nitrogen levels, and increasing dust from wildfires, dust storms, and industrial aerosol emissions. Warming seas hold less oxygen in solution. And the nutrient seeding feeds giant algae blooms that, when they die and decompose, further rob ocean waters of oxygen. Combined, the two are an extreme hazard to ocean health — symptoms of a dangerous transition to stratified, or worse, Canfield Ocean states.

Coastal Dead Zones -- No Fish Left

(Geographical extent of more than 405 coastal dead zones worldwide. New dead zones discovered by scientists are now traversing mid-ocean regions. Image source: No Fish Left.)

In total, more than 405 dead zones now occupy mostly coastal waters worldwide. Covering an area of 95,000 square miles and expanding, these anoxic regions threaten marine species directly through suffocation or indirectly through the growth of toxin-producing bacteria which thrive in low-oxygen environments.

Mobile, Anoxic Underwater Cyclones

Now, according to new research published in Biogeosciences, it appears that some of these dead zones have gone mobile.

The report finds zones of very low oxygen covering swirls of surface water 100-150 kilometers in diameter and stretching to about 100 meters in depth. The zones churn like whirlpools or eddies. Encapsulated in their own current of water with oxygen levels low enough to induce fish kills, these ‘dead pools’ have been discovered swirling off the coast of Africa in recent satellite photos.

The ‘dead pools’ form as strong ocean eddies break off from West African ocean currents. The eddies create mixing environments near the surface which fuels algae blooms (seen as the light blue coloration in the image below). Large algae blooms are trapped in the eddy and as the algae die, they rob the water column of oxygen. The flows of the eddy form as a kind of wall to mixing with higher oxygen surrounding waters. As a result, the oxygen readings within the dead pool plummets.

Dead Pool Eddy 2

(Newly discovered ocean dead pools like the one shown above are propagating off the coast of West Africa. These eddies are mobile dead zones of low oxygen water. A new phenomena, they represent a unique threat to ocean health in addition to the 405 other, mostly stationary, dead zones in the world’s coastal waters. Image source: Biogeosciences.)

According to lead-author Johannes Karstensen, a researcher at GEOMAR, the Helmholtz Centre for Ocean Research Kiel, in Kiel, Germany:

“The fast rotation of the eddies makes it very difficult to exchange oxygen across the boundary between the rotating current and the surrounding ocean. Moreover, the circulation creates a very shallow layer – of a few tens of meters – on top of the swirling water that supports intense plant growth. From our measurements, we estimated that the oxygen consumption within the eddies is some five times larger than in normal ocean conditions.”

Researchers found levels in these swirls to be less than 0.3 millilitres of oxygen per litre of seawater or about 1/100th the oxygen content of surrounding ocean. These are readings low enough to produce mass fish kills and to support production of toxin-producing bacteria harmful to oxygen dependent life.

Azores Downrange of Dead Pools

The zones were observed moving through the Tropical North Atlantic west of Africa. They propagated toward the north and west, finally petering out about 100 kilometers north of the Azores. This puts that East Atlantic archipelago directly in the line of fire of these new, low-oxygen eddies. A cause for concern. If one of these eddies were to enter the Azores the result could be a massive fish die off around the island chain.

Karstensen notes:

“…it is not unlikely that an open-ocean dead zone will hit the islands at some point. This could cause the coast to be flooded with low-oxygen water, which may put severe stress on the coastal ecosystems and may even provoke fish kills and the die-off of other marine life.”

Observations of these dead pools seems to indicate they are a new event. A possible result of nutrient enrichment of the surface waters in West African currents due to increased run-off or surface water nitrogen and dust seeding. As extreme rainfall events related to climate change wash more sediment down rivers and into the oceans, as more nitrogen compounds and particulate matter hit the atmosphere due to fossil fuel emissions, wildfire burning, and dust storms, and as sea level rise starts to flood nutrient-rich low lying areas, it is possible that the Tropical Atlantic dead pools represent an emerging ocean state that will grow more prevalent as time moves forward.

(UPDATED — 2037 EST, 5 May, 2015)

Links:

Dead Zones Moving West

Dead Zones Found in Atlantic Open Waters

VIMS: Dead Zones

No Fish Left

Ocean Dead Zones

Through the Looking Glass of the Great Dying

Hat Tip to Colorado Bob

Hat Tip to DT Lange

Hat Tip to Jeremy Beck

Climate Change Induced Drought and Fire at Critical Stage in Chile — Construction of 12 Desalination Plants Underway

In the National Forests of Chile, it’s been burning since February.

An intense upshot of the stifling of water supplies through month after month of heat and lack of rainfall. A kind of intense onset, persistent drought that has become all too common in a world in which atmosphere, ice and ocean temperatures keep rocketing on to new record highs.

Starting February 17th, massive fires erupted, spreading swiftly through Chile’s forested mountainsides and valleys, threatening protected woods and endangered species. The fires have continued off and on now for more than a month — fueled by hot winds and a record drought that has forced the nation to build 12 desalination plants in a desperate effort to restore the country’s ebbing water supply.

Chile Fires February 17Chile Fires March 24

(Side by side frames of same region of Chile on February 17 [left frame] and March 24 [right frame]. For reference, bottom edge of frame is approximately 100 miles. Right frame is slightly off-set toward the east. Image source: Lance-Modis.)

Reports from BBC indicated that today’s fires are burning in three protected national parks: China Muerta National Reserve, Nalca Lolco National Reserve and Conguillio National Park. The fires threaten ancient growth forest that is the abode of the majestic Araucaria araucana trees. A kind of pine that can live up to a thousand years. Over 4,500 hectares are now burning and the smoke is plainly visible in the NASA satellite shot (right frame in the image sequence above). Fully fifteen fire brigades are involved in what is currently a massive firefighting effort.

Overall, the fires that have been raging for more than a month throughout Chile have consumed an exceptional 91,000 hectares — nearly double the 59,000 hectare per year average over the last five years. Years that themselves experienced increased heat, drought, and burning.

This extreme burning comes as Chile faces a ramping, multi-decadal water shortage set off by human warming. Climate scientists there have indicated a high risk of drastically increased drying throughout Chile over the next 35 years through to 2050 due to climate change related impacts.

According to President Michele Bachelet the country’s current drought situation is already at critical stages. Bachelet recently announced millions of dollars in funds to drill for underground water and to construct desalination plants to provide drinking water to fight ramping drought conditions with the ugly prospect of more to come.

In a report today from BBC, Bachelet noted that the situation was now endemic and expected to worsen:

“Faced with this critical situation, there is no choice but to assume that the lack of water resources is a reality that is here to stay and that puts at risk the development of important regions of our country.”

Though climate change is expected to continue to ratchet down on drought impacts to Chile — increasing heat, melting critical glacial ice, and drying out forestlands — this year, at least, there appears to be some hope for an end to the stifling heat and the ongoing fires. Hints of the first rains of autumn have now begun to show up in Central and Northern Chile.

But by 2050 with the world expected to be between 1.5 and 2.5 degrees Celsius hotter than 1880s averages, the autumn rains will have been brutally beaten back — retreating further and further into fall. In that time, the heat and dryness of spring and summer will come early and the great glaciers upon which Chile depends so much for its water will be but wan shadows of former grandeur. If they exist at all.

Links:

Forest Fires Rage in Chile — Made Worse By Wind and Drought

Chile Declares Forest Fires Alert

Lance Modis

Hat tip to Colorado Bob

The Human-Warmed Southern Ocean Threatens Major Melt For East Antarctica

Totten Glacier. A mountainous expanse of ice in the very heart of the greatest accumulation of frozen water on Earth. A bastion of cold containing 11.5 feet worth of sea level rise if it were to melt in total. An accumulation roughly equal to half of all the frozen water in the whole of the Greenland Ice Sheet.

According to a new scientific report out this week, Totten Glacier is under threat of melt. Warm water is swelling up through troughs in the Continental Shelf zone, approaching the ice shelf locking Totten and a vast swath of interior East Antarctic glaciers. As with West Antarctica, this warm water upwelling has the potential to rapidly destabilize an already fast-moving glacier.

Totten Glacier basin

(Totten glacier outflow zone covers a massive region of East Antarctica. An area about equivalent in size to the entire US Southeast region. Warm water is starting to encroach upon an ice shelf locking this great ice mass into its Continental Catchment Basin. Image source: Australian Antarctic Division.)

Totten already hosts one of the most rapid thinning rates in East Antarctica. And, in fact, it was a satellite detection of this very thinning that set off a recent scientific investigation of the glacier’s stability. What the new scientific report identified was a threat that enhanced warm water upwelling from a human-heated circumpolar current would collide with an ice structure that is already vulnerable to melt.

The net result would mean a destabilization and acceleration of one of the greatest ice masses on the planet. Such an event would have far-reaching implications, especially relating to the pace and end state of warming-related global sea level rise.

From the abstract of Ocean Access to A Cavity Beneath Totten Glacier:

Totten Glacier… has the largest thinning rate in East Antarctica. Thinning may be driven by enhanced basal meltingWarm modified Circumpolar Deep Water, which has been linked to glacier retreat in West Antarctica, has been observed in summer and winter on the nearby continental shelf beneath 400 to 500 m of cool Antarctic Surface Water…We identify entrances to the ice-shelf cavity below depths of 400 to 500 m that could allow intrusions of warm water if the vertical structure of inflow is similar to nearby observations. Radar sounding reveals a previously unknown inland trough that connects the main ice-shelf cavity to the ocean. If thinning trends continue, a larger water body over the trough could potentially allow more warm water into the cavity, which may, eventually, lead to destabilization of the low-lying region between Totten Glacier and the similarly deep glacier flowing into the Reynolds Trough. (emphasis added)

At issue are two pathways for this upwelling, warm, deep water to follow:

totten_glacier_labeledpaths

(Topographic map of the Totten Glacier outlet region and nearby seabed. Note the vulnerable water inlets [orange lines], the inland troughs and basins [red highlights and blue topographic signature] and the rather advanced inland extent of the grounding line [white line]. Image source: Ocean Access to a Cavity Beneath Totten Glacier.)

The pathways are identified by the orange lines in the topographic image above. The lines identify underwater valleys that run out to the deeper, warmer waters accumulating on the edge of the Antarctic Continental Shelf region. As the waters rise, scientists are concerned that these troughs will act like channels, funneling a flood of much warmer than normal water beneath the belly of the great glacier.

The result is an instance of ‘global consequence.’ The authors note:

We estimate that at least 3.5 m of eustatic sea level potential drains through Totten Glacier, so coastal processes in this area could have global consequences.

Indeed. If we add in all the other destabilized glaciers around the world to Totten, should it destabilize, you end up with about 26 feet of sea level rise locked in. And that has some pretty staggering consequences when you look at impacts to the world’s coastlines.

This is what 20 feet of sea level rise impact looks like for the US Southeast and Gulf Coasts:

NASA six meter sea level rise SE

(Six meters of sea level rise would permanently inundate many of the major cities along the US Gulf and Southeastern coasts. Areas inundated shown in red. Image source: NASA.)

But, perhaps worst of all, is the fact that some of the world’s longest lasting and most stable accumulations of frozen water are now under threat of melt.

In essence, what we are witnessing is possible initiation of the end of the greatest and oldest ice province on Earth. East Antarctica glaciated 35 million years ago, when atmospheric CO2 levels fell below a range of 500-600 parts per million, and has been mostly stable or growing ever since. Now that region of ice, the most ancient remaining in the memory of Earth, is under threat. With human greenhouse gasses in the range of 484 ppm CO2e (CO2 equivalent) and 400 ppm CO2 and rising, it appears that even the oldest glaciers are under existential threat.

To this point, Eric Rignot noted in a recent interview:

“..the stage is set. You have a submarine glacier and a deep trough. The warm water is not too far from that frontal region and we’ve seen some changes in the glaciers that suggest that something is happening at their base.”

Links:

Ocean Access to A Cavity Beneath Totten Glacier

Hidden Channels Beneath East Antarctica Could Cause Massive Melt

Australian Antarctic Division

NASA

A Glacier Area the Size of the Entire South is Melting Away

Arctic Sea Ice Flirts With New Record Lows Dragging Global Coverage Inexorably Down

It’s another winter of far above average temperatures for the Arctic.

Warm air has risen — south to north — over both the North Atlantic and Pacific. It has ridden through the Bering and Barents seas. And it has invaded an Arctic sea ice pack that is far, far more fragile than it has ever been in modern human reckoning.

image

(A parade of warm fronts predicted to run up through the North Atlantic and Barents between Greenland and Northern Europe and on up into the Arctic Ocean on Thursday, March 5. The warm fronts are indicated by regions of perpendicular wind flow across the meridional pattern running northward from the Eastern Seaboard of North America and on into the Arctic. It is a pattern we’ve seen frequently throughout the winter of 2014-2015. One that has resulted both in Arctic warming and extreme polar vortex excursions. Image source: Earth Nullschool. Data Source: Global Forecast Systems Model.)

The winds have been fed by the warmest ocean surface temperatures ever seen in the aftermath of the hottest year on record (2014). They have pushed against ice packs off Irkutsk in Russia. They have driven ice northward and melted it throughout the Bering. And they have pushed 10-20 foot waves against the ice along the coasts of Greenland, in the Strait near Svalbard, and in the Barents west of Novaya Zemlya.

Near Record Low Arctic Sea Ice

This warm air influx has had a strong effect on the sea ice. Even in the far north near the pole, sea ice has been occasionally observed to thin this winter, reaching 80-90 percent concentration in a broad patch just south of the pole. Marked thinning for an area from which thicker, multi-year ice has undergone an extended retreat and 2 meter thick ice is now the mainstay. A mere shadow of ice for a region that once featured great hills and mounds of stable ice bounded by bridges between the North American and Asian Continents.

Now, over the greatly thinned and reduced ice, periods when temperatures have neared or even exceeded the point at which sea ice melts (28 F) have become more and more common in a broad wedge covering the Arctic Ocean between Novaya and the pole itself. When combined with the warm waters continuing to invade the Arctic Ocean from the flanks and from below, it’s enough to have again pushed sea ice to near record low extents for this time of year:

chart

(Arctic sea ice extent for March 1 of 2015 shown by the purple line sandwiched between the orange line [2011] and the pink line [2006]. Yesterday’s sea ice extent was second lowest in the record with 2006 being the lowest and 2011 running in as third lowest for the date. 2012 [dotted green], 2007 [light blue] and 1979 [dark blue] were added for reference. Image source: NSIDC.)

At the current measure of 14,450,000 square kilometers, that’s well less than what we’ve seen during previous decades. More than 2,000,000 square kilometers, or about an area the size of Greenland, less than 1979’s extent for March 1, for example.

And the total could well go lower — testing new record ranges for early March. For the Arctic is about to see another major influx of warm air.

Starting tomorrow and through Saturday, warm southerly winds will ride up into both the Bering and through the Barents side of the Arctic Ocean east of Novaya Zemlya. The warm air influx will be strongest through the Barents region, pushing temperatures as warm as 30 F to withing 200 miles of the North Pole:

image image

(Forecast for Wednesday finds 30 F temperatures riding up through the Barents and deep into the Arctic Ocean to within 200 miles of the North Pole. Note that similar temperatures appear in Ohio on the same day in the second frame. Image source: Earth Nullschool. Data source: Global Forecast Systems Model.)

For comparison Ohio, many hundreds of miles to the south and well outside the Arctic, will see the same reading at the same time. It’s another major warm air influx that will again drive against the ice pack. A continuation of a decades long assault that will bring with it further threat of record lows in Arctic sea ice. One that could set the 2015 melt season up for a rather low launching pad if the major gains seen during this time of year in 2012, 2013, and 2014 don’t manage to materialize.

NASA Study Finds 35,000 Square Kilometers of Sea Ice Lost Each Year Globally

As Arctic sea ice faces the potential for new all-time lows, a recently released NASA study puts these losses in a global context.

This important broader assessment shows that both Arctic sea ice loss and global sea ice loss since 1979 has followed an unequivocal trend of thinning and recession. This ongoing loss is despite the fact that Antarctica has seen some minor gains in sea ice extent during that same period.

Claire Parkinson, author of the study, noted:

“Even though Antarctic sea ice reached a new record maximum this past September, global sea ice is still decreasing. That’s because the decreases in Arctic sea ice far exceed the increases in Antarctic sea ice.”

A graphic illustration of sea ice trends shows how rates of global and Arctic decline compare when adding in the slight and far more gradual sea ice gains occurring near Antarctica:

polar_trend_graphs_1979-2013

(NASA Polar Trend Graph shows Arctic, Antarctic, and combined global sea ice trends. Note the slight gain for Antarctica as compared to a precipitous fall for the Arctic even as the global trend shows a marked downswing. Image source: NASA.)

Massive losses in the Arctic are likely due to the fact that the sea ice there sits upon a warming ocean surrounded by warming continents. By contrast, Antarctic sea ice sits in the Southern Ocean whose surface waters are often cooled both by winds and by an increasing outflow of cold, fresh water from the melting Antarctic glaciers. Factors that serve as a minor surface counter-trend to the larger warming signal. A signal, that for Antarctica, is driving an assault of warm water at the ice sheets from the depth of hundreds of feet below the ocean surface.

Overall, the Arctic has lost of an average of 2 million square kilometers since 1979. Antarctic gains of about 700,000 square kilometers are enough to result in a global loss of around 1.3 million square kilometers over the period. That’s equal to about 35,000 square kilometers lost each year or an area the size of the State of Maryland.

Finally, it’s important to note that recent studies have shown (as hinted at above) that sea ice gain around Antarctica is being driven by cold water and ice berg outflows ramping up as the great glaciers of Antarctica increase their melt rates. The melt, which is driven by a pool of warm water expanding hundreds of feet beneath the ocean surface and at the base of ice sheets and ice shelves is creating a kind of heat conveyor which spreads cool water along the surface even as it pulls more warm water in from underneath.

So it appears even the slight ice gain for Antarctica has a connection to human caused warming. One that is even more ominously linked to an exponentially ramping rate of land ice loss from Antarctica itself.

Links:

NSIDC

NASA: Global Sea Ice Diminishing, Despite Antarctic Gains

Earth Nullschool

Global Forecast Systems Model

Expanding Arctic Sea Ice is Flooding Warning Bell

Cryosat Shows Rate of Antarctic Land Ice Loss Doubled During Last Decade

Hat Tips:

The Arctic Sea Ice Blog

Anna

Dnem

Dangerously Beyond 350: CO2 to Remain Above 400 PPM For Most of 2015

For 2015, CO2 levels will remain above the dangerous 400 parts per million level for almost 2/3 of the year. A perilous new record for a human-warmed world.

The last time global CO2 levels averaged above 400 parts per million was more than 3 million years ago during the Pliocene. A period that was just beginning to see the dawn of humankind (Australopithecus emerged about 2.5 million years ago). It was a world of 25-75 foot higher seas. A world where much of Greenland and West Antarctica was ice free. A world that took hundreds of thousands of years to settle into its climate patterns.

2014 Begins at 400 ppm +

(A bad start of 2015 — CO2 levels on January 1st exceeded 400 PPM. Most of the year will see levels in excess of this dangerously high atmospheric value. Image source: The Keeling Curve.)

But the current human tool-using species that is now warming the Earth so drastically would have to wait for about 2.8 million more years and for far cooler climes to develop. And that species would set conditions for a rapid shift to climate states not seen for 3 million years in just decades through a hellish pace of fossil fuel burning.  For in just one century we’ve propelled ourselves back to that deep time. Back to a world climate state that is entirely alien to what we, and so many other animals, are accustomed to.

For this year, human fossil fuel emissions will push 2015 to reach or exceed those 400 ppm levels for around 7-8 months running. By 2016, it’s possible that 300 part per million levels — the ones that dominated our environment for most of the 20th Century — will be little more than a melancholy memory as humans face off against a series of increasingly dangerous  geophysical changes.

All set off by the inexorable burning of fossil fuels. A malpractice that simply must stop.

An All Too Steep Ramp-up Toward The Hothouse

Current human fossil fuel burning coupled with a few, still somewhat contained, environmental carbon feedbacks are enough to push an annual atmospheric CO2 increase of 2.2 parts per million each year. It’s a pace of initial greenhouse gas heat forcing never before seen in all of Earth’s geological past — even during the greatest global hothouse extinction events. The fruits of dumping 36 billion tons of CO2 into the atmosphere each and every year.

petm_vs_modern_emissions

(Rate of carbon emission at more than 30 billion tons of CO2 each year vs the PETM [Note that WeatherUnderground has erroneously labeled CO2 as Carbon in the graph]– which was the most recent hothouse extinction 55 million years ago. It’s enough to push an atmospheric temperature rise on the scale of a mass extinction over the course of decades rather than millenia. It’s also worth noting that with CO2 emissions at 36 gigatons in 2013 [vs the above graph results from 2010] and CO2e emissions just shy of 50 gigatons this trajectory is even steeper than the graph depicts. Image source: WeatherUnderground.)

As a result, if current rates of burning continue or increase, we will see 450 parts per million levels well exceeded within about two decades. And that threshold will undeniably lock in at least 2 C worth of warming together with a growing carbon feedback from the Earth System itself.

484 PPM CO2e For 2015

But this drastic pace of atmospheric greenhouse gas additions doesn’t tell the whole story. For if you add up all the other gasses humans have dumped into the atmosphere, all the methane and HCFs, all the industrial chemicals, you end up with a CO2 equivalent number (CO2e) far greater than the present CO2 measure. And that CO2e measure is set to hit 484 parts per million this year (With a nearly 50 gigaton annual increase in CO2e gasses each year). A level that, if it correlates with past climates, will push warming by 1.9 C this century and 3.8 C after the entire Earth System responds. A level not seen in at least 13 million years.

A rather terrible situation to say the least. For at these levels, even the great ice sheets of Antarctica proper were much reduced and sea levels were 85-120 feet higher than they are today. And continuing to burn begs the very worst hothouse extinction consequences that come from wrecking the world’s oceans.

Very Hard Work to Get Back to 350 PPM

Near the end of the first decade of the 21st Century Dr. James Hansen, former head of GISS at NASA advised the world community that the likely safe level of global CO2 was below 350 parts per million. This assertion flew in the face of some in the international community who were pushing for an established ‘safe’ level of 450 parts per million and below. A level, of course, which would allow for the burning of quite a bit more of the world’s fossil fuel reserves.

But Hansen wouldn’t compromise. He felt it would be a betrayal to future generations. To his grandchildren. To all our grandchildren. So he set the safe limit at 350 parts per million with the caveat that we may need to reduce it further.

In 2008, during the year Hansen set the 350 parts per million level, CO2 levels peaked at around 386 parts per million. For 2015, just 7 years later, levels will peak at around 404 parts per million. A rampant increase directly in the wrong direction.

In order for rates of CO2 increase to begin to taper off, the world simply must stop burning so much in the way of fossil fuels. And even a full cessation of fossil fuel use would still result in some emissions unless both farming and construction were altered to reduce carbon emissions. Beyond this, atmospheric carbon capture through various methods to include fixing carbon capture and storage facilities to biomass generation and other land use and chemical based techniques are the most likely to be effective.

Such a transition and change is as difficult as it is necessary. For the world as we know it simply cannot continue along its current path. Hansen was right and we should have listened 7 years ago. We should have listened in 1988 at his first major climate hearing. But we didn’t. And so valuable time was wasted.

Let’s not make the same mistake in 2015.

Links:

The Keeling Curve

2015 Begins With CO2 Above the 400 PPM Mark

WeatherUnderground

2013 CO2 Emissions Will Set Record High

A Faustian Bargain on the Short Road to Hell: Living in a World at 480 PPM CO2e

Scientific Hat Tip to Dr. James Hansen and Dr. Ralph Keeling

Antarctic Heat Heralds Hottest September in the NASA Record

September 2014 Hottest on Record

(Global temperature anomaly map for September of 2014. Note extraordinary bands of very strong positive temperature anomaly ranging the globe with hottest zones at or near the poles. Image source: NASA GISS.)

Another hottest month on record for the global climate. And this one is a bit of a doozey.

According to NASA GISS, September of 2014 saw global surface temperatures that were 0.77 C hotter than the 20th Century average. This record beats out 2005 by a rather strong 0.04 C margin and represents the 3rd month in the GISS record for 2014 that was either the hottest or tied for the hottest (May, August and September).

Ocean surface heat and anomalous warmth at the poles were deciding factors for the new September record with very few regions of the global ocean surface showing cooler than average temps and with extraordinary heat at the poles, especially in Antarctica. This southern polar zone experienced average monthly temperatures as much as 8.7 above the global average across a relatively broad zone. Both East and West Antarctica observed this very strong polar amplification with East Antarctica experiencing the peak anomalies.

zonal anomalies map september 2014

(Zonal anomalies by Latitude in the NASA GISS measure. Image source: NASA GISS.)

The zonal anomalies map for September of 2014 showed no latitudinal zone experiencing cooler than 20th Century average conditions. A rather extraordinary feature considering most months show cooler than 20th Century average conditions along at least some latitudes.

Most extreme heating occurred at or near the poles with the 75-80 degree South Latitude zone showing an extraordinary +3.4 C departure from the global norm and the 80-90 degree North Latitude zone showing a strong +1.75 degree positive anomaly.

The only zone showing near 20th Century average temperatures was the heat sink region of 55 to 60 degrees South Latitude in the Southern Ocean. In this climate region a strong storm track combines with an expanding fresh water wedge issuing from melting Antarctic glaciers to force down-welling and atmosphere to ocean heat capture. A heat capture that was alluded to in a recent scientific paper which found the upper Southern Ocean contained between 24 and 55 percent more heat than expected.

This heat sink region, featuring an expanding fresh water wedge has been instrumental in somewhat higher than normal Antarctic sea ice totals. An impact that is, ironically, driven both by Antarctic continental ice melt together with an increasing storminess in the Southern Ocean and waters more heavily laden with salt issuing from the equatorial zone. A highly unstable confluence that results in local surface cooling as the ocean takes a heavy dose from the human riled heat engine.

Conditions in Context

No El Nino yet, despite two warm Kelvin waves and somewhat favorable atmospheric conditions throughout the months of August and September. But sea surface temperature in the Equatorial Pacific region remain somewhat hotter than normal — bending toward the warm side of ENSO neutral. Overall ocean surface warmth, however, was extraordinary throughout September, pushing well above the global average and ranging, in GFS models, from 0.7 C to 1.2 C above the already hotter than normal 1979 to 2000 average.

Overall, three more record or near record hot months would put 2014 in serious contention for hottest year on record (2014 is running 0.65 C hotter than average, the global record is 0.67 C above average for 2010). A rather odd result considering we still see no El Nino and almost every recent hottest year has been spurred on by this powerful atmospheric variability driver. A record hot year in 2014 with no El Nino could well be an indication that the human forcing is beginning to over-ride natural variability and that the ENSO signal, though still very powerful, is becoming more and more muted by an increasingly substantial human heat forcing.

Links:

NASA GISS

It’s Worse Than We Thought — New Study Finds that Earth is Warming Far Faster Than Expected

You Know There’s Something Wrong When Vast Expanses of Greenland Look Like A Blackened Volcanic Crater

Lowest albedo on record for Greenland.

That’s what data provided by NASA and processed by polar scientist Jason Box are showing for August of 2014.

But it doesn’t take a polar scientist to tell you something is dreadfully wrong with this:

(Swaths of Greenland’s Ice Sheet look more like a volcanic crater than mountains of frozen water. Video source: Dark Snow.)

The above video, provided by the Dark Snow Project and featured on Peter Sinclair’s fantastic Climate Crocks blog, shows a vast swath of the Greenland Ice Sheet from helicopter. Miles and miles of previously pristine ice now show a blackening similar in color to volcanic basalt. A color vastly uncharacteristic of Greenland and more suited to melting and salted snow in an urban parking lot.

Melt is a primary driver of such widespread blackening of the Greenland Ice Sheet. Compaction and removal of snow through melting of the surface layer uncovers dirt, dust and soot left over through the years and millennia, depositing it in a dense layer just beneath the newly melted and washed away snow.

Snow and ice darkening is also compounded by vastly expanding Arctic wildfires. And this year featured the most severe outbreak of wildfires on record for the Northwest Territory of Canada together with extreme and explosive fires throughout Arctic Siberia.The dark soot ejected in immense plumes from these fires is borne aloft by the winds, eventually falling together with rain and snow over the Greenland Ice Sheet.

Lastly, manmade sources of black and brown carbon are also implicated in the great ice sheet’s blackening. And, during recent years, with the explosion of dark particulate sources in developing countries and through global slash and burn agriculture, more and more dark particulate from human activities is finding its way to the great ice sheet.

The net effected is Greenland ice sheet albedo dropping like a rock.

Greenland Ice Sheet Albedo Loss

(Falling like a rock. Greenland Ice Sheet albedo hits record low for August of 2014. Data source: NASA MOD10A1. Data Processed by: Dr. Jason Box.)

Albedo is a measure of reflectivity. The less reflective an ice sheet is, the more vulnerable it is to melting through direct heating by solar radiation. The ice sheet surface absorbs more energy from the sun’s rays as reflectivity falls and this process, in turn, further hastens a melt that is already being amplified by human-caused atmospheric and ocean heating.

But charts and graphs do little justice to this ongoing tragedy. In looking at vast stretches of ice, now colored an ominous grey-black, blanketing Greenland, it becomes all-too-easy to realize that we are likely witnessing the start of the Great Ice Sheet’s demise.

Links:

Dark Snow Project

Dark Snow

Climate Crocks

NASA MOD10A1

Dr. Jason Box

2014 To Be Hottest Year on Record? Arctic Ocean, West Antarctic Heat Spikes Amidst Scorching End to September

Strange and anomalous heating of the Earth’s surface waters. That’s what could best characterize the year of 2014. Waters warm enough to break world records and all arrayed in extraordinarily odd distributions.

***

The Summer of 2014 (June through August) was the hottest in the 135 year global temperature record and likely the hottest in at least 100,000 years. According to the National Climate Data Center, global temperatures were 0.88 degrees Celsius above the 1880 average and 0.71 degrees Celsius above average temperatures for the 20th Century.

Summer of 2014 temperatures slightly edged out previous heat records set in 1998 by 0.01 degrees Celsius. But 1998 was a year during which a raging El Nino was dumping immense volumes of Pacific Ocean heat into the atmosphere. This year, summer conditions displayed Pacific Ocean warmth in the Nino regions — but nowhere near enough heat anomaly to shove the equatorial region into El Nino status. So a luke-warm equatorial Pacific and possible pre El Nino in 2014 when combined with a raging human heat forcing of the atmosphere is enough to beat out the super El Nino of 1998 for record hottest summer, even if only by a hair.

Global land and ocean temperature anomalies summer 2014

(Summer of 2014 beats out 1998 as hottest on record amidst steady and ongoing rise in global atmospheric temperatures. Image source: NOAA’s National Climate Data Center.)

The hottest summer on record follows the hottest May on record and could well include the hottest September on record. This is a strong trend that may well be building 2014 into the hottest year on record. And all without a pronounced El Nino so far.

For if the final four months of this year all fall within the range of first to fifth hottest, 2014 will be a record breaker.

A Very Hot End to a Hot September

Preliminary GFS measures show that September of 2014 may well be in record-challenging range with global temperatures averaging between +0.4 C to +0.7 C above the already hotter than normal 1979 to 2000 period. It was a period that featured ramping polar heat amplification in both the Arctic and Antarctic. A period that followed summer of 2014 trends showing extreme high temperature departures in the Northern Pacific and even higher sea surface temperature departures in the Arctic Ocean regions near the Bering Strait.

The last day of September closed near the top of this hot temperature range with the global atmospheric anomaly at +0.69 C above the 1979 to 2000 average (which is about 0.3 to 0.4 C above the 20th Century average respectively).

September 30 temperature anomaly

(September 30 global temperature anomaly map. Image source: University of Maine.)

Analyzing the map above, we note strong polar amplification already advancing in the Arctic region with a +1.15 C positive anomaly. We would well expect this trend to continue through fall and winter due to a combination of factors including — the amplified impact of overburden greenhouse gasses during periods of seasonal darkness, a very strong observed heating of the sea surface in Arctic regions providing latent heat through the colder months, and pronounced atmospheric heat transport through ridiculously resilient ridging patterns over the northeastern Pacific and Scandinavia.

In the Southern Hemisphere, we’ve also observed an extraordinary polar heat spike ongoing over the region of West Antarctica in association with an anomalous atmospheric ridge feature in that region as well. West Antarctic temperature departures hit well above +20 C over recent days. This excessive warm anomaly was enough to drive the entire Antarctic zone to an extreme +3.09 C above that polar region’s average for this time of year. Though it is still early spring for the Antarctic, persistence of the West Antarctic ridge could have serious impacts come summer time. So the feature will bear watching.

Extreme temperature anomaly over West Antarctica

(Extreme positive temperature anomaly over West and Central Antarctica on September 30, 2014. Note the broad area of +20 C positive departure. Image source: University of Maine.)

Troubling Arctic Ocean Heat Spike

But perhaps the most troubling feature for September and, indeed, all of the summer of 2014 is a massive accumulation of far warmer than average surface ocean water in both the Northern Pacific and in the Arctic Ocean.

The Northern Pacific heat has occurred in conjunction with an anomalous 21 month long blocking pattern that has tended to fix in place a south to north flow pattern and far warmer than average land and ocean temperatures for the region. Sea surface temperatures in the range of 2-3 C above average for a swath from California to Alaska have remained in place for nearly two years running.

This feature and now prevailing associated south to north wind pattern appears to be driving warmer than normal waters through the Bering Strait and into the already vulnerable Arctic zone. There, the added warm water appears to have combined with the warming of a deeper, but sometimes surface influencing, warm water flow newly emerging from the Atlantic. These combined warm water flows have resulted in a broad swath of 4 C + above 1979 to 2000 average surface water temperatures ranging from the Bering Sea into the Chukchi, Beaufort, East Siberian, Laptev and Kara Seas of the Arctic Ocean.

Sea surface temperature anomaly global September 30

(Extreme global sea surface temperature anomaly of September 30, 2014 features extraordinary +4 C positive temperature departures in the Northern Polar Ocean. Image source: University of Maine.)

During recent years featuring very low Arctic sea ice measures, August, September and October have displayed very strong positive sea surface temperature anomalies in the Arctic. These extraordinary sea surface temperature values have tended to push global temperature averages higher with a number of global heat records set despite the presence of La Nina or ENSO neutral conditions in the Pacific. A clear instance where human-driven polar heat amplification and heating of the northern polar ocean is beginning to have a measurable and substantial impact on global temperature variation as well as overall rate of warming.

In general, we find much of the global ocean heat spike clustered near the northern polar zone. This is clearly visible in the anomaly color display on the map above together with the +0.27 C of added heat in the Northern Hemisphere surface ocean vs the Southern Hemisphere Ocean measure.

A final feature of this enhanced Arctic warming — increased instances of microbial blooms in northern ocean surface waters — was plainly visible in the MODIS shot during late September as well. In this case a massive bloom covering a 550 by 100 mile swath of the Bering Sea just south of the Bering Strait:

Microbial bloom Bering Sea September 28

(Massive Bering Sea microbial bloom as visible in the LANCE-MODIS satellite shot on September 28 of 2014. For reference, the Bering Strait is to the right of frame. Bottom edge of frame is about 500 miles. Image source: LANCE-MODIS.)

In these instances, concurrent with human-caused warming, large regions of newly ice free water contain higher nutrient content than more southerly waters. As the human heat forcing spurs these waters to above average temperatures, ocean microbial activity becomes more prolific — since larger numbers of microbes thrive in warmer conditions. The result has been the appearance of very large blooms in far northern waters during recent years.

Within Striking Distance of a Record Hot Year — Serious Implications For Weather and Climate

Despite a Pacific El Nino that appears to be set on slow to low burn, if the event appears at all, it appears possible that 2014 may be setting up for a record breaking year. The factors driving this event include a continued if very mild Pacific Equatorial warming together with far more troubling heat amplification driven by human greenhouse gas warming at the poles. The most troubling of these regions continues to be the Arctic. And the added heat there will almost certainly increase stress on vulnerable carbon stores as well as potentially add to the human-spurred havoc now playing out in northern hemisphere and global weather systems.

The disposition of early fall atmospheric heating with high ocean heat content near the northern polar zone certainly leaves wide the door to future polar vortex disruption come winter 2014-2015 together with providing a Jet Stream weakness that continues to facilitate Northeastern Pacific Ocean ridge development. And, in the case of the Northeastern Pacific especially, there are few challenges to that very disruptive and damaging pattern on the near term horizon (30 day).

Links:

NOAA’s National Climate Data Center

University of Maine

LANCE-MODIS

Human Hothouse Found to be California Drought Culprit as Ridiculously Resilient Ridge Reasserts

This is an event that is more extreme than any in the observed record, and our research suggests that global warming is playing a role right now. — Stanford Scientist Noah Diffenbaugh

****

Last week, a strong storm over-rode a powerful high pressure ridge that has been deflecting moisture-loaded weather systems northward and away from the US West Coast for the better part of two years. Though some precipitation did grace the northern and mountain stretches of the drought-stricken state of California, it is no-where near enough to alleviate an epic 21+ month long drought. A drought borne of a blocking pattern that began during the winter of 2012-2013 and now threatens to extend to the end of 2014 and, possibly, beyond.

In the wake of the storm, the powerful ridge reasserted — again delaying hopes that a parched California would at last begin to receive at least a normal allotment of rain.

Blocking Ridge Oct 6, 2014

(Euro Model forecast shows the ridiculously resilient ridge [RRR] strongly in place off the US and Pacific Northwest coasts in the October 6 run. Image source: ECMWF.)

It is a high pressure ridge based blocking pattern that has become so persistent that researchers at Stanford University have given it a new name — the ridiculously resilient ridge or Triple R. And the Triple R, according to those same researchers has climate change based origins.

For this week, Stanford scientists published a new study that found:

The atmospheric conditions associated with the unprecedented drought currently afflicting California are “very likely” linked to human-caused climate change.

Researchers used a combination of climate models and statistical techniques to determine that large, persistent high pressure systems of the kind that have been locking California into perpetual drought are more likely in the presence of high concentrations of greenhouse gasses. They found that the ridge, which has generated year-round wildfires in California and at its peak intensity during January of 2014 stretched from Hawaii all the way to coast of the Arctic Ocean north of Alaska, was a kind of new species of extreme weather far more likely to occur in a human-warmed world.

south-to-north-weather-pattern-alaska

(January 23 of 2014 weather pattern showing a moisture flow diverted from Hawaii to Alaska by the Triple R west coast blocking pattern. Image source: NASA.)

The anomalous strength of the ridge also likely played a role in the powerful polar vortex disruptions that were commonplace throughout the winter of 2014. As the ridge shoved more warm air into the polar zone north of Alaska the cold core of the polar vortex was displaced south and eastward over the Canadian Archipelago and Hudson Bay — driving extreme weather events over the central and eastern US as well as across the Atlantic and on to the UK.

The Researchers found that ridging was the overall and anomalous tendency of the pattern in this region of the northeast Pacific. They observed that the ridge remained strong throughout the winter of 2013, weakened during the summer of that year, then flared into an extreme intensity by January of 2014. Since that time, the ridge has swelled and spluttered, occasionally letting a storm or two pass but still serving as a kind of brutal sentinel to weather systems that would typically make their way to California.

The results of such a human-caused disruption of the climate are all too visible in the most recent US Drought Monitor.

September 23 drought monitor

(Despite tropical storms and the occasional weakness in the Triple R allowing a brief influx of moisture, 100% of California is still suffering from drought conditions with 58% percent of the state under the most extreme level of drought. Image source: US Drought Monitor)

A drought event that is the most extreme in the observed record and that is now linked to climate change by at least three major studies.

From the Stanford Study’s authors:

“We’ve demonstrated with high statistical confidence that the large-scale atmospheric conditions, similar to those associated with the Triple R, are far more likely to occur now than in the climate before we emitted large amounts of greenhouse gases,” Rajaratnam said.

“In using these advanced statistical techniques to combine climate observations with model simulations, we’ve been able to better understand the ongoing drought in California,” Diffenbaugh added. “This isn’t a projection of 100 years in the future. This is an event that is more extreme than any in the observed record, and our research suggests that global warming is playing a role right now.”

Links:

Stanford Scientists: Causes of California Drought Linked to Climate Change

ECMWF

NASA

US Drought Monitor

Heat, Wind Ahead of Pacific Storm Spikes King Fire Hazard; Potential Blocking Pattern Shift Underway

King Fire Sep 23

(King Fire Complex fanned by strong, hot southwesterly flow on September 23, 2014 — a rising fire danger through Thursday in advance of an approaching Pacific storm system. Image source: LANCE-MODIS.)

A powerful storm system off the US and Canadian Northwest Coasts may deliver much-needed rains to central and northern California by Thursday — but not before pulling warm, dry winds up from the south in advance of the storm’s approach. The heat and winds, expected to reach 15-25 mph later today, will heighten danger for the over 7,400 firefighters already battling the 90,000 acre King Fire.

As of earlier today, the fire was 35% contained after the army of firefighters, aided by a spate of mountain drizzle, tirelessly worked through the weekend to staunch the blaze. But the new in-rush of hot, dry winds today and tomorrow will fan the still energetic wildfire, increasing the threat to more than 21,000 structures ringing the fire’s edge.

Already, ten people have suffered injuries and 32 structures were destroyed even as 2,700 people are currently evacuated from areas most vulnerable to the still-raging fire. Given the influx of more dangerous conditions, fire fighting personnel will be hard pressed to prevent further damage from an already costly and harmful blaze.

Strong Storm Approaches the Western US

(Strong storm approaches the Western US as the ridge and associated blocking high shift eastward. Change in year and half long blocking pattern? Image source: NOAA-GOES.)

Fire Amidst Record Drought

The King Fire erupted in Central and Eastern California during mid September as century scale drought conditions continued to scorch the state. As of today, more than 50% of the state remains under the most extreme drought level with 100 percent of California suffering from some degree of drought.

This past weekend’s light rains did little to help. However, a strengthening storm track in the Pacific is likely to deliver at least some moisture to Northern and Central California by Thursday. A blocking high pressure ridge that has persisted off the US West Coast for more than a year and a half has also shifted — moving inland toward the Central and Western US. This shift appears to be slowly opening the door to some moisture for California.

Blocking Pattern Shift

(University of Maine Jet Stream modeling shows an eastward shift in the year and a half long blocking pattern and associated ridge over Western North America and the Northeastern Pacific. In today’s graphic, the ridge has shifted into the Central US with associated Rossby-Wave type troughs over both the Eastern US and Eastern Pacific. Notably both troughs now host powerful storm systems in the range of 975 mb and lower. Image source: University of Maine.)

An atmospheric pattern more favorable for El Nino development may also be favoring increased precipitation for California. However, it is still too early to determine whether a pattern favoring drought reduction is firmly in place.

Conditions in Context

Under the current rapid and powerfully enhancing regime of human-caused heating of the Earth’s oceans, ice, and atmosphere, we can expect the US West and Southwest to continue to dry as the storm track shifts northward and as rising temperatures bake more and more of the moisture out of the soil. A significant increase in the occurrence of drought in the US Southwest since the 1970s is likely a part of this larger trend, one that will almost certainly worsen as human-caused climate change intensifies.

In addition, an increasing eccentricity in the Jet Stream associated with Northern Hemisphere polar heat amplification has resulted in far more persistent weather patterns. Dome scientific studies have found that these patterns, associated with powerful Rossby-type wave patterns in the Jet Stream, have appeared with increasing frequency since the mid 2000s. As a result, cooler stormier patterns tend to persist in one region while dry, hot conditions have tended to persist in other regions. This new climate regime appears to be enhancing an already amplified drought pattern for the US West even as it has pumped up storm patterns for regions east and north. It is also worth noting that a number of studies have also found a link between major sea ice losses in the Arctic since 2007 and the intensity of the current California drought.

Links:

LANCE-MODIS

NOAA-GOES

University of Maine

King Fire Update: 2,000 Firefighters add Manpower to those Battling Massive Blaze

Leaked UN Report Shows Failure to Swiftly Act on Climate Change Results in Catastrophic Harm

Over the past week, various sources have leaked information passed on to them by the UN’s Intergovernmental Panel on Climate Change (IPCC). The reports highlighted stark consequences for continued failure by policy makers to act, providing a general view of rapidly approaching a terrible and very difficult to navigate global crisis.

Dancing on the Edge of a Global Food Crisis

The first weak link for human resiliency to climate change may well be in our ability to continue to supply food to over 7 billion people as weather and sea level rise takes down previously productive agricultural regions. And the leaked UN report hints at a currently stark global food situation in the face of a risk for rising crisis.

For the Mekong Delta, as with more and more agricultural regions around the world, by August of 2014, global warming was already a rampant crop killer.

The Vietnamese government this year made efforts to stem the effects of warming-driven sea level rise and saltwater invasion as 700,000 hectares of rice paddy farmland in one of the world’s most productive regions came under threat. But the efforts have not entirely prevented intrusion and many plants show the tell-tale yellowed leaves that result from salt water leeching into the low-lying freshwater fields that have, for so long, yielded a bounty of grain. Many farmers are now facing losses of up to 50% for crops that used to produce like clockwork year-in, year out. This year, the salt water has intruded as far as 40 to 50 kilometers inland, delivering a substantial blow to the region’s agriculture. But the potential effects, given even the IPCC’s conservative projections of sea level rise in the range of 29 to 82 more centimeters this century, are stark for this and other low-lying agricultural regions.

FAO index August 2014

(UN FAO food price index since 1961. Note the spike since the mid 2000s coinciding with energy price increases and ramping crop destruction due to climate change. The first price spike during 2008 was primarily energy price related, but the second spike during 2011 coincided with a string of some of the worst spates of crop-destroying weather on record. Note that prices remained historically high following the 2011 spike, an indication that global agriculture was having difficulty meeting increased demand, despite the price signal. Image source: FAO.)

Around the world, tales from agricultural zones are much the same — ever-increasing challenges due to climate change driven droughts, floods, fires, spreading diseases, invasive species, and sea level rise. Since mid 2010, these added stresses have driven the United Nation’s FAO food price index — an indicator for global food security — above 200 for four years running. Historically, international insecurity and food-related unrest have sparked when prices hit and maintain above 208. And though the price of food has fallen somewhat from highs nearing 230 during 2011 to a range near 204 during 2014, the ongoing and worsening impacts of climate change mean that new and starker challenges to feeding the world’s 7 billion and growing population are just over the horizon.

Instances of food riots correlated with food price

(Instances of food riots from 2004 to late 2012 correlated with global food prices. Image source: ABC.)

These climate change related impacts are ongoing and, according to recent scientific reports, have resulted in a 3-5 percent loss of annual grain production for maize and wheat and could result in 10 percent total losses in grain production through the early 2020s. But even if agricultural difficulties are somehow delayed through the next decade, the UN report shows climate change eventually winning out by compounding damages that cause:

“slow down [of] economic growth, make poverty reduction more difficult, further erode food security, and prolong existing poverty traps and create new ones, the latter particularly in urban areas and emerging hot spots of hunger.”

Wide-ranging and Terrible Impacts

Of course, damages from climate change aren’t just limited to crops. More extreme weather, vicious heatwaves, rising seas, ocean acidification and anoxia, loss of glacial and ocean ice, rampant wildfires and other jarring impacts are likely to coincide as warming continues to spike higher.

At 0.85 degrees Celsius and 1.5 degrees Fahrenheit warming since 1880, we already see some rather radical impacts. But, according to IPCC, these impacts are likely to seem paltry if human business as usual emissions continue and hit the IPCC projected level of warming by 5.4 C or 9 F by the end of the 21st Century.

For illustration, IPCC provides the following impacts/risk graph:

IPCC Level of Risk

(Projected risk related to a given level of warming according to IPCC via Bloomberg.)

As a risk-related graph, the analytical function is notably vague. The graph defines risks to unique systems (primarily natural ecosystems or human systems such as agriculture and tourism related to those systems), risks associated with extreme weather (which is self-explanatory), risks associated with distribution of impacts (which generally defines how widespread climate impacts will become), risks associated with global aggregate impacts (this attempts to define the level of net positive or net negative impact, with some positive impacts resulting in an almost neutral net impact early on but overall and increasingly severe net negative aggregate impacts going forward), and risks associated with singular large-scale events (related to catastrophic weather or Earth changes such as glacial outburst floods, methane release, slope collapse and other unforeseen catastrophic, large-scale instances).

For +0.85 C warming above 1880s levels, we can add an imaginary line at +0.25 C above the 1986 to 2005 level. There we find current changes that are now visible and ongoing and that, to us, seem pretty substantial. Along that line, we see risks to some threatened systems from climate change (ramping damage to reefs, agriculture, rainforests etc), a moderate risk of extreme weather events outside the 20th Century norm (and we see these with increasing frequency), we are edging into increasing risks of disruption in some regions (as we’ve seen in Syria, the US Southwest and a shot-gun of other areas), we are edging into a zone where most people are starting to see impacts (though these are still comparatively minor for many, but increasingly bad for a growing minority), and we are at low but rising risk of catastrophic events (major glacial outburst floods, methane release, continent spanning megastorms etc).

And given this context, we can see how much worse things will be with just another 0.25, 0.75, or 1.5 C of warming. By the end of this century, under business as usual, we are at the top of the risk graph and would be witnessing events that many of us would now consider both strange and terrifying.

IPCC researchers add the following chilling and entirely apt caveat (Bloomberg):

“Many aspects of climate change and associated impacts will continue for centuries, even if anthropogenic emissions of greenhouse gases cease,” the researchers said. “The risk of abrupt and irreversible change increases as the magnitude of the warming increases.”

To this point, I would like to add that some changes are now irreversible, but the worst impacts are not, as yet, unavoidable.

The Terrifying Rate of Human Emission

IPCC now recognizes that human greenhouse gas emissions are at or near worst case levels. Current global volume of all human greenhouse gas emissions is now likely in excess of 50 gigatons of CO2 equivalent (CO2e) each year. As of the latest IPCC assessment, the emission stood at 49 gigatons CO2e for greenhouse gasses each year by 2010 (more than 13 gigatons carbon). This rate of emission, if continued and/or increased through the end of this century, is enough to trigger Permian Extinction event type conditions over the course of just three centuries or less (the Permian Extinction took tens of thousands of years to elapse) a shock that is unprecedented on geological time-scales.

Global Greenhouse Gas Emission Levels 1970 through 2010

(Global greenhouse gas emissions from 1970 through 2010. Included are human emissions from CO2 through fossil fuel burning, CO2 through land use, Methane emissions, N2O emissions, and fluoride gas emissions. Image source IPCC via Bloomberg.)

This immense volume of emission is probably more than 6-10 times faster than at any period of the geological record. Its vast and violent outburst is worse than any of the great flood basalts of Earth’s long history. And its pace of out-gassing will rapidly overwhelm any of Earth’s carbon sinks, likely turning many of these into sources. The human greenhouse gas emission is, therefore, likely on track to be the worst greenhouse gas disaster the Earth system has ever experienced.

Rapid Mitigation is the Only Moral Option

To this point, IPCC recommends rapid mitigation to prevent the worst possible consequences.

“Risks from mitigation can be substantial, but they do not involve the same possibility of severe, widespread, and irreversible impacts as risks from climate change, increasing the benefits from near-term mitigation action,” the authors wrote.

IPCC finds that the cost of mitigation is low so long as policies aim to rapidly reduce energy consumption, rapidly affix existing carbon emitting infrastructure with carbon capture and storage, leave new and unconventional fossil fuel sources in the ground while allowing existing sources to go into decline or be replaced outright by alternative energy, keep current nuclear capacity running until the end of its life expectancy, and provide all replacements and new additions for energy generation through various renewable energy sources (my personal opinion about the carbon capture policy position is that it creates moral hazard by giving the fossil fuel interests wiggle room, but that discussion is for another post).

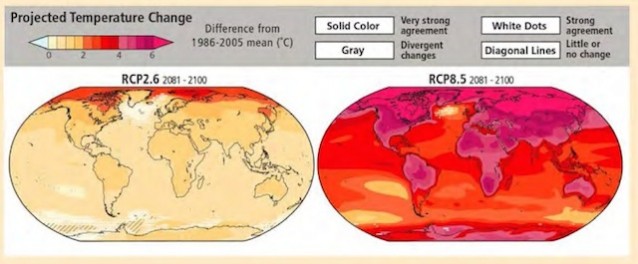
IPCC model runs show a stark difference between business as usual fossil fuel emission based warming and warming by end century under rapid mitigation:

Warming Scenarios Rapid Mitigation vs Businesss as Usual

(Approximate 1.9 C warming by 2100 under rapid mitigation vs 5.4 C warming under business as usual. Note that potential substantial Arctic and marine carbon store feedbacks are likely not fully taken into account and may require additional mitigation to alleviate. Source: IPCC via ThinkProgress.)

The approximate 3.5 C difference between the rapid mitigation scenario and the business as usual scenario is a glaring contrast between a world in which humans can cope with and reduce the long term impacts of difficult to deal with climate change and a world in which climate change essentially wrecks all future prospects. Between these two choices, there is only one moral and, indeed, sane option.

Overall, the most recent IPCC report is likely to receive broad criticism from climate change deniers for its more direct language. And this is probably a good sign that it is on the right track. In my view, however, the report is still cautious and leaves out a number of key risks, including significant amplifying feedbacks from Arctic carbon stores and other carbon stores, or simply deals with them by implication without further analysis (such as through the use of the term ‘large-scale singular events’ in the graph above). So, in some ways, the report hides actual risks behind obtuse language and dense scientific terminology.

Given the current behavior and mindset of policy-makers, an even more direct approach may well be necessary. That said, the current IPCC report, as alluded to by these leaks, appears to be a far more impactful summation than its previous iterations. Given the very narrow window in which we have to prevent the most severe future harm, such a shift is appreciated and highly appropriate.

Links:

Climate Scientists Spell Out Stark Danger and Immorality of Inaction in New Leaked Report

Climate Trends and Global Crop Production Since 1980

Irreversible Damage From Climate Change

UN Draft Report Lists Unchecked Emissions Risks 

Climate Change Impacts to Mekong Delta

Rising Sea Level Means Trouble For Vietnam’s Rice Farmers

FAO World Food Price Index

Hat Tip to TDGS