Time to Start Thinking about Deposing Fossil Fuel Kings and Establishing a Global Climate Emergency Protocol

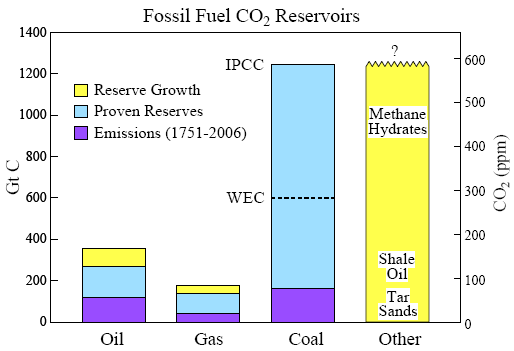
Gigatons Carbon in Fossil Fuel Reserves

(Gigatons of Carbon in various fossil fuel reserves vs amount of carbon already released into the atmosphere. Figure based on 2007 estimates. Wealth for fossil fuel companies, a terrible liability, or a vast threat to life on Earth? Image source: Atmospheric Chemistry, 2007.)

We live in a kind of sad age. An age of constraint by a kind of ideology that seems to believe there’s something wrong with the highest levels of human cooperation. Perhaps, we are justifiably suspicious, as the long history of humankind is filled with a broad wreckage of what could be termed the abuse of nations. But I think it’s fair to say we’ve gotten the calculus somewhat wrong and what we really should be suspicious of is the great accumulation of power by individuals without check or question and not the democratically elected public entities that form our representative government bodies.

For, in short, if the governments are warped, they are by a kind of endemic set of proxy powers, by bullies with big money bags, and by profit-seeking special interest groups. You know, the kind of corporate persons the conservative half of the US Supreme Court is so disturbingly cozy with these days.

If we were to take a classic example, we could look at Stalin. Here we have a man who, on the face of it, claimed to be dedicated to a benevolent equality. But he used that ideology to develop a kind of cult of personality in which he was made an absolute ruler. This was not the egalitarian ideal many envisioned and hoped for. It was, instead, simply a more intense form of the manipulation of political and idea-based systems for personal gain. In the case of Stalin, it resulted in a kind of kingship. A kingship where Stalin effectively twisted the ideals of the day into a kind of justification for his own elevation to the status of a Randian hyper-individual and the development of a kind of monopoly corporate superstate that was mother Russia.

In the case of Soviet Communism, the ideals served the man rather than the man serving the ideal. It is an ugly pattern we see on the large and small scale time and time again throughout human history. And, from a systems sustainability perspective, this is a huge problem. In particular, the problem arises when individualism all too readily teeters into an irresponsible narcissism that generates personal gain through the infliction of harm.

Modern Oligarchies, Dictators and Kings

In the current age, we suffer no less from our dictators. In the west, we have our oligarchs — the Koch Brothers, Rupert Murdoch, various fossil fuel company CEOs and boards of directors along with a long list of narcissistic and destructive billionaires — whose endless search for ever-increasing personal power causes vast social upheaval and environmental destruction. Around the world, we can see a similar array of destructively self-interested characters from the leaders of increasingly rogue globalized corporations to various dictators who have finagled autocratic or dictatorial rule over entire nations.

Factory Billows Carcinogenic Smoke

(An image all-too familiar in our age: massive aerosol, toxin, and CO2e smokestack emission.)

In essence, it boils down to the old problem of kings the American and French revolutionaries were so passionate to expunge. The problem, now, is that the kings have different names and titles. They masquerade as things other than kings. But kings, in essence, they remain and their terms are often life-long investitures.

This is not to say that the good queen or king doesn’t pop up now and then. But the king that uses a phenomenal accumulation of wealth and power not in the service of his narrow personal interests, but in the pursuit of a broader good is a rare, rare kind of person. The kind of person who has already given up a share of their power to something other than themselves. Who understand that power is only worthwhile when it is not taken in service of the self, but of others. And today that definition could well be expanded to the service both of other, less fortunate humans, and of other life on this world.

The problem is that, all too often, waiting for these kinds of kings to emerge is a futile endeavor. Does the broader human population pin its hopes on the good king or queen? The one who will recognize problems and expend resources to solve them? Or does broader human population, having suffered a long series of insults and, now being pushed over the brink of environmental catastrophe, depose the bad kings and put in place cooperation-based laws and leadership that ensure a just progress and provide some hope of confronting what is, perhaps, the most enormous difficulty humans and life on this world has ever experienced?

What I am suggesting is a kind of democratic and legally justified overthrow of the greed-driven personal profit motive as it relates to the current and coming environmental harm. A setting in place of a new system of values that may (and this may is a very qualified may) save us from the catastrophe we can most certainly lay at the feet of our entirely irresponsible corporate and dictatorial kings…

The Climate Emergency Protocol — Legal Justification For Holding Fossil Fuel Companies, Corporate or National, as Liable for Large-Scale Harms Inflicted

At issue here is the niggling problem of combined profit motive, total global fossil fuel reserves, property rights and the strange notion that is limited liability.

For under Friedman we assume that the only moral value of a corporation is to pursue profit. In such a case, a corporation is morally justified in dumping poisons into rivers, oceans and atmospheres for the temporary benefit that is profit for share holders.

For in the understanding that is our current observation of proven, possible, and unproven fossil fuel reserves, and given that we’ve already dumped enough carbon into the atmosphere to set off catastrophic events, we know that the vast volume of these reserves if unleashed into the atmosphere would multiply our current catastrophe manifold. In such a case, most of these reserves need to remain in the ground if we are to have any hope of a livable climate.

For under property rights, we understand that these corporations and shareholders, who by their own twisted morality are bound to seek short-term individual profit by wrecking our climate, claim as legitimate their ownership and pursuit of the means of our destruction. In such a case, corporations claim moral rights to profit from a vast and ever-expanding harm that they inflict, unwittingly or cynically, upon themselves and the rest of us. Such a blatant twisting of morality is, possibly, without precedent in all of human history, especially when its end results are the impoverishment and extinction of individuals, groups, and entire species together with a kind of amplifying and wholesale global destruction.

And, finally, for understanding and assuming a limited liability, corporations deign that they have little or no responsibility to the broader national or global public, to creatures that are not human, or to the life systems of this planet for the broad and expanding harm inflicted upon them through the current and heinously vicious application of self-justified profit motive.

2-degrees-Climate-Action-Tracker_highres

(A 2013 graphic by Climate Action Tracker estimating action needed to keep ECS (fast feedback) warming below 2 C. The right side of the graph shows total annual CO2e emissions. Note that, according to this analysis, emissions need to fall to near zero by 2050 to have much hope of preventing a 2 C ECS warming. It is also worth noting that Michael Mann has provided a rational global climate model assessment showing that we will likely lock in 2 C ECS warming in the next couple of years and see that level of added heat by 2036.)

Here we identify the flimsy legal basis for continued destructive action. An institution that enables vast and expanding climate and environmental harm without any accountability. An institution whose subjective profit morality is vastly amoral in the broader context of human and overall life systems welfare. And since this institution has no true moral basis upon which these publics could view it as useful or just, it must be considered amoral overall and without any viable grounds for a continued assumption of legitimacy. And since these corporations have made little to no action to effectively combat the harms which they have set in place, instead actively seeking to erode and call doubt on the massive volume of scientific evidence pointing to amplifying harm, or in personally attacking the scientists themselves, they must be viewed as rogue entities operating under a state of self-declared anarchy and beholden to no motive other than their short-term profit seeking.

In this understanding, nations and communities of nations, therefore, would be entirely justified to act on behalf of their peoples and on behalf of the life-systems they, themselves, are obligated by inherent natural law to protect and to husband. In such an understanding, corporate assets may be declared forfeit and resources may be re-directed in pursuit of removing the harms generated and in preventing further harms over longer time-frames.

A Climate Emergency Protocol in Action

Based on this understanding of an illegitimate authority and rights by rogue profit-seeking entities engaging in acts of wholesale harm, a set of national and international frameworks may well be envisioned in the context of what is a rising global climate emergency.

Nations, recognizing their peril, may be forced to act in their own interest and in the interest of the various publics, both natural and human, to which they are morally obliged to protect. And in this recognition, nations would be provided with a legitimate authority to nationalize fossil fuel resources for the purpose of removing it from destructive and rapid exploitation through market driven profit motive, for enacting a rapid reduction in overall use and emissions, and in ultimately achieving a permanent sequestration.

Global-warming-2013-PIFL-meeting

(Marshall Islands battered by high tides, huge waves related to global sea level rise. Image source: Pacific Island Nation Conference on Climate Change.)

National action could unfold in a manner similar to which the United States nationalized assets for the conduct of World War II. Fossil fuel reserves would be declared national holdings, corporate apparatus would remain, for the most part, in tact. But the profit generating organs would be subsumed by the state and re-directed toward turning fossil fuel ventures into alternative energy and carbon capture and sequestration ventures. In this way, all profits from the sales of fossil fuels and, for a time, new energy would be aimed at a direct transition away from such a destructive set of resources. This structure would also allow for both the retention and retraining of skilled, hard-working individuals who, through no fault of their own, became engaged in the fossil fuel trade. Such a wealth of talent could, in this way, be shifted to direct problem solving.

In the end, once transition of fossil fuel companies was achieved, they could then again be released for public investment and ownership under more stringent rules of operation similar to that of public utility companies and with absolute bars against a return to fossil energy exploitation and atmospheric carbon release.

Nations already holding a wealth of fossil fuel resources as public assets could readily shift to a similar footing by redirecting profits into direct alternative energy investment and carbon sequestration. In such cases, however, these nations may require additional assistance from more diverse economies.

Importing nations would also be justified in adding a series of tariffs at the point of import that feed directly in to energy transition infrastructure deployment. Broad-based utility buy-in could be achieved by adding funds for distributed solar, wind, and other new renewable leasing programs in which utilities maintained ownership of generating assets but provided services for a reasonable price. Meanwhile, a market for various carbon sequestration services could be established and expanded.

For these reasons and others, nations would be well advised to form legal and financial pacts and treaties with other, similarly acting, nations so as to protect themselves from action by less responsible governments and by corporate entities seeking an unjust recourse for mitigating actions. Such a framework would also provide set rules by which overall global fossil fuel emissions would be reduced, provisions of aid and assistance would be distributed to speed the process, and by setting up a means to hold honest the various signatory powers. In addition, a large and powerful enough pact of nations could provide commercial leverage against bad-actor countries through financial and import-export sanctions while providing aid to those countries most in need of direct assistance for rapid transition away from fossil fuel use.

Samoa_Seals_Government_01

(The official government seal of Samoa, one of the many nations now facing an existential crisis due to human-caused climate change. It is worth noting that fully 1/3 of all residents in Samoa live within 10 feet of current sea level, that 5% of the island’s GDP is lost each year, currently, due to climate impacts, and that the island’s fresh water supply would be almost entirely disrupted by just a 3 foot rise in sea level. But Samoa’s mountainous interior provides it with some defense. Other island states are not so fortunate.)

A strong block of climate emergency protocol (CEP) nations could also set up structures by which new technology and practices could be exchanged more freely, creating a large and well funded incubator for solutions based research and action.

Since rapidly mitigating the current climate catastrophe is just one imperative of nations seeking to provide for the futures of their populaces, CEP nations would also work to standardize frameworks by which populations and consumption are rationally restrained. In such cases, a broad and multilateral re-invigoration of institutions supporting women’s reproductive liberty and health together with a broad and expanding access to all forms of birth control will be essential. Further incentive through national policy to provide tangible rewards for individuals who decide to have few or no children or for those in same-sex relations may also need to be put in place.

Controlling and reducing consumption may require a broad range of features that include both incentives and rationing when needed. To this point, meat-based agriculture may need to be greatly reduced to both rapidly bring down global methane emissions as well as reduce the total land burden of human agriculture, thus freeing more lands for forests and wetlands.

Lastly, CEP nations could join together to form new and more effective sustainability practices by improving sustainable farming, land use, cooperation with nature technologies and practices, establishing systems of kindness economics, and by husbanding and developing species sanctuaries and seed banks as the current climate catastrophe continues to push greater and greater numbers of life-forms toward extinction.

In this call, I join with a broad number of agencies and organizations already active in dealing with the current climate emergency and invite dissemination and improvement of the above, humbly submitted, proposal:

350.org

The Climate Emergency Institute

Climate Change Emergency Declaration

The Arctic Methane Emergency Group


Links:

Michael Mann, Our Terrifying Greenhouse Gas Overburden, and Heating the World by +2 C by 2036

Responding to Climate Change

Pacific Island Nation Conference on Climate Change

Atmospheric Chemistry, 2007


Monster El Nino Emerging From the Depths. Nose of Massive Kelvin Wave Breaks Surface in Eastern Pacific

Monster El Nino

(A monster Kelvin wave, possibly more powerful than the 1997-98 event, is now rushing toward the surface of the Eastern Pacific. Image source: NOAA/ESRL.)

We are observing an extraordinarily powerful Kelvin Wave, one that was likely intensified by factors related to human global warming, traveling across the Pacific. It appears to be an epic event in the making. One that may be hotter and stronger than even the record-shattering 1997-98 El Nino. What this means is that we may well be staring down the throat of a global warming riled monster.

*   *    *    *    *

Ever since the early 2000s very strong east to west trade winds have been blowing across the Pacific. By around 2010, the force of this wind pattern had risen to never before seen records. Over the years, these record winds piled very warm waters in a region of the world east of the Philippines and Australia. As the pool grew warmer, evaporation increased and salinity levels in the hot water pool spiked. Increasing salinity in the zone resulted in a down-welling current that transferred heat into the ocean’s depths.

By 2013, this hot water pool had grown into a vast abyss of heat. Cyclones forming over this zone experienced a kick in intensity as the typical upwelling force of their winds only dredged more hot water from the ocean deeps. It was a pattern that is contrary to typical tropical storm dynamics in which cooler waters drawn up by intense storms tend to limit their peak strength. Not so with mega-typhoon Haiyan, the strongest storm ever to strike land. The cyclonic wind pattern only dredged more heat from the extraordinarily deep hot water. And so the storm only grew stronger and stronger, knowing little in the way of limits before it barreled into an already storm-battered Philippines.

After Haiyan’s passage, the heat pool remained, only growing deeper and more intense, waiting for a change in the wind. And by January of 2014, that wind change was already well on its way.

In Deep, Hot Water

Like an enormous bag waiting to burst eastward, the hot water pool contained temperatures of 29-30 degrees C or hotter and sagged deep, extending up to 150 meters below the ocean surface. A vast stretch of explosive heat that had been held in check from an equatorial surge only by the strongest trade winds on record. But by January, those trade winds had faded. The east-west flow first weakened, then it fluttered, then it died, allowing the wind direction to reverse.

Strong Trade Winds Hot Ocean

(Did strong trade winds intensify the current Kelvin Wave by piling hot water into the Western Pacific? Top graph shows ocean heat content rise, bottom graph shows zonal wind strength of the trade winds through 2011. Note that IPO — Interdecadal Pacific Oscillation — divergence roughly correlates with trade wind intensity fluctuation. Image source: England Study.)

This trade wind reversal has, since January, been facilitated by a string of explosive low pressure systems that developed in the vicinity of the Western Pacific both south and north of the equator. Northern hemisphere storms circulate in a counter-clockwise fashion while southern hemisphere storms circulate clockwise. When the storms line up, they kick storm winds out along the equator, providing strong reversals to the trade winds and further shoving our hot, monster Kelvin Wave to the east.

And as the trade winds fell and reversed due to this sporadic assault of countervailing storms, the hot, deep pool of water surged eastwards. To those on the surface, the motion was invisible. And but for a series of floats spread throughout the Pacific, we would never know a monster thing was rushing along toward the east at a depth of about 150 meters below.

But the floats did their work and by late February it looked like a rather strong heat pulse was on its way across the Pacific Ocean. Risks began to dramatically increase that the heat would breach the surface of the Eastern Equatorial Pacific and set in place the globe-altering weather pattern called El Nino. In a world where human warming was already having serious impacts, the emergence of a new, potentially strong El Nino was not at all a welcome sign. For one, it meant new global high temperature records were likely to soon follow.

It also meant that world food security may well be about to receive yet one more staggering blow.

First Warnings

As the signal for a new El Nino began to appear in the models during late February, NOAA started to issue watches and predictions. Initial estimates were for a 52% chance of El Nino by late 2014.

These warnings caused a ripple of concern through the global food markets. Already reeling under the insults of a series of severe, climate change induced, droughts from Brazil and Argentina, to California and Texas, to the Middle East, to China, the world’s growers were hardly prepared for another series of anomalous weather events. Russia rolling into bread-basket Ukraine further set anxieties alight. But the threat of even a moderate El Nino and its associated droughts and extreme weather seemed to be a rising perfect storm for what was already a terrible year.

Growers in Southeast Asia chided forecasters in the West, with some cautioning that El Nino trackers do their best to quiet down so as not to induce a panic.

Southeast Asia often experiences an interruption of the annual monsoon in association with El Nino. So the region, which was already suffering from ground water shortages, lowering glacial outflows and sporadic periods of intense drought — all conditions related to growth, over-consumption and climate change — could ill afford yet one more strike against it.

Still, the strike appeared to be gathering heat and steam.

A Rising Monster Pushing the Tip of Its Nose up in the Eastern Pacific

As growers and states with marginal or bad food security grew more anxious, the hot water surge intensified. Researchers independent of NOAA began to issue estimates for a 60, 70 even 80% probability for the emergence of El Nino. Others, tracking what now appeared to be the hottest Kelvin wave ever seen, began to issue warnings that a monster event may well be on the way.

Deep Hot Water

(Most recent NOAA Kelvin Wave assessment. Top panel shows deep water high temperature anomalies telegraphing across the Pacific and pushing toward the surface. Large, deep pool of hot water providing energy to for the wave is visible in the bottom panel. Image source: NOAA.)

At issue were deep ocean temperature anomalies that were now rushing across the Pacific and beginning to rise toward the surface. The zone in late February that had indicated temperature anomalies in the range of +4-6 C was over an area of approximately 48 degrees of longitude. By March 19, the hot zone of 4-6 C above normal temperatures had expanded to cover about 62 degrees of longitude, and contained a hotter 5-6 C anomaly zone that was now larger than the 4-6 C zone from late February. The deep, hot water pool in the Western Pacific was now beginning to set up a kind of bridge in which it could transfer east, dump its heat into the atmosphere and disrupt global weather. Perhaps, somewhat more disturbing, it was linking to a deep pool of warmer water off the coast of South America (also see animation at the top of this post).

By comparison, the monster El Nino of 1997 featured a Kelvin Wave covering about the same area but whose high temperature anomalies only peaked out at about 4.5 C above average. So the current Kelvin wave is of approximately the same size but, based on current observations, appears to contain more heat.

The Kelvin wave had also begun to tilt up in the front with its ‘nose’ just starting to break the Pacific Ocean surface at between 120 and 100 West Longitude. This put the tip of the rising heat spike almost due south of Baja California and almost due west of the Peru and Ecuador border as of yesterday, March 23.

Monster El Nino Shows Nose

(Monster El Nino pokes the tip of its nose through Pacific surface waters between 120 W longitude and 100 W longitude along the equator. Image source: NOAA/ESRL.)

In the above ocean temperature anomaly measure for March 23, 2014, we can see a hot pool in the range of 1 to 2 C above average beginning to emerge between 120 and 100 West Longitude. It is a heat pulse that has eliminated all but the closest near-shore cool upwelling along the west coast of South America.

Should the rest of the Kelvin wave follow, spot temperature anomalies in this region will spike well above 4 C and possibly has high as 5-6 C. Such an event would be even stronger than the one seen in 1997-98, drive global temperatures about .05 to .2 C hotter than previous records in a single year, and set off a series of extreme weather that, when combined with the already severe conditions set in place by human-caused warming, may well be far in excess of those seen during past events.

Links:

NOAA/ESRL

England Study

Abnormally Hot, Deep Pacific Ocean Waters Explode Haiyan into Monster Storm

NOAA El Nino Monitoring

Climate Change Pushing World to the Brink of Food Crisis

The Monsters of Growth Shock Rise: Conflict in the Ukraine, Global Food Crisis, and Spending 500 Billion Dollars to Wreck the Climate

India Times Chides Western Meteorologists about El Nino Predictions

Unusually Intense El Nino May Lie Ahead, Scientists Say

Disquieting Facts About El Nino

Washington Post: A Super El Nino May be on the Way

US Atmospheric Scientists Predict Intense El Nino

Weather Centre: Could the Next Super El Nino Be Forming?

Arctic Sea Ice Breaking Up as Heat Anomaly Spikes to 4.21 Degrees Celsius Above Average

The Siberian Heat Wave that began last week continues apace today. Far warmer than normal southerly winds continue to blow over a large region of Siberia bringing with them near freezing and occasionally above freezing temperatures. The combined influence of this off-shore flow and, what is for the Arctic, late spring and early summer-like weather is having a profound effect on Arctic sea ice in the regions of the Kara, Laptev, and East Siberian Seas.

Last week, we reported that an early break-up of sea ice was ongoing in the Kara Sea. Now, with the warm, off-shore flow shifting west, this break-up zone has expanded well into the Laptev and East Siberian. Satellite observations indicate that a very large section of ice pack, stretching from Severnaya Zemlya past the New Siberian Islands and on into the East Siberian Sea has been shoved northward by the strong south-north wind flow. The result is large gaps, ranging from 50-100 miles in width, forming along the boundary of the land fast ice and spreading through a zone of high impact for about 2,000 kilometers through the Kara and Laptev Seas before extending along a less involved fault zone another 1,000 kilometers into the East Siberian Sea.

Moving from west to east around the Arctic Basin, below is a summary of the ongoing break-up. Please note that some sections of these images are obscured by cloud cover:

Kara Sea March 9 v2Kara Sea March 24

(Kara sea before large scale breakup on March 9 in the top frame and after large-scale break up on March 24 in the lower frame. Image source: Lance-Modis)

Above, we have a continuation of the Kara Sea ice breakup we reported last week. Note that the break-up now extends all the way through sections of the land-fast ice to shore. Motion of the floe is still mostly south to north with sections of open water here ranging from 5-30 kilometers in width.

Moving east, we find that the eastward drift of the off-shore wind pattern and associated warm air temperatures that are closer to May and June norms have had a dramatic impact on Laptev sea ice as well:

Laptev March 9

Laptev March 24

(Laptev sea ice on March 9 with some large polynas prior to large scale break-up and extending of polynas on March 24. Image source: Lance-Modis)

Here we find the section of large openings and polynas spreading east from Severnaya Zemlya through the Laptev and on past the New Siberian Islands. Ice crack sizes are quite large with gaps stretching between 30-50 kilometers in width. Sea ice toward the central pack shows much more extensive cracks (leads) and breakage.

Still further east, the warm southerly winds have also widened and extended large cracks running through the East Siberian Sea, the region of water covering the shallow and sensitive East Siberian Arctic Shelf zone:

East Siberian Sea March 9

East Siberian Sea March 24

(East Siberian Sea ice on March 9 in the top frame and March 24 in the bottom frame. Image source: Lance-Modis.)

The crack structure appears to have shifted north, extended and widened even as the ice system became more crack-riddled.

Siberian Heat Wave Continues

Temperatures in the region continue to range between 5 and 20 or more degrees Celsius (9 to 36 F) above average for this time of year. This abnormal ‘heat’ translates into average temperatures ranging from -14 to 0 C (8 to 32 Fahrenheit). It is worth noting that salt water freezes at around -2 C (28 F, depending on salinity). So average temperatures in this range are enough to retard refreeze after breakage, to keep sea ice more disassociated and brittle, and to result in some areas where sporadic melt occurs.

As spring continues, warmer water beneath the ice pack, waters warmed by solar insolation, ice warmed by solar insolation, and warm water outflows from the Continents may well become involved to enhance early season sea ice break up and melt.

Overall, the Arctic is now experiencing an extraordinarily high temperature anomaly of +4.21 above the 1979-2000 average or about 5.7 C above the 1880s average. These excessive above average temperatures are high enough to initiate early melt, fragility and break-up in some zones (as observed above).

T2_anom_satellite2

(Very large Asian heat plume. Image source: University of Maine.)

This particular heat wave is in association with a very large Asian system in which much warmer than average temperatures extend south to north from Northern China, Mongolia, through the Yakutia region of Russia and on up into the Kara, Laptev, East Siberian, and Beaufort Seas of the Arctic Ocean. It is also worth noting the rather impressive hot pool forming over the Balkan States of Eastern Europe and the Ukraine which is, perhaps, a pattern settling in with the potentially oncoming El Nino.

GFS model runs show the current Arctic pulse spiking to around +5 C above 1979 to 2000 averages over the next 48 hours and then slowly fading through March 31 as anomalies return to a range of about +2-3 C above average. Hot zones continue to linger over China, Mongolia, Siberia and Eastern Europe as a somewhat troubling heat pulse develops over a large swath of western Greenland before riding up over Svalbard potentially bringing 30-40 degree (F) temperatures to both Western Greenland and this Arctic island by late in the forecast period.

Links:

Lance-Modis

University of Maine

Arctic Ice Graphs


Far Worse than Being Beaten with a Hockey Stick: Michael Mann, Our Terrifying Greenhouse Gas Overburden and Heating the Earth by + 2 C by 2036

I’m going to say something that will probably seem completely outrageous. But I want you to think about it, because it’s true.

You, where-ever you are now, are living through the first stages of a disaster in which there is nowhere to run, nowhere to hide, and no safe place on Earth for you to go to avoid it. The disaster you are now living through is a greenhouse emergency and with each ounce of CO2, methane and other greenhouse gasses you, I, or the rest of us, pump into the air, that emergency grows in the vast potential of damage and harm that it will inflict over the coming years, decades and centuries. The emergency is now unavoidable and the only thing we can hope to do through rational action is to reduce the degree of harm both short and long term, to rapidly stop making the problem worse, and to put human ingenuity toward solving the problem rather than continuing to intensify it.

But damage, severe, deadly and terrifying is unleashed, in effect and already happening, with more on the way.

*    *    *    *    *

Manns-hockey-stick

(Michael Mann’s famous Hockey Stick graph showing Northern Hemisphere temperatures over the past 1,000 years. The influences of human warming become readily apparent from the late 19th to early 21rst centuries. But human greenhouse gas forcing has much greater degrees of warming in store.)

This week, Michael Mann wrote an excellent piece describing the immediacy of our current emergency in the Scientific American. In typical, just the facts, fashion, he laid out a series of truths relevant to the current greenhouse catastrophe. These facts were told in a plain manner and, yet, in a way that laid out the problem but didn’t even begin to open the book on what that problem meant in broader context.

Michael Mann is an amazing scientist who has his hand on the pulse of human-caused climate change. He is a kind of modern Galileo of climate science in that he has born the brunt of some of the most severe and asinine attacks for simply telling the truth and for revealing the nature of our world as it stands. But though Mann’s facts are both brutal and hard-hitting for those of us who constantly read the climate science, who wade through the literature and analyze each new report. By simply stating the facts and not telling us what they mean he is hitting us with a somewhat nerfed version of his ground-breaking Hockey Stick. A pounding that may seem brutal when compared to the comfortable nonsense put out by climate change deniers and fossil fuel apologists but one that is still not yet a full revelation.

I will caveat what is a passionate interjection by simply saying that Michael Mann is one of my most beloved heroes. And so I will do my best to help him out by attempting to lend more potency to his already powerful message.

2 C by 2036 — Digging through the Ugly Guts of it

All that said, Michael Mann laid out some brutal, brutal facts in his Scientific American piece. Ones, that if you only take a few moments to think about are simply terrifying. For the simple truth is that the world has only a very, very slim hope of preventing a rapid warming to at least 2 C above 1880s levels in the near future and almost zero hope altogether of stopping such warming in the longer term.

The first set of figures Mann provides involves the current greenhouse gas forcing. Current CO2 levels are now at the very dangerous 400 parts per million threshold. Long term, and all by itself, this forcing is enough to raise global temperatures by between 2 and 3 degrees Celsius. But hold that thought you were just about to have, because we haven’t yet included all the other greenhouse gasses in that forcing.

Mann, in the supplemental material to his Scientific American paper, notes that the total forcing of all other greenhouse gasses currently in the atmosphere is about 20% of the total CO2 forcing. This gives us a total CO2 equivalent forcing of 480 ppm CO2e, which uncannily mirrors my own analysis here (the science may have under-counted a bit on the methane forcing, but this value is likely quite close to current reality for both the short and long term).

480 ppm CO2e is one hell of a forcing. It is nearly a 75% greater forcing than 1880s values and, all by itself, is enough to raise temperatures long-term by between 3.5 and 4.5 degrees Celsius.

And it is at this point that it becomes worthwhile talking a bit about different climate sensitivity measures. The measure I am using to determine this number is what is called the Earth Systems Sensitivity measure (ESS). It is the measure that describes long term warming once all the so called slow feedbacks like ice sheet response (think the giant glaciers of Greenland and West Antarctica) and environmental carbon release (think methane release from thawing tundra and sea bed clathrates) come into the equation. Mann, uses a shorter term estimate called Equilibrium Climate Sensitivity (ECS). It’s a measure that tracks the fast warming response time once the fast feedbacks such as water vapor response and sea ice response are taken into account. ECS warming, therefore, is about half of ESS warming. But the catch is that ECS hits you much sooner.

At 480 ppm CO2e, we can expect between 1.75 and 2.25 degrees C of warming from ECS. In essence, we’ve locked about 2 C worth of short term warming in now. And this is kind of a big deal. I’d call it a BFD, but that would be swearing. And if there is ever an occasion for swearing then it would be now. So deal with it.

Mann, in his article, takes note of the immediacy of the problem by simply stating that we hit 2 C of shorter term ECS warming once we hit 405 ppm CO2 (485 CO2e), in about two to three years. And it’s important for us to know that this is the kind of heat forcing that is now hanging over our heads. That there’s enough greenhouse gas loading in the atmosphere to push warming 2 C higher almost immediately and 4 C higher long term. And that, all by itself, is a disaster unlike anything humans have ever encountered.

Global Fossil Fuel Emission

(Global annual fossil fuel emission is currently tracking faster than the worst-case IPCC scenario. Aerosols mask some of the heating effect of this enormous emission, what James Hansen calls ‘a Faustian Bargain.’ Image source: Hansen Paper.)

But there is a wrinkle to this equation. One that Dr. James Hansen likes to call the Faustian Bargain. And that wrinkle involves human produced aerosols. For by burning coal, humans pump fine particles into the atmosphere that reflect sunlight thereby masking the total effect of the greenhouse gasses we have already put into the atmosphere. The nasty little trick here is that if you stop burning coal, the aerosols fall out in only a few years and you then end up with the full heat forcing. Even worse, continuing to burn coal produces prodigious volumes of CO2 while mining coal pumps volatile methane into the atmosphere. It’s like taking a kind of poison that will eventually kill you but makes you feel better as you’re taking it. Kind of like the greenhouse gas version of heroin.

So the ghg heroin/coal has injected particles into the air that mask the total warming. And as a result we end up with a delayed effect with an extraordinarily severe hit at the end when we finally stop burning coal. Never stop burning coal and you end up reaching the same place eventually anyway. So it’s a rigged game that you either lose now or you lose in a far worse way later.

Mann wraps coal and other human aerosol emissions into his equation and, under business as usual, finds that we hit 2 C of ECS warming by 2036 as global CO2 levels approach 450 ppmv and global CO2e values approach 540 ppmv. At that point, were the aerosols to fall out we end up with an actual short term warming (ECS) response of 2.5 to 3 C and a long term response (ESS) of about 5 to 6 C. (Don’t believe me? Plug in the numbers for yourself in Mann’s climate model here.)

So ripping the bandaid off and looking at the nasty thing underneath, we find that even my earlier estimates were probably a bit too conservative and Mann, though we didn’t quite realize it at first, is hitting us very hard with his hockey stick.

What does a World That Warms So Rapidly to 2 C Look Like?

OK. That was rough. But what I am about to do is much worse. I’m going to take a look at actual effects of what, to this point, has simply been a clinical analysis of the numbers. I’m going to do my best to answer the question — what does a world rapidly warming by 2 C over the next 22 years look like?

Ugly. Even more ugly than the numbers, in fact.

First, let’s take a look at rates of evaporation and precipitation. We know that, based on past research, the hydrological cycle increases by about 6% for each degree Celsius of temperature increase. So far, with about .8 C worth of warming, we’ve had about a 5% increase in the hydrological cycle. What this means is that evaporation rates increase by 5% and precipitation events, on average, increase by about 5%. But because weather is uneven, what this does is radically increase the frequency and amplitude of extreme weather. Droughts are more frequent and more severe. Deluges are more frequent and more severe.

(Program in which top climate scientists explain how global warming increases the intensity of evaporation and precipitation all while causing dangerous changes to the Jet Stream.)

At 2 C warming we can change this loading from a 5% increase in the hydrological cycle of evaporation and precipitation to a 12% increase. You think the droughts and deluges are bad now? Just imagine what would happen if the driver of that intensity more than doubled. What do you end up with then?

Now let’s look at something that is directly related to extreme weather — sea ice loss. In the current world, about .8 C worth of warming has resulted in about 3.2 C worth of warming in the polar regions. And this warming has resulted in a massive and visible decline of sea ice in which end summer volume values are up to 80% less than those seen during the late 1970s. This loss of sea ice has had severe effects on the Northern Hemisphere Jet Stream, both pulling it more toward the pole and resulting in high amplitude Jet Stream waves and local severe intensification of storm tracks. At 2 C worth of global warming, the Arctic heats up by around 7 C and the result is extended periods of ice free conditions during the summer and fall that last for weeks and months.

stroeve-barret-p-10-plus-2012

(Actual rate of sea ice loss vs IPCC model predictions. The most recent record low value achieved in 2012 is indicated by the dot. Image source: Assessment of Arctic Sea Ice/UCAR Report.)

The impacts to the Northern Hemisphere Jet Stream are ever more severe as are the impacts to Greenland ice sheet melt. Under such a situation we rapidly get into a weather scenario where screaming temperature differentials between the North Atlantic near Greenland and the warming tropics generate storms the likes of which we have never seen. Add in a 12% boost to the hydrological cycle and we get the potential for what Dr. James Hansen describes as “frontal storms the size of continents with the intensity of hurricanes.”

Greenland melt itself is much faster under 2 C of added heat and the ice sheets are in dangerous and rapid destabilization. It’s possible that the kick will be enough to double, triple, quadruple or more the current pace of sea level rise. Half foot or more per decade sea level rise rapidly becomes possible.

All this severe weather, the intense rain, the powerful wind storms and the intense droughts aren’t kind to crops. IPCC projects a 2% net loss in crop yields each decade going forward. But this is likely to be the lower bound of a more realistic 2-10 percent figure. Modern agriculture is hit very, very hard in the context of a rapidly changing climate, increasing rates of moisture loss from soil and moisture delivery through brief and epically intense storms.

The rapid jump to 2 C is also enough to put at risk a growing list of horrors including rapid ocean stratification and anoxia (essentially initiating a mass die off in the oceans), large methane and additional CO2 release from carbon stores in the Arctic, and the unlocking of dangerous ancient microbes from thawing ice, microbes for which current plants and animals do not have adequate immune defenses.

How do we avoid this?

In short, it might not be possible to avoid some or even all of these effects. But we may as well try. And this is what trying would look like.

First, we would rapidly reduce human greenhouse gas emissions to near zero. As this happens, we would probably want a global fleet of aircraft that spray sulfate particles into the lower atmosphere to make up for the loss of aerosols once produced by coal plants. Finally, we would need an array of atmospheric carbon capture techniques including forest growth and cutting, then sequestration of the carbon stored by wood in lakes or in underground repositories, chemical atmospheric carbon capture, and carbon capture of biomass emissions.

For safety, we would need to eventually reduce CO2 to less than 350 ppm, methane to less than 1,000 ppb, and eliminate emissions from other greenhouse gasses. A very tall order that would require the sharing of resources, heroic sacrifices by every human being on this Earth, and a global coordination and cooperation of nations not yet before seen. Something that is possible in theory but has not yet been witnessed in practice. A test to see if humankind is mature enough to ensure its own survival and the continuation of life and diversity on the only world we know. A tall order, indeed, but one we must at least attempt.

Links:

Earth Will Cross Climate Danger Threshold by 2036

What does a World at 400 Parts per Million CO2 Look Like Long-Term?

One Scientist Argues 2036 Could be Point of No Return for Climate Disaster

A Faustian Bargain on the Short Road to Hell

Doubling Down on our Faustian Bargain

Dr. Jennifer Francis, Top Climate Scientists Explain How Global Warming Aps the Hydrological Cycle and Wrecks the Jet Stream to Unleash Extreme Weather

Assessment of Arctic Sea Ice/UCAR Report


A Siberian Heat Wave is Breaking Kara Sea Ice In March, So is it Time to Start Thinking about Hot Arctic Rivers?

There’s a heatwave in Dickson, Russia today. But if you were standing on the shores of this port city on the Kara Sea in the far north, you might not realize it. The forecast high? 29 degrees Fahrenheit.

Dickson is located about 500 miles north of the Arctic Circle and 1,000 miles south of the North Pole. To its west is Novaya Zemlya, a sparely inhabited and typically frozen island between the Kara and Barents Seas. To its east is Siberian Khatanga and Severnaya Zemlya an island system that, until 2005, sat in a pack of Arctic sea ice so dense and resilient, it was once possible to ski from Severnaya all the way to the North Pole even at the height of Northern Hemisphere summer. No more. The sea ice is now but a thin and wrecked shadow of its former glory.

Ask any resident of this, typically frigid, coastal town and they’ll tell you that today it’s abnormally warm, even hot for this far-north locale. For the average high for this day in Dickson is about 1 degrees Fahrenheit. Typical daily highs of 29 degrees (F) don’t normally appear in Dickson until mid-to-late June.

So, in essence, summertime has arrived in Dickson in March and there we see temperatures that are a shocking 28 degrees Fahrenheit above average. Human caused climate change at its most brazen. But we haven’t seen a thing yet…

As we can see in the map below, Dickson is but one location sitting beneath a vast and spreading Siberian and Arctic heatwave:

Temp Anomaly March 20

(Global temperature anomaly map for March 20, 2014 shows world temps +.65 C above the, already hotter than normal, 1979-2000 baseline and Arctic temps at +3.12 C. Note the large heat pool over Siberia. Image source: University of Maine.)

A heatwave extending from the Pacific Ocean in the east to the borders of Mongolia and China in the south. From Surgut in the west and on deep into the Arctic Ocean’s Laptev and Kara Seas in the far north. And it is vast, covering an area roughly 2,000 by 2,000 miles at its widest points. But the heatwave is not disassociated from other high temperature anomalies. It flings a wide outrider over the Beaufort Sea and the Bering Strait. And it sits in a broad flood of warmer than average air riding over Europe, the Middle East and Asia.

This Jet Stream entrained warm air feeds the heatwave even as pulses of much warmer than normal air rise up from the deserts of Western China over Mongolia and up into Russia to give it an added kick. The connecting pattern is a high amplitude Jet Stream wave surging past the Arctic Circle and deep into the Arctic Ocean. It is the kind of high amplitude pattern that, over recent years, has been implicated in so many extreme Arctic heat invasions and related severe weather events.

Temperatures in the far north of this hot zone range from 10 to over 36 degrees Fahrenheit above average for this time of year. For Siberia and the Arctic Ocean it is a heatwave of just below freezing and slightly above freezing temperatures. In other words — what, until recently, used to be summer-like conditions.

Heat Wave Breaking up Ice in the Kara Sea

Such anomalous warmth is enough to put a heavy strain on sea ice. The ice freezes and melts at around 28 degrees F. So extended periods near or above this temperature can have an impact on ice integrity. The ice gets hit by warmer air even as it floats over warmer waters. It’s a kind of one-two punch that can be pretty devastating to sea ice integrity.

And we see just this kind of situation over the past two weeks in the region of the Kara Sea near Port Dickson.

Normally, this frigid ocean zone is covered in a stable sheet of ice called land fast ice. The ice is anchored to the land at various points and tends to remain solid due to reduced movement caused by grounding on the surrounding land features. When the land fast ice starts to go, it usually presages melt.

Kara Sea March 9Kara Sea March 17

(Break-up of Kara sea ice and land fast ice. Top frame shows the Kara on March 7, bottom frame shows break-up visible on March 17. Note that cloud covers a portion of both images and that the March 20 image — the most recent — is too obscured by cloud for detailed analysis. Image source: Lance-Modis)

With the recent influx of much warmer than normal air from the south, this is exactly what we see. A widespread breaking up of Kara sea ice and of even the more resilient features fixed to surrounding lands and islands. And as you can see in the lower frame image, the break-up is quite extensive and dramatic.

The current warm pulse is expected to last for the next few days before shifting back to Svalbard by early to mid next week. Meanwhile, overall Arctic temperatures are expected to remain between 2.5 and 5 C above the, already warmer than normal, 1979 to 2000 average all while a trend establishes that continues to feed warm air pulses up over Asia and into the Arctic Ocean zones of the Kara, Laptev and East Siberian Seas.

Abnormal warmth gathering over the continents in this way can cause both early melt and large flushes of warm meltwater into the Arctic Ocean. An issue that is specially relevant due to recent NASA studies of another section of the Arctic Ocean — the region north of Canada and the Mackenzie River Delta called the Beaufort Sea.

Warm Rivers Heat the Arctic Ocean, Melt Sea Ice

The NASA study found that large pulses of warm water from continental rivers are a strong mechanism for transporting heat into the Arctic and, over recent years, are one of many factors resulting in the sea ice’s rapid recession.

Warm Rivers NASA

(Heat flux from Canadian Mackenzie River into the Beaufort Sea during recent melt years. The first image shows sea surface temperatures on June 12 of 2012 before the Mackenzie River discharged and on July 5, 2012 after. Note the ocean surface water temps rising by as much as 10 C between frames. Image source: NASA.)

The NASA study found that large heatwaves warmed the continents and that this caused continental rivers to disgorge warm water into an already warming Arctic Ocean. The findings showed significant contributions from warm rivers to rising sea surface temperatures and sea ice melt during recent Arctic summers including the record melt year of 2012.

As the Arctic experiences increasing pulses of summertime temperatures during late winter and into spring, it is likely that warm water discharge and overall warmth will play a role at the transition between sea ice freeze and melt season. And this thought brings us back to Russia which appears to be stuck in the abnormally warm pattern covered above. A pattern that, should it continue to flicker and swell, may well bring a surge of warmer than usual water into the Kara, Laptev and East Siberian Seas come later this spring and on into summer. A blow to sea ice that may well emerge but that we can ill afford.

Links:

The University of Maine

Lance-Modis

NASA: Warm Rivers Play a Role in Arctic Melt

The Monsters of Growth Shock Rise: Conflict in the Ukraine, Global Food Crisis, and Spending 500 Billion Dollars to Permanently Wreck the World’s Climate

nasa_p1089035

(Immense Russian wildfires burning through the thawing tundra’s carbon pool during summer of 2012. The bar on the lower left denotes 50 kilometers. From end to end, the burning zone seen is about 500 miles in length. Image credit: NASA. Image source: Smoke From Massive Siberian Fires Seen in Canada.)

The radio and television today blares with the news but never the causes:

US meat, coffee, almond and milk prices to sky-rocket. Ukraine invaded by the Russian petro-state. Exxon Mobile to partner with Russian Rosneft and invest 500 billion dollars in extracting oil and gas from the increasingly ice-free Arctic.

What has caused all this? In a term — Growth Shock.

What is Growth Shock?

It’s what happens when any system grows outside of the boundaries of its sustainable limits. In the current, human case, its primary elements are overpopulation, renewable and nonrenewable resource depletion, climate change, poisoning the biosphere and wasting livable habitats, and a vicious system of inequality in which an amoral elite loots and pillages the lion’s share of planetary resources while driving increasing numbers of persons into poverty, hunger, and vulnerability to environmental/ecological collapse.

In the more immediate sense, human burning of fossil fuels is now intensifying droughts and extreme weather around the world. This is negatively impacting agricultural production. In addition, military aggression on the part of Russia has destabilized one of the world’s largest food producers — Ukraine. But these causes and effects are all a part of the larger structure of an ongoing Growth Shock crisis. The most recent and more intense iteration of a series of events that began in the 1970s and continues today.

In my own writing, I have described the forces of Growth Shock as four monsters (overpopulation, resource depletion, climate change, institutionalized human greed) and, like the Diakiaju of Pacific Rim, they continue to grow stronger and to devour increasingly large chunks of our world.

In the context of our intensifying Growth Shock, conflicts can rapidly escalate as resources grow scarce and various nations, powerful individuals and corporate entities jockey for dominance in the context of increasing limitation and peril. But it is important to note that unless the underlying condition that caused the crisis — what is now likely the most terrible manifestation of Growth Shock ever witnessed by humans — is addressed, then there are no winners. No dominators that survive to flourish in the end. No remnant that sees a prosperous future. Only an ongoing string of worsening conflicts, disasters and temporary victories leading to a terrible and bitter ultimate defeat.

*    *    *    *    *

The Special Interests of a Corporate Petro-State, its Dictator and its Oligarchs

So many of you are probably wondering why Russia suddenly invaded Ukraine? Why the West is taking an increasing stake in this country that, until recently, rarely showed on the international stage?

The reasons currently given by US officials certainly appear noble. We should not allow one country to simply invade, bully and rig the electoral process for another. We should not allow a single nation to flaunt international law and behave in a manner that better fits an age of anarchy and brutality. We should not permit these things from the member of the international community with broad responsibilities and obligations that is Russia.

These are moral and, indeed, appropriate frames for the current conflict. As they are appropriate rhetorical responses to international bullying. But we would also be wise not to ignore the underlying drivers — food crisis and overwhelming political power of fossil fuel special interests.

If anything Russia is now little more than a dictatorial, nuclear-armed petro-state, run by corporate oligarchs and a brutish strong man in the form of Vladimir Putin. A man who has ruled this country for a period now going on two decades through a combination of bullying, trickery, and poll fixing. The kind of character many conservatives these days seem to appreciate…

At 2.2 trillion dollars in GDP each year, its economy is comparable to that of the UK — sizable, but not an equal to economic powerhouses US, China, Germany or Japan. But what the Russian petro-state lacks in economic girth, it more than compensates for in two very destructive and destabilizing items — nuclear weapons and fossil fuels. It also retains a rather sizable and effective military — one whose forces are capable of projecting power and toppling governments throughout both Europe and Asia. One that retains its ability to rain nuclear Armageddon on any nation of peoples around the globe.

And this set of powers is increasingly being used to advance the special interests of the corporate, dictatorial state that is today’s Russia.

But it is Russia’s vast oil and natural gas wealth, the single-minded and narrow interests of its rulers, and the dark impetus that is global climate change that have likely combined to spur Russian’s current aggression.

Food, Fossil Fuels and the Compost Bomb

Burning Rings of Fire

(The tundra compost bomb explodes into burning rings of fire that illuminate the Russian night during 2012. The fire rings seen here are each between 10 and 100 kilometers across. Image credit: NASA. Image source: Burning Rings of Fire.)

For the very natural gas, oil and coal that Russia uses as a mainstay for its economy are now in the process of wrecking its future prospects and propelling it to ever more desperate and violent action.

To understand why, one simply has to think a little bit about permafrost and frozen ground.

A majority of Russia’s land mass sits on a pile of permafrost ranging from 1 to more than 10 meters in depth. In the past, this frozen substrata underlay many of Russia’s fields, cities and towns, forming a kind of frozen bedrock. But over the past few decades, the permafrost began to rapidly thaw under the radical and violent force that is human-caused warming. At first, this event was thought to weigh in Russia’s favor. The newly thawed permafrost would become more productive farmland, many assumed, and the added warmth would extend Russia’s growing season.

But few apparently accounted for the speed and violence of human-caused climate change. What happened instead was literally a firestorm. For the thawing peat retained a combustibility roughly equivalent to brown coal. Even worse, it contained pockets of highly flammable liquified organic carbon and methane. Over top this volatile layer were the great boreal forests and the vast grasslands of the Russian land mass. During the periods of summer drought that emerged as human caused climate change amplified at the end of the 2000s, these forests and grasses were, increasingly, simply piles of kindling growing atop a meters thick layer of volatile fuel.

By 2010, climate change brought on a series of record droughts and heatwaves extending far into the Arctic that set both permafrost thaw and lower latitude regions ablaze. As a result, Russia suffered agricultural losses unlike anything seen in its past. Fields and towns burned. The productive regions burned. Russia was forced to close its agricultural market for exports. World food prices hit all time record highs and the food riots that followed were enough to topple regimes and alight civil wars throughout the world’s most vulnerable states.

Through the summers of 2013, Russia suffered amazing fires in its thawing tundra lands. These blazes were, at times, intense enough to require the calling up of its military and the mobilization of up to 200,000 people simply to fight the fires. Heat and moisture from the thawing tundra spilled out into the Jet Stream and amplified the storm track. By 2013, record drying and burning in the tundra lands turned to record floods in the Amur region of both China and Russia. A tragic song of flood and fire.

Song of Flood and Fire

(Massive wildfires burn over Yakutia as an immense rainstorm begins to form over the Amur region of Russia and China. The fires and deluge would together ruin millions of acres of crops during 2014. Image credit: Lance-Modis. Image source: A Song of Flood and Fire.)

It was a string of climate change induced disasters that produced blow after telling blow to Russian agricultural production.

Meanwhile, around the world, similar droughts, floods and severe wind storms were ripping through the world’s croplands. By early 2014, the world food price index was again on the rise. By February, the index had climbed to 208, a very high level that would put those countries and populations at the margins at risk of increasing poverty and hunger all while potentially destabilizing any number of nations.

Ukraine — The Breadbasket of Europe

Perhaps the irony is lost on Russia that the very fuels — oil, gas and coal — that it views as an economic strength are also the source of its increasingly marginal food security and the ongoing and growing devastation of its lands. But Russia, its strongman, and its corporate oligarchs likely haven’t overlooked the fact that Ukraine is one of the world’s largest food producers. In a world where food is becoming increasingly costly and scarce, this particular commodity may well be more important than even oil, gas, or coal.

Ukraine possesses 30% of the world’s remaining richest black soil. It regularly ranks within the top ten producers of both wheat and corn. It is the world’s top producer of sunflower oil. The reach of its agricultural exports extends to the UK, Europe, Japan, China and into Russia itself. If Russia has a food crisis, it will be to the Ukraine that it turns to first. Moreover, the current Russian dictator must see an imperative not to rely overmuch on the US or its other economic rivals for food.

So it is in this context — a one in which climate change is causing Russia to flood and burn, in which climate change is now beginning to take down global agricultural productivity, and in which the Ukraine could well be seen as the Iraq of world food production (one of the only countries with the ability to radically increase production) — that we must also view both the Ukrainian revolution for independence and the Russian armed invasion as a response.

Russia Already Taking Hold of Some of Ukraine’s Most Productive Farmland

Centuries ago, during the dark ages, bad winters drove waves of tribes out of the frigid northern lands and into the then fertile fields of Rome and Europe. History, it seems, is not without its rhymes. For now, a fiery human-driven thaw and climate change appears to be having a similar impact on the Russia and Ukraine of today.

For the lands already under Russian occupation and threat of invasion (Eastern Ukraine primarily) are also some of Ukraine’s most productive wheat and corn growing zones. These lands under threat of additional Russian incursion, if added to the already occupied and planned to be annexed Crimea would compose the bulk of Ukraine’s agriculture.

Russia’s invasion, thus, must be seen as a direct looting of Ukraine’s lands and productive capacity for Russian and, by extension, Putin’s self interest. A set of interests likely inflamed by Russia’s own declining state of food security.

Climate Change and Why This Fight Must Be Against Fossil Energy, Not for It

Unfortunately, this conflict, like so many others, falls under the ominous shadow of the global fossil fuel trade. A shadow that grows ever darker as the crises imposed by human-caused climate change become more and more dire.

In the context of what could cynically be termed American interests, the fossil fuel giant Exxon recently partnered with Rosneft, an oil corporation Putin and his oligarchs essentially looted from a political rival, to invest 500 billion dollars in drilling and exploration in the Russian Arctic. The zones included in the deal involve the highly unstable clathrate and natural gas stores of the Arctic Ocean. And considering the massive sum invested, one cannot overlook the likelihood that the ESAS’s store of up to 1400 gigatons of natural gas clathrate have now been targeted by global fossil fuel interests for burning. Such an exploitation would result in the near tripling of the current human atmospheric carbon loading — all by itself and without the added inputs from coal, tar sands, or other oil and gas reserves. In other words — corporate insanity in the mad pursuit of profits for a few supremely wealthy and powerful individuals. In this case, a breed of greed-driven insanity that falls under the specter of an increasingly violent and expansionist Russia. One driven to hunger for resources by the land and crops destroying influences of the fossil fuels it continues to seek to exploit.

Here is Growth Shock in its most brazen form when wealthy oligarchs, dictators and corporations collude to profit while ruining the productivity of the lands upon which even they rely. And it is this terrible state that cannot be allowed to continue.

The US, therefore, could strike a blow against both Russian aggression and climate change game over by sanctioning Russian-backed Rosneft, disallowing any American corporation from conducting business with them or any other Russian petroleum entity and going further to say that they will sanction any other global corporation with ties to Rosneft. Use of the power of the dollar and of the global monetary system, in this way, could strike a blow against both the greed that underlies the current Growth Shock crisis and against the maniacal continued and expanding exploitation of extraordinarily destructive fuels.

If the US wishes to continue to bring Russia to heel, it will also use the carrot of access to US grain and food shipments as well as providing partnership arrangements with US alternative energy and sustainability-based corporations in exchange for a peaceful withdrawal from the Ukraine. To help Russia save face, it could provide these offers in a less public fashion or in a way that is not personally insulting to Putin.

Little to No Time Left, But the Crisis Presents a Fleeting Opportunity

In broader context, the deteriorating global food situation, the deteriorating global climate situation and the maniacal quest by fossil fuel companies to access and burn an ever-growing volume of oil, coal and natural gas has reached a critical stage that simply cannot continue for much longer without entirely ruining the prospects for human civilization and, likely, much of life on Earth. The Russia and Ukraine conflict is an opportunity to begin a full attempt to change course and to bring the, now very large and growing, forces of our Growth Shock crisis to bay. If we do not, the window of opportunity may well be closed and we may well have consigned ourselves to ever-worsening conflict under a situation of ongoing resource destruction, destruction of modern civilization’s food base, a situation where the powerful are ever more enabled to take from the weak, and a situation in which a hothouse extinction eventually snuffs out most or all of those that survive the ensuing collapse.

Links:

Growth Shock

Smoke From Massive Siberian Fires Seen in Canada

Burning Rings of Fire

Climate and Frozen Ground

Lance-Modis

A Song of Flood and Fire.

World Food Security in the Cross-hairs of Human-caused Climate Change

Climate Change Pushes FAO Food Price Index to 208 in February

The Economy of the Ukraine

Rosneft Warns West over Crimean Sanctions Woos Japan

Rosneft

Putin — the New Global Shah of Oil

Arctic Warmth to Play the Spoiler? Ocean Surface, Atmosphere Show Anomalous Heat Spike in Advance of Predicted El Nino

Pacific Ocean monitoring stations around the world are now calling for a 50-67 percent chance of El Nino later this year. A warming of the Eastern Pacific that, should it emerge, is likely to result in record atmospheric and ocean temperatures as the human greenhouse gas heat forcing emerges, once more, from the oceans. But, so far, the Eastern Pacific remains in a somewhat cool ENSO-nuetral state. It is a trend that should lead to global atmospheric temperature averages somewhat hotter than the ocean surface. A trend that should not show ocean temperatures spiking, with atmospheric values rising at a slower rate.

But over the past week, according to both GFS model assessments and NOAA observational data, average global ocean surface temperatures have been surging.

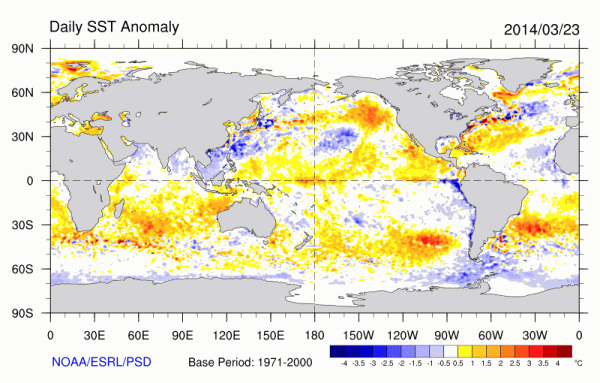
sst.daily.anom1

(Sea surface temperature anomaly from the already warmer than normal 1971 to 2000 base period. Image source: NOAA.)

Large zones of well above average sea surface temperature now cover vast regions of the global ocean system so that anomalous heat now is plainly the dominant feature. Pools of hotter than typical water where averages range from 1 to 4 C above normal now appear off both coasts of South America, through the Indian Ocean between Africa and Australia, off the East Coast of the United States, south of Alaska and in a zone stretching from Norway to Svalbard. By contrast only small cool zones remain in the Eastern Pacific, in the passage between South America and Antarctica, in a swatch of the Tropical Atlantic near Africa, and in isolated regions of the Central and Western Pacific.

Arctic Warmth Drives Temperatures Higher

But the zone of hottest temperatures appear, according to GFS model data below, in the Arctic, where much of the surface waters and ice sheet are warmer than average by 4 C or more. This heat bleed from the Arctic Ocean tips Northern Hemisphere values far above average and is a primary contributor to Arctic atmospheric temperatures in the range of 3-4 C above average (1979-2000) for mid to late March.

During the past few days, the effect of this warm surface was enough to drive temperature anomalies for the oceans higher than .9 degrees Celsius above the 1979 to 2000 global average according to GFS observational data. Understanding that the 1979 to 2000 global sea surface temperature (SST) average was already about .28 C above the 1880s average, we are now seeing SST daily values in excess of 1.18 C above 1880s averages before El Nino comes into play.

TS_anom_satellite1

(Sea surface temperature anomaly for March 18, 2014 vs the, already warmer than normal, 1979-2000 average. Image source: University of Maine.)

Even more impressive are the sea surface temperature values seen during the past two days (March 17-18) — hitting a .99 C positive anomaly or +1.27 C above 1880s values.

For comparison, the global sea surface temperature average for 2013, according to the National Climate Data Center, was .42 degrees Celsius above the 1880s average and the hottest year for ocean surface temperatures, 2003, was .52 degrees Celsius hotter than the 1880s average. The average for the past two days, should the GFS observation stand, is +.75 above the highest annual average on record.

Daily values for even the entire ocean system can show rather large swings, but this high temperature trend is somewhat new and has been ongoing now for about a week.

Oceans dumping heat into the atmosphere without El Nino

By contrast, global atmospheric temperatures within the first two meters, according to the same GFS data, are, on March 18, .69 C above the 1979-2000 average. It is a reading .3 C below current sea surface temperature values. Yet it is also a reading about 1 C over 1880s values and about .3 C above annual global high temperature records set in 2010.

With ocean surface temperatures higher than 2 meter air temperatures, it appears the ocean is now dumping some of its latent heat back into the atmosphere through radiative transfer. This is a situation opposite of what has been observed for much of the past 13-14 years running when Pacific Decadal Oscillation (PDO) went negative and the oceans underwent rapid warming as they sucked up atmospheric heat.

What we now observe in the preliminary GFS data is evidence that the ocean is dumping a bit of this stored and massive volume of heat back into the atmosphere. And we are seeing significant positive oceanic and atmospheric heat forcing well before any major level of Eastern Pacific Ocean warming and associated El Nino have come into play.

Links:

NOAA ESRL

University of Maine

National Climate Data Center

UCAR GFS

UCAR: El Nino or La Nada?

Nature: Human Warming Now Pushing Entire Greenland Ice Sheet into the Ocean

Leading Edge of the Zacharie Ice Stream meets the ocean

(Leading edge of the accelerating Zachariae Ice Stream meets the warming and increasingly ice free ocean on August 20 of 2013. Satellite image source: Lance-Modis.)

Greenland — a vast store of ice three kilometers tall at its center and the final remnant of the Northern Hemisphere’s great glaciers of the last ice age has now begun what is likely an unstoppable rush to the sea. For according to a new report in Nature Climate Change, the last stable region of glacial ice along the Greenland coastline is now accelerating through one of the ice sheet’s largest and deepest outlets — the Zachariae Ice Stream.

Zachariae, the last domino to fall

The Zachariae Ice Stream is a vast river of ice in the northeast section of Greenland. It terminates in two outlets through a broad and deep ice-choked bay facing the Fram Strait.

Throughout the 1990s and into the early 2000s, both warmer air and ocean water temperatures at the margins of Greenland began to speed up and destabilize glaciers all along Greenland’s southern, eastern and western coasts. But the northern glaciers remained relatively stalwart, continuing the rate of seaward motion observed over previous decades.

Then, starting in 2003, something ominous began to happen. A combination of sea ice loss, warming air and ocean temperatures began to affect the northern edge of the great ice sheet. Its speed of forward motion through its outlet bays began to increase. By 2012, the great glaciers were dumping 10-20 billion tons, or roughly 10-20 cubic kilometers of ice into the ocean every single year. In just nine years the Zachariae Ice Stream had retreated a total of 20 kilometers toward the heart of Greenland. By comparison, the Jakobshavn Ice Stream, known to be Greenland’s fastest and located in South Greenland, has retreated 35 kilometers over the past 150 years.

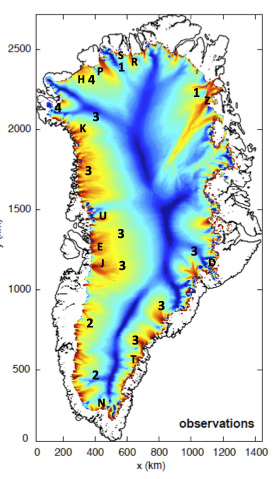
greenland_velocity-base

(Greenland Ice Sheet velocity map as of 2010. Measures in red are in the range of 1,000+ meters per year. Note that ice sheet velocity is fastest at the glacial outlet face and that rapid ice sheet velocity now extends far into interior Greenland. The Zacharie ice stream, the most recent to show rapid acceleration, is indicated by the letter Z in the upper right hand corner of the image. Note how this ice stream plunges deep into the heart of Northern Greenland and that a rapid flow is now established all the way to the ice sheet’s core. Image credit: Joughin, I., B. Smith, I. Howat, and T. Scambos.)

An ice stream drains an ice sheet the same way a river drains a watershed. So long as ice stream flow and rate of glacial recharge at the top of the glacier remains about equal, the ice sheet retains stability. But if the rate of ice stream flow and surface melt exceeds the rate of recharge, the glacier is said to have begun a difficult to reverse process called destabilization.

The initiation of the great Zachariae Ice Stream’s destabilization is ominous for a number of reasons. First, it means the entire Greenland Ice Sheet has, as of the early 2000s, begun a plunge into the ocean that is likely unstoppable. For once the great and massive glaciers of Greenland start to move, gravitational inertia sets in and even a radical cooling of the climate may not halt the surge. Furthermore, the Zachariae Ice Stream drains 16 percent of the entire Greenland ice sheet alone. And finally, Zachariae stretches deep into the heart of Greenland, extending seven hundred kilometers inland and taking hold of Greenland’s massive central glaciers in its now accelerating ocean-ward draw.

“Northeast Greenland is very cold. It used to be considered the last stable part of the Greenland ice sheet,” explained the study’s lead investigator Michael Bevis of The Ohio State University in a recent press release. “This study shows that ice loss in the northeast is now accelerating. So, now it seems that all of the margins of the Greenland ice sheet are unstable.”

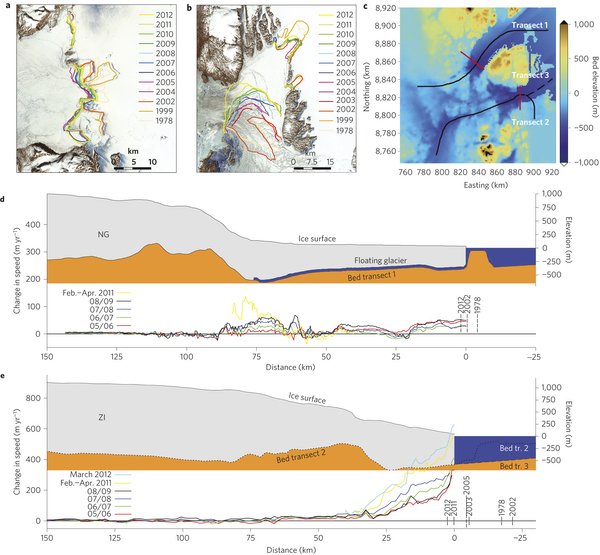
nclimate2161-f1

(Greenland Ice Sheet ice surface elevation change in meters per year from 2003-2006, 2006-2009 and 2009-2012 respectively. Note the elevation loss of greater than 3 meters per year in Northeast Greenland near the Zachariae Ice Stream’s outlet in the final frame. Image source: Nature.)

Margin melt and increasing velocity is an important indicator of overall stability throughout Greenland. For, during much of Greenland’s history, a more solid, less mobile ice margin has kept the central ice locked in. But like the collapsing edge of a plastic swimming pool, Greenland’s drooping margins are starting to let the central ice flows surge toward the coast line. Now the ice margin is destabilized in all the major edge zones leading to the initiation of the ice sheet’s draining.

It is also worth noting that ice sheet motion is just one aspect of Greenland destabilization and a recent NASA paper shows that surface melt since 2009 has also rapidly accelerated. So the ice sheet is now a zone of accelerating glaciers and of annual surface melt all running more frequently and in ever greater volumes toward the swelling seas.

The recent study involved the use of GPS modules scattered over top of the Greenland ice sheet to measure glacial speed, mass and altitude loss. This finding is the most recent study provided by the group’s network dubbed GNET.

Greenland: An Archipelago with an Ice Sheet on Top

In understanding why Greenland’s ice sheets are likely to continue to flow into the ocean, it is useful to look at Greenland in its geological context. For Greenland is essentially an island archipelago with an enormous ice sheet sitting atop it. As such, great channels and fractures run deep into the heart of this frozen plcae. Many of these fractures are below sea level, providing ocean waters access further and further inland as Greenland melts. Furthermore, the high elevation of the ice sheet creates a kind of gravitational inertia that continuously drives glaciers toward the sea. Only friction from the anchoring ground beneath the glaciers, Greenland’s cold climate, and the chill of the surrounding airs and oceans provided Greenland with enough ice recharge while slowing the ice sheets enough to keep it stable during the last interglacial period (Holocene). Now, human warming is pulling that plug by flushing melt water to the ice sheet’s base, creating warmer ocean water invasions at the ice edge and creating conditions by which warm air increasingly both overrides the ice sheet edge and invades into the ice sheet interior.

It is in this context that we should consider the relative positions of ice stream fronts, grounding lines, and co-joining sea level as ice sheets continue their flow toward the ocean:

nclimate2161-f4

(Comparison of Northern Greenland ice face coming into contact with a floating glacier in transect 1 to the deep reaching Zacharie Ice Stream over-riding below sea level land masses in transect 2. Note that sub land elevation beneath the ice surface is below sea level for a stretch more than 150 kilometers inland along the base of the Zacharie Ice Stream. Meanwhile, the ice surface slope and elevation provide seaward momentum even in regions that are near or slightly above sea level. The change in velocity of various sections of ice flow are shown in the colored spaghetti lines. Image source: Nature.)

Conditions in the Context of Human-Caused Climate Change

Current atmospheric conditions now provide enough greenhouse gas forcing to destabilize ice sheets in both Greenland and West Antarctica. These levels, at around 400 ppm CO2 and at around at least 425 CO2e when taking into account all the additional negative and positive forcing from aerosols and other greenhouse gasses, were enough in past climates to send these immense regions of ice plunging into the world ocean and to raise sea levels by between 15 and 115 feet over the course of centuries (Greenland alone contains enough water locked in its ice sheets to raise sea levels by about 23 feet). All of the Greenland ice sheet and large sections of West Antarctica are now undergoing the first stages of a similar destabilization.

Topographic_map_of_Greenland_bedrock

(Topographical map of an archipelago-like Greenland without its overlaying ice sheet. Glacial outflows are likely to be most intense toward the northeast, northwest, southwest and southeast through lower lying zones in the ranging from below sea level to about 100 meters above sea level. From the point of view of surface melt hitting the oceans, it is worth noting that the center of the Greenland ice sheet is currently taller than even the highest surrounding mountains. Image source: Commons.)

Today’s pace of sea level rise is currently 3.2 millimeters each year or a little more than a foot each century. Of this total, fully 1/6th is now being contributed by Greenland. But with inertia and gravitational forces now taking hold as massive ice sheets destabilize, and with human-caused warming continuing to ramp up, it is likely that we can expect both the Greenland ice sheet’s contribution and the pace of sea level rise to rapidly accelerate.

As the great ice sheets sped toward the oceans at the end of the last ice age, the pace of sea level rise hit as high as 10 feet each century. With the pace of human warming now about 30 times faster than at the last ice age’s fall, we may well eventually witness something even outside this difficult to understand context.

Even more ominous is the fact that greenhouse gas forcing levels that are enough to destabilize and then melt all the world’s ice sheets, eventually raising seas by about 250 feet, arrive as soon as the next few decades once CO2 (or equivalent) forcing levels hit between 500 and 600 parts per million value. The current rate of emission gets us there within about 20 years. But, unfortunately, that rate of emission is still rising even as amplifying feedbacks from terrestrial carbon stores in both the Arctic and the tropics loom.

In essence, it looks more and more, from the point of ice sheet stability, like we’ve probably at least locked in a Heinrich type event and will be well on our way to initiating total ice sheet loss over the coming two decades.

Links:

Greenland Ice Impacted Further in Sea Level Rise

Northeast Greenland Ice Sheet Loss

Lance-Modis

Climate Monsters we Want to Keep in the Closet: Heinrich Events, Superstorms, and Warming the Deep Ocean

GNET/PoleNET

An Improvement in Mass Budget for the Greenland Ice Sheet

Hat tip to Colorado Bob

Hat tip to Spike

CO2, Earth’s Global Thermostat, Dials Up to Record 401.6 ppm Daily Value on March 12

NASA GISS, likely the world’s premier Earth atmospheric monitoring agency has dubbed CO2 “The Thermostat that Control’s Earth’s Temperature.” So when human fossil fuel emissions keep cranking that thermostat ever higher, it’s important sit up and take note. For, inexorably, we keep forcing atmospheric values of this critical heat-trapping gas up and up.

According to reports from The Mauna Loa Observatory and The Keeling Curve, daily CO2 values for March 12 rocketed to a record 401.6 parts per million. Hourly values rose briefly higher, touching 402 parts per million. Levels fell back to around 400 ppm on March 13. But the overall trend will continue upward through March, April and much of May when the height of annual atmospheric CO2 readings is typically reached.

By comparison, during May of last year, daily and weekly values hit just slightly higher than 400 parts per million while measures for the month hovered just below this number. We are now about two months away from the 2014 peak. So it appears possible that daily values could rise to 404 ppm or greater with highs for the month potentially exceeding 402 ppm (you can view a comparison graph for May 2013 here).

March CO2 401.6

(Daily and hourly atmospheric CO2 values from March 7 to 13. Image source: The Keeling Curve.)

Such high levels of this gas have not been seen on Earth in over 3 million years. A time when temperatures were 2-3 degrees Celsius warmer and sea levels were 15-75 feet higher than today. And should CO2 levels merely remain at the level currently achieved, we can probably expect at least the same amount of warming long-term.

CO2 in Context

Annually, the average rate of CO2 increase now is an extraordinary 2.2 parts per million each year. This rate is about 6-7 times faster than at any time in geological history. None of the vast flood basalts of the ancient past, no period of natural vulcanism, can now rival the constant and massive injection of this powerful and long-lasting greenhouse gas by humans into the atmosphere.

Last year, the rate of increase spiked to around 2.5 parts per million and we can view this as mere prelude under a continuation of business as usual. For if human fossil fuel emissions are not radically brought into check, the ongoing economic inertia of existing fossil fuel based infrastructure and planned new projects will likely shove this rate of increase to 3, 4 even 7 parts per million each year by the end of this century. As a result, CO2 levels alone have the potential to reach catastrophic values of 550 parts per million by around 2050-2060 that, long term and without any of the added effects of other greenhouse gasses, would be enough to eventually melt all the ice on Earth and raise global temperatures to around 5-6 degrees Celsius above current levels. A level that, through acidification alone and not including damage through stratification and anoxia, could drive up to 1/3 of ocean species to extinction.

CO2 accounts for much of the greenhouse forcing when taking into account the feedbacks it produces on water vapor and clouds. NASA notes:

Because carbon dioxide accounts for 80% of the non-condensing GHG forcing in the current climate atmosphere, atmospheric carbon dioxide therefore qualifies as the principal control knob that governs the temperature of Earth.

All other greenhouse gasses pale in comparison to both its total effect and its current rate of increase. Methane, the next most potent greenhouse gas, accounts for about 15% of the forcing and is rising at a rate of 4 parts per billion (1/550 that of CO2), generating a net effect equal to, in the worst case, an additional .4 parts per million CO2 each year (.29 when aerosols drop out). A troubling and dangerous increase itself. But still a mere shadow compared to the overall rate of CO2 increase.

Only in the most catastrophic of scenarios, when added atmospheric heat, primarily generated through added CO2 and other greenhouse gas forcing, triggers methane emissions equal to 2 gigatons each year in the Arctic (a rate 25 times the current release), would the total methane forcing approach the predicted value for CO2 by the end of this century under current fossil fuel emissions scenarios. More likely, paleoclimate scenarios tend to suggest that the natural methane feedback, long-term, is roughly equal to 50% of the CO2 forcing and is largely governed by it. A dangerous amplifying feedback driven by a devastating and long-lasting CO2 forcing.

CO2 is also the longest lived of the major greenhouse gasses with one molecule of CO2 providing effective atmospheric warming for at least 500 years. By comparison, the oxidation time for a single molecule of methane is around 8 years. What this means is that it takes an ever increasing methane emission just to keep values constant while atmospheric CO2 takes much longer to level off given even a constant rate of emission.

The result is that heat forcing from CO2 tends to remain constant over long periods while methane heat forcing values have a tendency to spike due to rapid oxidation.

methane.rf_.11071836-300x150

(Radiative forcing from a 10 gigaton release of methane in red compared to expected end century CO2 values of 750 ppm. Note how the methane heat forcing spikes and then rapidly falls off. Image source: RealClimate.)

Current rates of CO2 increase, therefore, should be viewed as catastrophic to climates that are both livable and benevolent to humans. A rate of increase that puts at risk severe changes to Earth environments and which provides a trigger for setting off a series of powerful amplifying feedbacks through the medium and long term. These include both loss of ice albedo and the potential for spiking methane emissions from the widespread natural store.

UPDATE:

Most recent daily values from March 12 onward in relationship to the six month trend. Note the sharp spike upward at the end of the period as well as the overall volatility of the trend line. High volatility may well be an indication that the typical carbon cycle is suffering disruption with sinks, stores and sources experiencing larger than typical fluxes.

mlo_six_months

(Mauna Loa Observatory six month trend. Image source: The Keeling Curve.)

Dr. Ralph Keeling today noted:

“We’re already seeing values over 400. Probably we’ll see values dwelling over 400 in April and May. It’s just a matter of time before it stays over 400 forever.”

Links:

The Keeling Curve

May 2013: CO2 Touches 400 ppm

The Thermostat that Control’s Earth’s Temperature

Atmospheric Composition, Radiative Forcing, and Climate Change as a Consequence from the Massive Release of Gas Hydrates

RealClimate

Hat Tip to Climate State

Kudos to Mark Archambault for Looking Sharp

Global Warming and a Mangled Jet Stream: Germany Breaks All-Time Record Highs for Early March, Aswan Egypt Experiences First Rainfall Since 2012

According to reports from WeatherUnderground and WetterOnline, Germany experienced some of its hottest ever recorded temperatures for early March last week.

A large region including a swath of cities stretching from the northern coastline into the heartland and on toward the French border all saw records — some of which had lasted since the 1890s — fall. The heat pulse was enough to push readings into the upper 50s, 60s, and even the low 70s (F) for some regions. A set of highs extraordinary for a Germany that typically sees daytime temperatures ranging from near freezing to the low 40s this time of year.

Such a surge of warm air was enough to shatter more than 20 long-standing records by as much as 5.9 degrees (F). An unprecedented outbreak of March heat which set trees to blooming and spurred Germans on toward local waterfronts.

Germany's March Heatwave

(Germany’s March 9 heat wave set off 22 all-time high temperature records — shown in star pattern outlines. Temperatures shown are in degrees Celsius. Image source: WetterOnline.)

Some of the official new records for early March included:

Munster 22.4°C (72.3°F) former record 19.1°C (66.4°F)

Koln/Bonn 21.1°C (70.0°F) former record 19.8°C (67.6°F)

Dusseldorf 20.9°C (69.6°F) former record 20.2°C (68.4°F)

Aachen 20.8°C (69.4°F) former record 20.2°C (68.4°F) POR back to 1891

Hannover 20.2°C (68.4°F) former record 18.4°C (65.1°F)

Hamburg 20.0°C (68.0°F) former record 17.6°C (63.7°F) POR back to 1891

Bremen 19.5°C (67.1°F) former record 18.2°C (64.8°F) POR back to 1890

Kiel 19.3°C (66.7°F) former record 16.7°C (62.1F)

Bremerhaven 18.7°C (65.7°F) former record 16.5°C (61.7°F)

Helgoland 10.6°C (51.1°F) former record 10.5°C (50.9°F)

Mangled Jet Stream, German Heat, Egyptian Storms

Much of Central, Southern and Eastern Europe has been under the influence of a persistent high amplitude Jet Stream wave pattern throughout late winter. This pattern has consistently dredged warmer air up from North Africa and the Mediterranean and flung it over Spain, France, Germany, Switzerland, Austria, the Balkans, Poland and Ukraine. The result has been much warmer than normal conditions for this region.

On Sunday, the pattern amplified pushing a center of much warmer than normal air directly over Germany — setting off new record high temperatures for early March. It is a Jet Stream pattern that remains in place today and one that may amplify with the heat of summer putting Central and Eastern Europe and Western Russia under the gun for potential droughts, heatwaves and fires come summer time. A set of conditions that may further exacerbate already strained global food markets, economic and political tensions.

Jet Stream Germany March 9

(High amplitude Rossby type wave pattern brings record heat to Germany, record rains to Aswan Egypt. Image source: The University of Washington.)

Returning to early March conditions, the front side of this high amplitude wave pushed a deep trough down through Eastern Ukraine and Russia formed a cut-off low over Greece and accelerated the Jet Stream flow to the south. The result was a high amount of atmospheric instability in a rather unusual place.

Moisture flooding in off the Mediterranean flooded into the storm flow that was now centering over one of the driest places on Earth — northern Egypt. By March 9-10, the pattern had erupted into a series of freak thunderstorms that belched thunder, lightning, hail and record rainfall over this typically parched section of Egypt. In total, Luxor, the city of the famed Valley of the Kings, received nearly 1.2 inches of rainfall. This is nearly 30 times the average yearly rainfall for this desert land, which it received in just one day.

Nearby, Aswan received a stunning .6 inches of rainfall, the first rains seen for this region since 2012 and also a new record.

Events Sunday in both Egypt and Germany are not without their broader context in a world shoved toward increasingly severe weather by human-caused climate change. This year, the world over is experiencing a string of highly anomalous storms, heatwaves, droughts, cold snaps and floods. An ongoing occurrence that for some regions has resulted in a 500% amplification of climate extremes.

Unfortunately, with El Nino about to give its dark gift of ocean warming back to the atmosphere and with ice sheets in both hemispheres just starting their cycles of catastrophic melt, the increased intensity of weather and climate anomaly has only just initiated.

Links:

WeatherUnderground

WetterOnline

University of Washington

Extreme Weather Events Increase by 500%

Hat Tip to Colorado Bob!

The Arctic Methane Monster’s Nasty Little Helpers: Study Finds Ancient, Methane Producing, Archaea Gorge on Tundra Melt

An emerging methane feedback in the Arctic. It’s something that, since last summer, I’ve been calling the Arctic Methane Monster. A beast of a thing composed of giant reserves of sea bed methane and an immense store of carbon locked away in Arctic tundra.

How dangerous and vicious the monster ends up being to a world set to rapidly warm by humans depends largely on three factors. First — how fast methane is released from warming stores in the sea bed. Second — how swiftly and to what degree the tundra carbon store is released as methane. Third — how large the stores of carbon and methane ultimately are.

permafrost_arctic-1024x557

(Thawing permafrost and organic carbon in Yedoma region of Russia. Image source: NASA.)

On the issue of the first and third questions, scientists are divided between those like Peter Wadhams, Natalia Shakhova and Igor Simeletov who believe that large methane pulses from a rapidly warming Arctic Ocean are now possible and warrant serious consideration and those like Gavin Schmidt and David Archer — both top scientists in their own right — who believe the model assessments showing a much slower release are at least some cause for comfort. Further complicating the issue is that estimates of sea-bed methane stores range widely with the East Siberian Arctic Shelf region alone asserted to contain anywhere between 250 and 1500 gigatons of methane (See Arctic Carbon Stores Assessment Here).

With such wide-ranging estimations and observations, it’s no wonder that a major scientific controversy has erupted over the issue of sea bed methane release. This back and forth comes in the foreground of observed large (but not catastrophic) sea-bed emissions and what appears to be a growing Arctic methane release. A controversy that, in itself, does little inspire confidence in a positive outcome.

But on the second point, an issue that some are now calling the compost bomb, most scientists are in agreement that the massive carbon store locked in the swiftly thawing tundra is a matter of serious and immediate concern.

Tundra Thaw by Human GHG Now Practically Inevitable

At issue here is the initial power of the human heat forcing and what consequences that forcing is likely to unlock. Consequences that are directly tied to the amount of greenhouse gasses we emit. A total forcing that is now likely equivalent to around 425 CO2e when taking into account the effect of human aerosols and an even more ominous 480 CO2e when and if those aerosols fall out (IPCC and MIT).

The first number, 425 CO2e, were it to remain stable over years, decades and centuries, is enough push global temperatures above the 1.5 C warming threshold that would thaw the northern hemisphere tundra. And within this tundra is locked a store of about 1,500 gigatons of carbon. A massive store that is set to eventually, thaw, decompose and release its carbon as either CO2 or methane over the long period of warmth that is to come.

Area of contiguous permafrost

(Northern Hemisphere Permafrost Zones. Image source: NASA.)

The immense size of this carbon store represents an extreme risk both for extending the period of human warming and for, potentially, generating a feedback in which natural warming adds to, rather than simply extends, human warming. By comparison, human fossil fuel emissions have already resulted in about 540 gigatons of carbon being released into the atmosphere. The tundra store alone represents nearly three times this amount. But the concern is not just the massive size of the tundra store now set to thaw, or the rate at which the tundra will, eventually, release its carbon to the atmosphere. The concern is also how much of the tundra store carbon is released as either methane or CO2.

Methane Provides a Strong Amplifying Feedback

Since methane’s radiative absorption is about 35 times that of CO2 by volume in the IPCC climate assessments (and its short term global warming potential is as much as 72 to 105 times that of a comparable amount of CO2) and since methane release sets off other feedbacks by turning into CO2 after it is oxidized and by increasing atmospheric water vapor, a strong greenhouse agent in its own right, a significant portion of tundra carbon being liberated as methane could result in a rather powerful heat amplification. In the worst case, such an amplification could set off conditions similar to those during which other mini-greenhouse gas runaways occurred — such as the Permian, Triassic and PETM events.

Which is why the release of a new paper should be cause for serious concern.

Ancient Archaea — The Arctic Methane Monster’s Nasty Little Helpers

This week, a paper published in Nature Communications described findings based on a study of thawing Swedish permafrost. The study investigated how microbes responded to thawing tundra in various mires throughout warming sections of Sweden. What they discovered was the increased prevalence of an ancient methane producing micro-organism.

Billions of years ago, methane producing cyanobacteria or archaea were prevalent in the world’s oceans. The methane they produced helped keep the Earth warm at a time when solar output was much less than it is today. Later, as oxygen producing plants emerged, the archaea, to which oxygen was a poison, retreated into the anoxic corners of the more modern world. Today, they live in the dark, in the mud, or in the depths of oceans. There, they continue to eek out an existence by turning hydrogen and carbon dioxide into methane.

A kind of archaea, the newly discovered organism, named methanoflorens stordalenmirensis, was found to be exploding through sections of rapidly melting Swedish tundra. In fact, it is so at home in regions of melting permafrost that it blooms in the same way algae blooms in the ocean. As a result, it comes to dominate the microbial environment, representing 90% of the methanogens and crowding out many of the other microbes.

Distribution of Methanogen

(Methanogen shows global distribution. Each dot indicates a location where methanoflorens stordalenmirensis was discovered. Image source: Nature.)

That these massive archaea blooms can effectively convert large portions of the newly liberated tundra carbon store into methane was not at all lost on researchers:

“Methanoflorens stordalenmirensis seems to be a indicator species for melting permafrost. It is rarely found where there is permafrost, but where the peat is warmer and the permafrost is melting we can see that it just grows and grows. It is possible that we can use it to measure the health of mires and their permafrost. The recently documented global distribution also shows, on a much larger scale, that this microbe spreads to new permafrost areas in time with them thawing out. This is not good news for a stable climate“, said study author Rhiannon Mondav.

So what we have here is a billions year old microbe that thrives in wet regions called mires where permafrost is melting, rapidly converts tundra carbon to methane, readily spreads to new zones where permafrost melt occurs, and explodes into algae like blooms to dominate these environments.

One could not ask for a set of more diabolic little helpers for the already very disturbing Arctic Methane Monster…

Implications Going Forward: Arctic Methane Emission Not Currently Catastrophic, But Likely to Continue to Grow

Recent research shows that the current methane emission from all natural sources north of 53 degrees north latitude is on the order of 81 trillion grams (TG) each year. A portion of this, about 17 TG, comes from the East Siberian Arctic Shelf. Other inputs are from sea bed sources, thawing tundra and existing wetlands in the region. Meanwhile, the global emission, including both human and natural sources is in the range of about 600 TG each year. Overall, this emission is enough to overwhelm current sinks by about 40 TG each year, which results in continuing increases of atmospheric methane.

Atmospheric Methane Mauna Loa

(Atmospheric methane levels since 1969, Mauna Loa, show levels rising by about 200 ppb over the 45 year period. Image source: NOAA ESRL.)

As more and more of the tundra melts and as seabed methane continues to warm it is likely that total Arctic methane emissions will continue to rise, perhaps eventually rivaling or, in the worst case, exceeding the size of the human methane emission (350 TG). But, to do so, current Arctic and boreal emissions would have to more than quadruple — either through a slow increase (high likelihood) or through more catastrophic large pulse events (lower likelihood, but still enough for serious concern). By contrast, recent warm years have shown increases in the rate of methane flux/emission of around 5% with the average flux increase being around 2%.

It is worth noting that NOAA and a number of other agencies do track methane emissions in the Arctic but that a comprehensive tool set for accurately tracking the total emission does not appear to be currently available. Instead, various studies are conducted in an effort to capture total emissions levels. Monitoring does, however, track total atmospheric values.

Links:

Discovery of a Novel Methanogen Prevalent in Thawing Permafrost

Methane Producing Microbe Blooms in Permafrost Thaw

The Arctic Methane Monster

The Arctic Methane Monster Stirs

Living in a World at 480 CO2e

Caves Point to Thawing in Siberia

NSIDC: Climate and Frozen Ground

Thawing Permafrost Could Cause 2.5 Times the Warming of Deforestation

Is a Sleeping Giant Waking in the Arctic?

Radiative Forcing of Non CO2 Greenhouse Gasses

Carbon Tracker CH4

Arctic Heat Drives Sea Ice Back Into Record Low Territory At Top of Melt Season

record low sea ice cover March 10

(Record low sea ice cover on March 10, 2014 a time that typically features sea ice maximum. Note that all basins show sea ice area and extent below the, already lower than normal, 1979-2000 base-line. Image source: Climate Change Institute.)

Abnormal, warm southerly winds at the lower and upper levels. More large heat pulses driven by high amplitude Jet Stream waves. Tropical heat launching into the Arctic Stratosphere over the Himalayas. Warm water upwelling from the rapidly heating ocean depths.

All conditions that continue to place the Arctic sea ice under a state of constant siege — winter and summer. All again doing their dangerous work in pushing the now critically weakened ice, once more to record low levels.

Under this state of ongoing assault, regions near Svalbard fell into rapid retreat as floes fractured over warming waters in the Bering Sea and west of Greenland. The result is the lowest measure of winter time sea ice area ever seen in any record for this day since Arctic observation began. Yet one more passing milestone in the vicious and rapid progression of human-caused climate change.

2011 Records Fall

According to reports from NSIDC and Cryosphere Today, Arctic sea ice area dropped to a record low of 12.95 million square kilometers on March 10 of 2014. It is a measure more than 2 million square kilometers, or an area roughly the size of Greenland, smaller than that seen during the late 1970s and breaking the previous record low, set just three years ago, by 150,000 square kilometers. Sea ice extent, meanwhile, had fallen to 14.5 million square kilometers, a measure roughly tied with the previous record low set in 2011 and also about 2 million square kilometers below area values seen during the late 1970s.

It is worth noting that the trend lines for both sea ice extent and area are well below previous trends for record low years 2007 (green below) and 2012 (pink below).

Sea ice area march 10 CT

(March 10 Sea Ice Area showing record low for the day. Image source: Pogoda i Klimat. Data Source: Cryosphere Today.)

Melt Hot Spots: Ocean Zones Near Svalbard and Greenland

With the Aqua Satellite again cresting the Arctic, we can peer down through cloud and ice to see dark, open waters peeking through kilometer-wide cracks or dominating entire ocean zones during a very anemic peak freeze. With recent days bringing average Arctic temperatures in the range of 2.5 to 4.5 degrees Celsius above normal and with local spikes in the +20 degrees C above normal range, areas of visible retreat and fragility abound.

These heat spikes combined with strong southerly winds near Svalbard to drive a rapid, far-north, retreat of ice floes on March 9-11 into zones that previously saw open ocean only during summer time. This far northward invasion of dark, open water is the primary culprit of the new record low:

Open Ocean North of Svalbard March 11

(Open ocean north and west of Svalbard on March 11, 2014. It is worth noting that Svalbard is about 600 miles from the North Pole. The Current sea ice edge, during a time when ice extent should be at its maximum, is now just 500 miles from the North Pole. Image source: Lance-Modis.)

A large region of northern Baffin Bay near Northwest Greenland and the Canadian Arctic Archipelago also showed extensive melt and open ocean zones during recent days.

Over past decade, this region has shown increasing susceptibility to warm ocean water upwelling near the Nares Strait with winter-time melting of northern extremities in Baffin Bay. But this year’s melt was particularly strong. An event that coincided with sea-bed earthquakes and anomalously high methane levels (1950 ppb+) in the region through mid-to-late February. It is possible that upwelling is both driven by warm water currents now filling up the Baffin deep water zone and by the somewhat energetic out-gassing of sea bed methane through faults and seeps.

It is worth noting that evidence of these seeps is based on satellite observation and very little in the way of comprehensive seabed methane assessment has been completed by the global scientific community, a gap in understanding that may well come back to haunt us as human-caused warming continues to put increased heat pressure on both deep and shallow ocean carbon stores.

Baffin Bay Nares Extensive cracked ice open water

(Fingerprints of warm water upwelling, sea-bed methane release? Extensive open water, cracked ice in North Baffin Bay, Nares Strait region during height of sea ice extent, 2014. Image source: Lance Modis.)

Heightened risk for record low year, total meltdown

The current record low status for end winter sea ice and the approach of El Nino, which tends to add heat to the European and Asian continents, results in an increased risk that new record lows for sea ice area, extent and volume may be reached by end of summer 2014. Both warm air and water flushing in from the continents have been implicated in large sea ice retreats during recent years and a rapid heating of the large land mass over Arctic Europe and Asia, along with a simultaneous warming of Alaska, should El Nino progress, may amplify both continental heat build up and heat transfer through river outflow into the Arctic Ocean Basin.

In addition, high temperature anomalies during late winter to early spring continue to suppress sea ice recovery late season. The result is that more open ocean is now available to absorb energy from the rising sun or to deliver that energy in the form of waves and currents to the greatly diminished ice pack. The one saving grace, if it can be viewed as such, is a minor, though likely temporary rebound in sea ice volume extending from late last year, likely bringing volume values into the range of 3rd or 4th lowest on record for March.

It is also worth considering that sea ice area trends show an ever-increasing possibility of a record melt year with melt rates similar to 2007, 2011 or 2012 enough to bring 2014 to new record lows.

sia_projections_from_current_date

(Sea ice area projections based on past trends. It is worth noting that the melt season has lengthened by nearly a month since 1979, the result being increasing volumes of ice lost from end of freeze to end of melt. Image source: Jim Pettit. Data Source: NSIDC.)

In any case, this combination of conditions generates a high risk of sea ice reaching new record lows in sea ice area, volume and/or extent come end of summer 2014 (60%). This prediction finds its basis in observed records of past melt seasons and in the fact that very few days remain for a potential late-season uptick in sea ice. If record low values hold and a late season rebound does not occur, it is worth considering this simple fact: each time sea ice reached a new record low maximum sea ice area since 2005,  a new record area melt was achieved by end of summer. That said, not achieving a record low maximum is no guarantee of safety, as 2012 so starkly proved.

It is also worth considering that sea ice may be very close to tipping points and once thinned beyond a certain threshold will be unable maintain integrity. In such an event, warm, dark, increasingly mobile ocean waters eventually overwhelm an ice pack fighting for survival. We may well have seen the beginning of such a consequence during 2012 when powerful and energetic storms that would usually result in sea ice retention only served to hasten record losses. A warning that there are fewer and fewer conditions favoring summer ice retention as the Arctic energy balance is ever more forcibly shoved toward melt.

Given these potentials — the high likelihood for record low area at maximum, the ever-lengthening melt season, and the increasing fragility of ice come end-summer — it is worth considering the unexpected worst case: total sea ice loss or near total ice loss (less than 1 million square kilometers area) by end of summer 2014. At this point, given record low area conditions late in the freeze season, we will assess a slight uptick of total ice loss risk over the previous year from 10 to 15 percent — a somewhat increased risk that sea ice values reach near ice free levels during a catastrophic melt this summer (15%).

If an observed start to the melt season begins early and if melt rates rapidly steepen, we will likely reassess both the likelihood of new records at minimum and a potential ice-free end summer state in the face of increased risks. At this point, both measures are low confidence estimates based on trends analysis, observation of current unprecedented Arctic warmth, and continued fragile ice state conditions.

UPDATE:

March 11 Arctic sea ice area values showed continued decline into record low territory. March 10 to 11 area losses, according to Cryosphere Today, extended an additional 70,000 square kilometers pushing the value down to 12.88 million square kilometers over the entire Arctic. This level is about 130,000 square kilometers below the previous record low value for today set in 2011 at 13.1 million square kilometers.

Abnormal atmospheric warmth over the regions most affected including north and east of Svalbard, Frans Joseph Land, the Kara Sea, a large region of Russia near Dickson, and in the region of the Nares Strait continued to provide melt pressure driving the most recent record low.

Links:

NSIDC

Climate Change Institute

Jim Pettit

Lance Modis

Cryosphere Today

Pogoda i Klimat

Arctic Ice Graphs

Climate Change Pushing World to Brink of Food Crisis as FAO Price Index Jumps to 208.1 in February

Food…

Along with water and energy, which are related to its production, it is one of the key commodities necessary to keep the world’s 7.1 billion people alive, healthy and happy. Its price and availability can determine the fate of nations and the stability of the world’s economic system. Rising prices mean risk of increasing poverty, risk of political instability and, in the worst instances, a creeping spread of hunger and malnutrition about the globe.

And ever since the year 2000 world food prices have been steadily and inexorably rising.

FAO index February 2014

(UN FAO Food Price Index through February of 2014. Image source: UN FAO.)

The UN FAO Index — An Indicator for Global Crisis

The United Nations provides a valuable index that comprehensively assesses the overall cost of food in both real and nominal terms. Managed by the Food and Agriculture Organization (FAO), the food price index has been tracking global indicators for this valuable commodity since 1961.

The FAO Index emerged in a world that hosted 3 billion people. A world that was just beginning to realize the strengths and limitations of its new, mechanized, fossil fuel-dependent, civilization. A world where new fossil water resources and slow to recharge groundwater were being tapped through drilling. A world where farming was expanding into even the most marginal and vulnerable of regions even as forests continued to be converted into farmland at a stunning rate.

From a period of the 1960s on into the first years of the 1970s, the nascent FAO price index recorded stable if moderately high global food prices. By the 1970s, food prices spiked along with the cost of energy during an oil crisis related to a Growth Shock as US and western energy production encountered a series of difficult to cross boundary limits.

The First Test — 1970s Energy and Climate Crisis

The FAO also emerged in a world where agriculture was heavily dependent on fossil material and energy inputs — for machinery, pesticides, and for fertilizer. This single commodity dependence meant that any spike in oil prices also had a deleterious effect on food access. And energy price spike after energy price spike occurred throughout the 1970s. A first warning that such a high level of reliance on just one commodity — oil — was a clear and critical weakness for the global economic and food distribution system.

At the same time, an intense drought swept over Africa. The rains that annually drenched the Sahel region faded and, then, for a period of about a decade, simply failed. The energy crisis combined with severe decadal climate shifts in Africa to further stress world food markets already reeling under oil price shocks. Higher prices, political instability and widespread hunger soon followed.

During this time, the link between human fossil fuel emissions and a potential to radically alter the climate in a way that was far more hostile to traditional agriculture was mostly unexplored. But despite this general lack of awareness, changes were already lining up that would have severe consequences for human agriculture within only a few decades. A then less visible, but no less important, weakness resulting from industrial agriculture’s, and much of modern civilization’s, reliance on oil, gas and coal. Fuels whose endlessly ramping use created long-term and ever increasing damage to environments in which human agriculture could be reasonably expected to exist.

Rise From Crisis Without Addressing Underlying Vulnerability

Political pressure was put on the Middle East to make energy more cheaply and readily available. Forests were cut down in South America to make room for more farmland. Saudi Arabia mined fossil water to farm its deserts. Meanwhile, the rains eventually returned to Africa and so prices again fell to far more affordable levels during the 1980s and 1990s. But the key weaknesses — reliance on fossil fuels for agriculture, an immense world population that jumped to 4, 5 and then 6 billion, a host of problems and vulnerabilities emerging from big industrial farms, and increasing agricultural vulnerability to water scarcity and related climate shifts were not addressed.

So as the world entered the first decade of the new millennium and signs of crisis began to again emerge, it found itself radically unprepared to deal with what was shaping up to be a more vicious repeat of the shocks experienced during the 1970s.

Energy Shocks, Extreme Weather, Consumption Changes, 7 Billion People

Entering the first decade of a new millennium, food prices were again on the rise. Oil shocks were starting to once more ramp up and strange changes to the world’s climate were starting to spur extreme drought and rainfall events that were outside of the typical context of human agriculture. Meanwhile, emerging economies in Asia such as India and China were beginning to demand more meat thereby putting additional stress on the world’s farmland — as meat-based agriculture is about 1/50 as efficient on a calorie comparison basis when compared to simply farming grains, legumes and vegetables.

By the middle of the decade, a series of crisis points had been reached. Worldwide demand for both food and energy was raging. Populations were nearing 7 billion souls. Oil price increases were leading more nations to use farmland for biofuels production creating a competition for land use between fuels and food. Australia was suffering its worst drought in 1,000 years and many other regions of the world were likewise sporadically hit. But the big, severe, widespread droughts would wait for next decade to emerge with even greater force and rapacity.

By 2007, world oil prices were screaming toward record levels and an already climate and demand stressed food market rapidly followed. By 2008, the FAO index had surged to a record level of 201. Such a large jump had numerous and far-reaching effects. Hunger again became an issue of serious concern in Africa and, sporadically, various countries began to see food riots as the distribution system painfully rebalanced to reflect new levels of increased demand and struggling output. Global economic recession immediately ensued and prices were drawn down through the economically vicious process of demand destruction.

Russian Wildfires 2010

(Satellite shot of smoke from massive wildfires raging across Russia during 2010. The largest smoke plume in this image is 3,000 kilometers in length, about the distance between Los Angeles and Chicago. Image source: Lance-Modis.)

As 2010 opened a new decade, a weak El Nino combined with human caused climate change to produce a powerful and persistent heat dome over Russia and the Ukraine. As spring continued into summer, the heat intensified and massive wildfires began to break out. A pallor of smoke covered millions of square miles as millions upon millions of acres burned. The fires and coincident droughts brought Russian, Eastern European and Ukrainian grain production to its knees. The situation was so severe that Russia cut off grain exports, keeping all its production to feed its own citizens.

The effect to global food markets was apocalyptic. Food prices surged through 2010 and by 2011 peaked at an FAO index value of 229.9, the highest level yet on record. High food prices swiftly rippled through a number of the world’s most vulnerable regions and food riots, which had been sporadic, became national phenomena. Hardest hit were teetering nations in the Middle East that lacked the economic muscle to provide their populations with adequate food supplies. Egypt, Libya and Syria faced outright civil war and/or regime change due, in large share, to social stresses sparked by food scarcity.

Rising Threats for the Current Day

The world’s primary response to this major price spike was to simply plant more land. But as this new rush occurred, extreme weather got a radical boost. Sea ice losses, by end of summer 2012, had totaled more than 50% in area and extent values since 1979 while volume measures had brutally fallen by over 80%. As a result, the Arctic had lost about 4% of its albedo and was undergoing a period of rapid heat amplification. These changes would result in more persistent and severe Jet Stream patterns that would deliver an increasingly extreme battery of droughts and deluges to the Northern Hemisphere. Meanwhile, warming had now resulted in an amplification of the global hydrological cycle by 6%. This amplification meant drying of the land came on more rapidly, setting the stage for intense drought initiation even in regions that weren’t seeing more stuck weather patterns.

As 2013 rolled into 2014 drought was widespread and severe in large zones from California to Brazil and Argentina, to Israel, Lebanon, Syria and Iraq, to Vietnam, Singapore and Malaysia, to China and Australia. Many of these droughts are among the worst and most widespread on record. Meanwhile, severe rainfall and wind events over Britain and Western Europe are also disrupting agriculture and causing direct damage or inundation of crops. And though the world was planting a massive number of acres during 2013-2014, the effects of these various and wide-ranging weather emergencies were again starting to take hold.

For by February of this year the world FAO index had risen to 208.1 — a level very close to 210 which is considered to be the point that high food prices begin to result in the potential for major social unrest worldwide.

High Risk Outlook for 2014

With so many regions experiencing drought, with human-caused climate change playing havoc with the world’s weather, and with the rising risk of a moderate-to-strong El Nino emerging in the Eastern Pacific, the world appears to be entering yet one more period of high risk for another major food shock. El Nino is traditionally known to produce drought in Australia and Southeast Asia. And while it is has not historically tended to coincide with drought in Russia and Eastern Europe, it does tend to shift weather patterns toward hot in those regions. With the hydrological cycle amped up by human-caused climate change and with ridges/blocking patterns more prevalent due to added atmospheric heat content and sea ice loss, it might be wise to consider the 2010 spate of extreme drought and fires in this region a potential risk as the year and a likely El Nino progresses.

Links:

Food and Agriculture Organization (FAO)

Lance-Modis

Growth Shock: Tragedy and Hope at the Limits of a Finite World

Is Meat Sustainable?

2010 Russian Wildfires

Russian Ban On Grain Exports Begins

Climate Change and Rising Food Prices Heightened Arab Spring

Arctic Albedo Falling at Twice Expected Rate

World Food Security in the Cross-Hairs of Human-Caused Climate Change

El Nino is Coming

Hat Tip to Colorado Bob

NOAA: El Nino is Coming. Extreme Weather, New Global High Temperature Records to Likely Follow.

In the masterfully constructed fantasy world of Westeros, George R.R. Martin’s characters have a saying — Winter is Coming.

The words are spoken with an air of dread as winters in this realm can extend for years, starve entire cities, and push civilizations to the brink. In a world impacted by human climate change, the words El Nino might be uttered with a similar dread, as it foreshadows a dumping of Pacific Ocean heat back into an already warming atmosphere.

The result is that most moderate to strong El Nino years are record hot years, pushing the global temperature average ever higher through a cycle of natural variability warped toward hot by human greenhouse gas forcing. And, in fact, even two of the recent weak El Nina years, 2005 and 2010, were both hottest years on record:

gistemp_nino_s

(NASA GISS temperature graph showing global increases since 1950 reflecting El Nino, La Nina, and ENSO neutral years. Image source: NASA GISS.)

These new record high temperatures occurred during a period when cold water upwelling in the Pacific was particularly strong. Driven by the most powerful trade winds on record, this ocean surface and atmosphere mixing dumped an unprecedented amount of heat into Pacific waters. It is a period known as negative Pacific Decadal Oscillation and it usually reflects a time of cooling for the atmosphere. But, despite this rather intense period of heat transfer from atmosphere to ocean, the atmosphere remained at or near record hot levels, only slightly slowing in its rate of upward rise.

El Nino is Coming

Now, according to reports from NOAA, the waters just below the surface of the Eastern Pacific are starting to warm and rise. This warm water pulse, known as a Kelvin Wave, is proceeding from west to east even as it is rising from the depths. The source of these warm waters is a deep, hot pool in the Central and Western Pacific. A pool of warmth that has been intensified over the last 14 years by a near constant bombardment of above normal ocean surface temperatures. The hot ocean waters evaporated, becoming more heavily burdened with saline and eventually sank far into the depths.

Now, as the trade winds have weakened and westerlies sporadically began to emerge, this pool of hot water was drawn eastward by upwelling currents near the South American Continent. Should these hotter waters break the surface, the world will experience a moderate to strong El Nino along with global atmospheric temperatures that are likely to be the hottest on record.

From the NOAA ENSO forecast:

While all models predict warming in the tropical Pacific, there is considerable uncertainty as to whether El Niño will develop during the summer or fall. If westerly winds continue to emerge in the western equatorial Pacific, the development of El Niño would become more likely. However, the lower forecast skill during the spring and overall propensity for cooler conditions over the last decade still justify significant probabilities for ENSO-neutral. The consensus forecast is for ENSO-neutral to continue through the Northern Hemisphere spring 2014, with about a 50% chance of El Niño developing during the summer or fall.

Meanwhile, the latest Climate Prediction Center forecast now shows a 52% chance that El Nino will form by the months of October, November and December:

CPC ENSO forecast

(CPC ENSO forecast through December of 2014. Image source: IRI CPC)

This is slight increase of about 2% from even the late February analysis.

It’s worth noting that though continued forecast agreement across agencies through early March provides increased likelihood of El Nino’s emergence later this year, spring forecasts are typically somewhat unreliable due to atmospheric instability. In addition, the Pacific Ocean remaining in a negative PDO state over the last 14 years also produces some uncertainty in the forecast.

“Impressive” Subsurface Warming

In addition to models showing an increased chance of El Nino starting in April and rising through November, projections imply that this El Nino, should it emerge, may be the strongest in over a decade. As noted above, a very large pool of warm water is rising up from the depths. Meanwhile, model runs show sea surface temperatures warming to an average deviation above 1.25 degrees Celsius with some showing values above 2.5 C. Such moderate to strong values, should they emerge, could produce the warmest conditions for the Eastern Pacific since 1998, a powerful event that spiked surface water temperatures for that region up to 2.9 C above normal.

Kelvin Wave Subsurface Temperatures

(Strong Kelvin Wave spreads eastward and features subsurface temperature anomalies in the range of 4-6 C above average in a wide zone at 150 depth. Note the wave beginning to push above 60 meters in a region near the Eastern Pacific during late February. Image source: NOAA.)

Mark Halpert, acting director at the Climate Prediction Center, noted that subsurface warming was “impressive” and seemed quite confident for early spring that this region of the world was developing toward a substantial El Nino event later this year.

Globe to Warm. Amped Hydrological Cycle, Sea Ice Loss to Play a Role in El Nino Induced Weather Swings?

Should the predicted El Nino emerge and be as strong as average model values indicate, global surface temperatures could rise by between .05 and .15 degrees Celsius, pushing climatology into a range of .85 to .95 degrees Celsius above 1880s values. This would be a substantial jump for a single year, resulting in yet one more large shift toward an ever more extreme climate.

Perhaps also as concerning is the fact that El Nino often results in severe weather shifts around the globe. With drought and flood events already being amplified by a 6% increase in the hydrological cycle since 1880 and with a massive reduction in Arctic sea ice coverage playing havoc with the Jet Stream, adding an excess of heat over hundreds of thousands of square miles of Eastern Pacific waters is likely to further increase instability.

As examples, the last, rather mild, El Nino of 2010 coincided with one of the worst heatwaves and wildfire outbreaks ever experienced in Russia, while the powerful 1998 El Nino battered California with a winter-long series of extraordinarily intense storms.

Flattened Jet Stream Aims Storm Track at West Coast

(El Nino flattens and amplifies storm track while aiming it at the US West Coast. In combination with already excessive atmospheric moisture levels driven by human-caused warming, such a situation can result in an extraordinarily extreme progression of storms for California in the event that a strong El Nino combines with human-warming driven weather alterations. Image source: ZoomRadar.)

For the potentially arising El Nino, farmers in California may experience a switch from extreme drought conditions to extreme deluge. The result of a flattening pattern in the Pacific Jet Stream that tends to coincide with El Nino to funnel a river of Pacific moisture directly over the US West Coast. With the hydrological cycle already amped up by human-caused warming, such a large moisture dump could be even worse than those previously experienced.

As observed in 2010, high temperature anomalies over Central Asia that typically coincide with El Nino can, in the current climate state, result in severe droughts and wildfire outbreaks. This could result in an expanding zone of drought and fire as well as produce a troubling hot air pool that could occasionally spill into the Arctic. If the pattern emerges during summer or early fall, the result could be both record sea ice melt and severe heatwaves, wildfires and droughts from the center of the Eurasian Continent all the way to the Arctic Ocean.

It’s worth noting that both increased rates of evaporation and very low levels of Arctic sea ice could amplify some aspects of El Nino induced weather extremes. So the combination of spiking global temperatures and adding yet more weather instability to an already amped up system could make a moderate to strong 2014 El Nino a severe event indeed.

Links:

IRI CPC

NOAA

Dr. Jeff Masters: El Nino Coming in 2014?

El Nino Watch Alert

NASA GISS

A Faustian Bargain on the Short Road to Hell: Living in a World at 480 CO2e

On the highway to a smokestack hell, Faust met a devil who said to him:

“Give me all your tomorrows, all your children and all your children’s children, and I will make this one day, for you, a paradise.”

*    *    *    *    *

Understanding how much warming may be in store from all the CO2, methane, N2O and other greenhouse gasses humans have pumped into the atmosphere can be a bit problematic. First, definitions have tended to be confused due to the fact that equilibrium climate sensitivity measures (Charney) used to project warming for this century by the IPCC only take into account about half of long-term (slow feedback) warming should CO2 and other greenhouse gas levels remain high.

For example, equilibrium climate sensitivity measures show an effective rate of warming by about 3 degrees Celsius (C) for every doubling of CO2 from 1880 onward. By this measure, we get about 3 C worth of warming over this century once we hit 550 ppm CO2 and about 6 C worth of warming at levels around 1100 ppm. It is important to stress that these short term warming projections do not take into account long-term ‘slow’ feedbacks to a given rise of CO2 that are strong enough to double the ultimate temperature increase. This larger Earth Systems Sensitivity (ESS) measure is both observable in paleoclimate and in the various model runs that project a given level of atmospheric CO2 out through the centuries.

Fast Feedback vs Slow Feedback Climate Sensitivity

(Fast feedback equilibrium climate sensitivity over one century vs long term sensitivity over multiple centuries to a given greenhouse gas forcing. Note that approximately double the amount of warming occurs after ‘slow feedbacks’ like ice sheet response and environmental ghg emissions are taken into account. Image source: Leeds.)

So both paleoclimate and most model runs end up with a long term warming of about 6 C at 550 ppm CO2 and of about 12 C at 1100 ppm CO2.

It is here that we run into an additional difficulty. We don’t ultimately know how long, long-term will really be. We hope, and our climate models seem to support this hope, that such ‘long term’ warming from the so-called slow feedbacks like ice sheet albedo response and natural carbon emissions won’t appear in force this century. But given the stunning pace of human greenhouse gas build-up combined with a number of observed ‘slow feedback’ responses going on now, we don’t really know for certain. And there is some reason to believe that the ‘slow feedbacks’ might not be so slow after all.

In this context, the current level of CO2, at around 400 ppm, results in a warming this century of around 1 to 1.5 degrees Celsius (if the slow feedbacks are as slow as expected) and a long-term warming of about 2-3 degrees Celsius. And it is at this point where an already complex dynamic begins to break down, taking on a number of, yet more complex, factors.

A Host of Extra Gasses No-One Really Talks About

At issue is the fact that humans have emitted a massive volume of additional greenhouse gas into the atmosphere. These gasses have grown in proportion and heating effect alongside the, admittedly larger and more significant, CO2 emission. And each has made their own additional contribution to human warming.

Some of these gasses, like methane, have been a typical part of natural atmospheres for millions of years. At times, methane concentrations are observed to have spiked to levels even higher than those seen today. But the periods during which such levels were apparent were also times of global crisis — the hothouse mass extinction events.

Methane Since 1984 MLO

(Atmospheric methane concentrations since 1984 as observed at the Mauna Loa Observatory. Image source: NOAA ESRL.)

But the other gasses: nitrous oxide, CFCs, HFCs, nitrogen triflouride, and a host of nearly 50 other industrial chemicals that contribute to warming were either never in the atmosphere before or were present at much lower levels than what is seen today. The result of this added pollution is yet more potential warming, in addition to a number of other difficult to deal with impacts. A pollution impact that is outside the context of past global crises and that puts current day greenhouse gas forcing at a critical and unstable level.

Methane levels alone have more than doubled since the start of the Industrial Revolution, rising from about 750 parts per billion to about 1835 parts per billion today. This value, depending on how it’s calculated over time, is equivalent to an additional CO2 forcing of between 22 and 110 parts per million. And though methane is the strongest non-CO2 warming agent, adding them all together can result in a value that is quite a bit higher than the base CO2 level would indicate.

Nitrous Oxide MLO

(Atmospheric nitrous oxide levels since 1997 as observed at the Mauna Loa Observatory. Image source: NOAA ESRL.)

In addition, on the negative side of the ledger, human fossil fuel burning (primarily coal) burning emits sulfur dioxide, other sulfates and various aerosols which, overall, create strong negative feedbacks in the climate system by reflecting incoming sunlight. The net result is a temporary suppression of a portion of human-caused warming. The reason this suppression is temporary is due to the fact that the sulfur dioxide and related sulfates rapidly wash out of the atmosphere. So if coal burning ceases, the reflective particles rapidly fall away and we readily come to witness the full strength of the human greenhouse gas emission.

Which brings us to the question — what is the full strength of the current human emission and how long will it last? There’s a term for this number: CO2e. In other words — the equivalent CO2 forcing of all greenhouse gasses added together.

Fortunately for our exploration, there’s been a bit of work done on just this subject. Last year, MIT’s Advanced Global Atmospheric Gasses Experiment issued a report describing model data that determined the current CO2 equivalent forcing from all of the more than 50 greenhouse contributing trace gasses in the atmosphere. And the results were somewhat disconcerting. As of June of 2013, that amount was equal to 478 parts per million CO2. Or a CO2e of 478 parts per million when all the other greenhouse gasses were added to the already high and rapidly rising levels of CO2. Adding in the current rate of CO2 rise, we end up with about 480 parts per million of CO2e from all greenhouse gasses by this year. So if we’re talking about the total burden of all greenhouse gasses and the one that will be with us through the long term, 480 is, unfortunately, the number we should be dealing with and not 400.

Aerosols and the Faustian Bargain

Unfortunately, to determine the current forcing one has to also take into account those pesky aerosols we mentioned above. And, luckily, we also have a reliable measure that provides the negative forcing or relative cooling effect of sulfur dioxide in the current atmosphere. As of 2013, the IPCC had found that sulfates and other effects due to aerosols provided a net negative forcing of about .8 Watts per meter squared or about 1/2 the positive forcing of CO2 which was, then, at around 390 ppmv (2011), about 1.68 Watts per meter squared. This approximate 1/2 value, when divided by the then observed rise in CO2 since 1880 gives us a rough equivalent negative forcing value of minus 55 parts per million CO2e.

ipcc_rad_forc_ar5

(IPCC AR5 Radiative Forcing Assessment. Image source: IPCC)

So subtracting out the net effect of sulfates and other aerosols brings us to a total net forcing from all factors related to human changes to the atmosphere of about 425 ppm CO2e. A rather disturbing final number both due to its departure over the current 400 ppm CO2 value and due to the fact that though most greenhouse gasses have atmospheric residence times of decades to centuries, the cooling sulfates would likely last for 1-2 years before falling out entirely. This means that once fossil emissions stop, we may as well just add +55 ppm CO2e to the current total.

This warmth masking factor of human coal emissions was described by James Hansen as a kind of Faustian bargain in which current burning of the dirty fuel provides temporary respite to warming at the cost of even more rapid future temperature increases. And it is just this devil’s deal in which we are now entangled.

425 CO2e: A Dangerous Interim

So it is likely that current atmospheric forcing, including all greenhouse gasses and all human sulfates, is probably at around 425 ppm CO2e. And since the residence times of these gasses are decades to millennium, while Earth Systems feedbacks appear to be enough to maintain high methane levels indefinitely, we should probably view this as an interim figure when considering how much short and long-term warming is likely locked in.

In the short term, using equilibrium climate sensitivity measures, we are likely to end up with between 1.2 and 1.8 C warming over the course of this century even if all greenhouse gas levels, along with sulfate levels, were to remain stable and if the slow feedbacks move along at the expected pace. Meanwhile, long-term warming of between 2.4 and 3.6 C would be expected if all atmospheric gas levels were to stabilize.

But unless an ongoing regime of sulfate aerosol spraying of the stratosphere were put into place, the sulfates would, predictably, fall out once human emissions stopped. And that rapidly brings us back to the 480 ppm CO2e number.

480 CO2e: What is Probably Locked in Long-Term

Looking at the more permanent 480 CO2e value, the fact begins to sink in that we are already well on the way to extreme climate difficulties. For 480 CO2e, without the reflective aerosols, means that the world probably ends up warming by between 1.8 and 2.3 C before the slow feedbacks kick in and between 3.5 and 4.5 C long-term. At these levels, major ice sheet destabilization and melt is eventually likely to result in between 50 and 140 feet of sea level rise with the only remaining glaciers in the end confined to central and eastern Antarctica.

The only saving grace to a cold turkey cessation of emissions now is that most of the worst amplifying feedbacks are likely to be kept in check and thus prevent rapidly accelerated warming and climate destabilization. The extra 1.7 to 2.2 C worth of long-term warming likely comes from a combination of albedo loss, permafrost thaw and related ghg release keeping currently high levels high long-term, and, perhaps, a methane belch in the 1-50 gigaton range that spikes atmospheric levels.

I say likely to be kept in check… but we have to also consider that there is a low, but not out of the question, risk of setting off a kind of mini-runaway that generates warming far beyond the expected range and pushes climates to a hothouse state not seen since the PETM or Permian extinction events. There is little evidence for such an event in response to current climate forcings in the models at this time, but we have a number of scientists, including Peter Wadhams, Natalia Shakhova, and Igor Simeletov, who have raised the possibility, based on their observations of Arctic sea ice and carbon stores, that just such an event could be in the offing. Unfortunately, without more in-depth research into the potential pace of release of current carbon stores (permafrost, forest, clathrate, ocean) we don’t have a scientific oracle that provides a comfortable certainty on this key issue.

It’s worth noting that this best possible future, where the risk of a mini-runaway in warming to PETM or Permian levels remains low, probably won’t happen as business as usual fossil fuel emissions continue unabated with no sign of being rationally held in check. Under the current regime, a CO2e of about 550 ppm, enough to warm the Earth between 5-6 C long term, is locked in within 25-30 years. A climate state that pushes the risk of a mini-runaway to moderate. Meanwhile, levels that would almost certainly set off a Permian or PETM type, anoxic ocean, extinction event, at around 800 ppm CO2e, become possible under BAU by 2060-2080.

The situation is, therefore, once again worse than expected…

Links:

400 PPM CO2? Add in Other Gasses and It’s 478 CO2e

Earth Systems Sensitivity

Leeds Climate Sensitivity

Jules Charney (bio)

NOAA ESRL

Radiative Forcing Links:

Real Climate: Radiative Forcing

The Advanced Global Atmospheric Gasses Experiment

NOAA: Radiative Forcing of Non-Greenhouse Gasses

IPCC: Initial Radiative Forcing Assessment

Non-CO2 Greenhouse Gasses: Scientific Understanding, Control and Implementation

CDIAC: Recent Greenhouse Gas Concentrations and Analysis

IPCC AR4 Appendix/Glossary

Nitrous Oxide and Climate Change

Sea Ice Loss, Human Warming Places Earth Under Ongoing Fire of Severe Weather Events Through Early 2014, Likelihood of Extremes For Some Regions Increases by 500%

Heat overburden at the roof of our world. It’s a dangerous signal that the first, worst effects of human-caused climate change are starting to ramp up. And it’s a signal we are receiving now. A strong message coinciding with a world-wide barrage of some of the worst January and February weather extremes ever experienced in human reckoning.

An Ongoing Arctic Heat Amplification

Ever since December, the Arctic has been experiencing what could well be called a heat wave during winter-time. Average temperatures have ranged between 2 and 7 degrees Celsius above normal winter time readings (1979-2000) over the entire Arctic basin. Local readings frequently exceed 20 degrees Celsius above average over large zones that shift and swell, circulating in a great cloud of abnormal warmth around the roof of the world.

Today is no different.

Global Temp amomaly March 4

(Global Temperature Anomaly on March 4, 2014 showing a warmer than normal world sitting beneath an ominously hot Arctic. Image source: University of Maine.)

Average temperatures for the entire Arctic are 4.16 degrees Celsius above the, already warmer than normal, 1979 to 2000 base line, putting these readings in a range about 6 degrees Celsius above Arctic temperatures during the 1880s. When compared to global average warming of about .8 C above 1880s norms, this is an extreme heat departure that places the Arctic region well out of balance with both its traditional climate and with global climate at large.

Local large hot zones with temperatures ranging between 10 and 20 degrees Celsius above average appear east of Svalbard, in the Arctic Ocean north of the East Siberian Arctic Shelf, and over a broad swath of the Canadian Arctic Archipelago. These zones of warmth are as odd as they are somewhat horrific, creating regions where temperatures are higher than they would otherwise be in April or, in some cases, late May.

Sea Ice Melt Over a Warming Arctic Ocean

This ongoing condition of extreme Arctic heat is a symptom of overall Arctic amplification set off by a number of strong feedbacks now underway. These include sea ice measures that are currently at or near record low values (February saw new record lows in both extent and area measures) as well as a large and growing local emission of greenhouse gasses from polar stores long locked away by the boreal cold. Arctic geography also contributes to the problem as a thinning layer of sea ice rests atop an ocean that is swiftly soaking up the heat resulting from human warming.

During winter time, the combination of thin sea ice, warm ocean, and higher concentrations of greenhouse gasses generates excess warmth over and near the Arctic Ocean basin. The warmer waters, having trapped solar heat all summer long, now vent the warmth into the polar atmosphere through the sparse, cracked, and greatly diminished sea ice. And while this increasing heat imbalance has been shown to be lengthening the melt season by 5 days per decade, it is also stretching its influence well into winter time as ocean heat now continually bleeds through a thinning and ever more perforated layer of sea ice.

Other effects include an overburden of greenhouse gasses trapping long wave radiation to a greater extent in the polar zone while the already warmer than usual condition creates weaknesses in the Jet Stream that generate large atmospheric waves. The south-north protrusions of these waves invade far into the Arctic Ocean basin over Svalbard and Alaska, transporting yet more heat into the Arctic from lower latitudes.

The net effect is the extraordinary Arctic warming we are now seeing.

Earth Under Continuous Fire of Extreme Weather

This rapidly increasing warmth at the Arctic pole generates a variety of weather instabilities that ripple on through the Northern Hemisphere. Meanwhile, the ongoing impacts of equatorial warming or such warming in concert with the far-flung effects of polar amplification and an increase in the hydrological cycle of about 6% are causing a number of extraordinary events over the Southern Hemisphere.

In short, the barrage of extreme weather is now entirely global in nature. A brutal if amazing phenomena directly associated with a human-heated climate system.

Extreme weather map

(Map of extreme weather events throughout the world from January 1 through February 14. Note that it is now difficult to find a region that is currently not experiencing exceptional weather. Image source: Japanese Meteorological Agency.)

Over the western US, Canada, and Alaska, a Jet Stream ridge that has persisted for a year has generated both abnormally warm conditions for this region, with Alaska experiencing its third hottest January on record, and an extreme drought for California that is among the worst in its history. This drought is now poised to push US food prices up by between 10-15 percent as California officials are forced to cut off water flows to farmers.

Only the most powerful of storm systems are able to penetrate the ridge. And the result, for the US West Coast, is a condition that either includes drought or heavy precipitation and flooding events. A condition that became plainly apparent as winter storm Titan dumped as much as 5 inches of rainfall over drought-stricken southern California, setting off landslides and flash floods that sent enormous waves of water and topsoil rushing down roads and gullies alike. And though the storms came, the drought still remains.

Added to the list of extremes for the Western US are a number of early starts and/or late ends to fire seasons with California, Arizona and New Mexico all experiencing wildfires during the period of December through February.

Moving east, we encounter the down-sloping trough that is the flip side of the ridge bringing warmth and drought to deluge conditions to the west. So, for the Eastern and Central United States, we see the transport of chill air down from the Arctic Ocean, over Canada and deep into a zone from The Dakotas to Texas to Maine. As a result, we have seen winter storm after winter storm surge down into these regions, dumping snow, ice, and heavy rain while occasionally coming into conflict with Gulf warmth and moisture to spark tornadoes and thunderstorms over snow-covered regions.

One cannot separate the warm air invasion over Alaska and the heat radiating out of the perforated sea ice from the numerous polar vortex collapse events that have led to this extreme winter weather over Central and Eastern parts of the US. And so, it is also impossible to ignore the warping and deleterious impacts of human-caused climate change on the world’s weather.

The World Meteorological Organization (WMO), in its latest extreme weather assessment notes:

In the winter a deep reservoir of cold air becomes established through the atmosphere over the Arctic because of the lack of sunlight. This is usually held over high latitudes by the Jet Stream, a fast moving band of air 10 km up in the atmosphere which drives weather. This year, a “kink” in the jet stream allowed the reservoir of cold air to move southwards across the USA. A blocking pattern meant it was locked into place, keeping severe weather systems over much of the Eastern United States extending down to northeast Mexico.

This ‘kink’ and related blocking pattern the WMO mentions is also the leading edge of the advance of cold Arctic air over the North Atlantic which combined with ocean heat and moisture to aim intense storms at Western Europe. In essence, a powerful planetary wave or Rossby Wave type feature:

Planetary Wave

(The Northern Hemisphere Jet Stream takes on Planetary Wave pattern with an extreme high amplitude ridge over the Western US, Canada, Alaska and the Beaufort Sea and a deep, cold trough digging into the Eastern US and spreading out over the North Atlantic on February 26th. Image source: University of Washington.)

For as we look yet further East we come to a North Atlantic Ocean that has been little more than the barrel of a gun firing a two and a half month long barrage of storms at England and Western Europe. For the Jet Stream, at this point, is intensified by Arctic air fleeing from a warming north coming into contact with the also warming waters of the North Atlantic. In this region, the planetary wave feature developed with severe and lasting consequences for England, France, Portugal and Venice.

The upshot was the wettest period in over 250 years for England as well as the windiest period since at least the 1960s. During February, two of these storms generated 80-100 mph winds and waves off Ireland and the UK that were the highest ever recorded for this region. Meanwhile, the powerful storm surges associated with these storms reshaped the English coastline, uncovered bombs dropped during World War II and unearthed the stumps of an ancient forest that spread from England to France before it was buried in the floods of glacial melt at the end of the last ice age. The battering continues through early March with England suffering losses in excess of 1 billion dollars.

The storms ripping across the Atlantic also resulted in the loss of over 21,000 sea birds and have heavily impacted France, Spain and Portugal with record rains, gales and tidal flooding. During early February, a series of gales also drove high tides along the coast of Italy and spurred flooding in Venice.

As storms slammed into coastal western Europe, strange fires were also burning along Arctic shores as a very dry and windy winter sparked blazes along the coastlines of Norway. These fires, some of the worst in Norway’s history, occurred during January and February, months that have never seen wildfires before. So the strange story of flood and fire that tends to come with climate change may seem yet more radical and extreme when we include what has happened over this section of Europe during 2014.

By the time we enter Eastern Europe, Turkey, Jordan, Israel and Russia we again encounter an up-slope in the Jet Stream along with related periods of heat and drought. Record highs were set throughout a zone from Germany to Slovenia to Russia. Germany experienced January temperatures that were 2.8 degrees Celsius above the 20th Century average while Russia experienced heat anomalies approaching 10 degrees Celsius hotter than normal that persisted for up to a week in length. In Turkey, farmers frantically drilled into drying lake-beds for water as both warmer and drier than normal conditions combined with ground water depletion to generate severe agricultural stress.

But the strain for Israel, which experienced lowest ever winter rainfalls and one of the worst droughts in its history, was far worse. According to the Israeli Water Agency’s March 4 Statement, water supplies across the country were now at record low levels:

“Such low supply during this period has never before been documented and is unprecedented in Water Authority records,” the agency said. “The negative records broken in February are much more dramatic and significant than those of January.”

Drought-stressed Jordan has also been forced to ration water supplies, with rainfall levels now only 34 percent of that received during a typical January and February.

Abnormal warmth and drought also extended into China as most parts of the ancient empire received between 50-80 percent below average rainfall. Temperatures averaged over the entire country were the warmest seen since at least 1961. The warmth and dryness resulted in record low river and lake levels across the country with China’s largest lake turning into a sea of cracked mud and grasses.

In Singapore and nearby Malaysia, a two month-long heatwave is now among the worst ever recorded for this region. The situation has been worsened as nearby forest fires have combined with industrial pollution to produce a kind of all-encompassing smog. A nasty brew that cut visibility in the region to less than one kilometer.

Smoke Smog Singapore Maylaysia

(Smoke and smog from fires and industrial activity visible over Singapore and Malaysia. Image source: Lance-Modis.)

One would think that, with major heat anomalies occurring over the Arctic, the far removed Southern Hemisphere would be somehow insulated from impacts. But whether from far-reaching Arctic influence or simply from other factors related to human-caused climate change, austral regions were among the hardest hit by the, now global, spate of extreme weather events.

Australia’s record 2013 heatwave didn’t miss a beat as a hottest ever summer continued on through January and February. A period in the middle of January showed exceptionally severe high temperatures with World Meteorological Agency reports noting:

One of the most significant multi-day heatwaves on record affected southeast Australia over the period from 13 to 18 January 2014. The major area affected by the heatwave consisted of Victoria, Tasmania (particularly the western half), southern New South Wales away from the coast, and the southern half of South Australia. Over most parts of this region, it ranked alongside the heatwaves of January-February 2009, January 1939 and (from the limited information available) January 1908 as the most significant multi-day heatwaves on record.

A number of site records were set during the summer, including:

• Melbourne had seven 40ºC days; annual average is one day

• Adelaide had 11 days of 42ºC or above; annual average is one day

• Canberra had 19 days of 35ºC or above; annual average is 5.4 days

While Australia was sweltering under its hottest summer on record, south-central Brazil was suffering its worst-ever drought. By mid February, Brazil had been forced to ration water in over 140 of its cities. The result is that neighborhoods in some of Brazil’s largest cities only receive water once every three days. During this, extraordinarily intense, period of heat and dryness, untold damage was done to Brazil’s crops. But, by early March, a doubling of prices for coffee coming out of Brazil gave some scope to the damage. January was also Brazil’s hottest on record and the combination of extreme heat and dryness pushed the nation’s water reservoirs for southeastern and west-central regions to below 41 percent of capacity driving utility water storage levels to a critically low 19 percent.

In near mirror to the US weather flip-flop, northern Brazil experienced exceptionally heavy rainfall, apparently gaining back the lion’s share of moisture lost in the south and stalling a two year drought affecting north-eastern regions.

In combination, these crazy weather extremes are thought to have done nearly $5 billion in damages to Brazil’s crops so far this year, on top of $9 billion in losses last year. Losses run the gambit from coffee to beef, soy, citrus, and sugarcane. It is worth noting that Brazil is the largest producer of all these foodstuffs with the one exception being soy.

The same drought impacting Brazil also damaged crops in Paraguay and Argentina with soybeans among the hardest hit.

Given the ongoing extreme weather impacts, it is worth noting that world soybean prices are now up by more than 9 percent over the 2012-2013 period with almost all foodstuffs seeing price increases in the global marketplace. The UN FAO food index remained over 200 through late January, a dangerously high indicator that shows numerous countries having difficulty supplying affordable food to their populations.

Extremes Cover the Globe

The above list does little justice to the depth and scope of extremes experienced, merely serving to highlight some of the most notable or severe instances. In general, it could well be said that the world climate crisis is rapidly turning into a world severe weather crisis. January and February are usually rather calm months for the globe, weather-wise. So the fact that we are seeing record storms, rainfall, snowfall, floods, fires, droughts, winds, and heatwaves in every corner of the globe during what should be a relatively mild period is cause for serious concern.

And many scientists are taking notice. For example, Omar Baddour, Chief of the WMO’s data division observes an amazing ramping up of extreme weather events worldwide, citing preliminary model assessments in an interview with The Guardian, he notes:

“We need more time to assess whether this is unusual [on a global level] but if you look at the events in individual regions, like the heatwave in Australia or the cold in the US, it looks very unusual indeed. Next month we will publish a major report showing the likelihood of extreme heatwaves is increased 500% [with climate change].”

The shadow climate change casts has grown very long and there is little that has not now been touched by it. But, sadly and unfortunately, even under a regime of full mitigation and adaptation, the worst effects are yet to come. If we are wise, we will do our best to mitigate as much as we can and work together to adapt to the rest.

Hat Tip to Colorado Bob

Links:

The World Meteorological Organization

University of Maine

University of Washington

Japan Meteorological Agency

Lance-Modis

UK Endures Endless Barrage of Storms

Ice-free Season Getting Longer by Five Days Per Decade

Mangled Jet Stream Sparks Drought, Winter Wildfires in California

For Arizona and New Mexico, Climate Change and a Mangled Jet Stream Means Fire Season Now Starts in February

World Food Security in the Cross Hairs of Human-Caused Climate Change

Arctic Wildfires in Winter

California Storms Didn’t End Drought

The Biggest Disaster You’ve Never Heard of

Haze Shrouds Malaysia

Brazil Rations Water in Over 140 Cities

World Begins 2014 With Unusual Number of Extreme Weather Events

Brazil Loses Billions as Crops Reduced By Wacky Weather

A Tale of Two Ice Caps: As Arctic Ocean Heads Toward Ice-Free Summers, New Study Shows Human Warming Takes Out 56% of Antarctic Sea Ice by 2050

Thus far, the Arctic has been ground zero for human-caused climate change. A combination of sea ice melt, albedo loss, a warming ocean that transports heat beneath a melting ice cap, regions of Jet Stream retreat into the far north, and an overburden of greenhouse gasses near the pole, among other factors, have all resulted in a very rapid pace of local warming.

Global temp anomaly

(Global surface temperature anomaly over the last month features a high degree of, very visible, Arctic heat amplification. Most global warming models show the Arctic warms rapidly first under human warming. Then, as second stage warming progresses, heat begins to spike over other regions of the globe. Image source: NOAA ESRL.)

While global warming totals about .8 C above the 1880s average, about 1/6th the difference between now and another ice age, but on the side of hot, Arctic warming has pushed above 3.0 C during the same time period. And as the Arctic is warming four times as fast as the rest of the globe, many of human climate change’s most extreme impacts are now visible there.

The Arctic’s Massive and Dramatic Loss of Sea Ice

A primary measure of Arctic warming has been sea ice melt. And Arctic sea ice melt during the past few decades has been nothing if not dramatic. By end of summer 2012, a time when sea ice melt is most intense, area and extent totals had fallen more than 50% below their 1979 measurements. Meanwhile, Arctic sea ice volume, a measure of area + thickness, had fallen by as much as 80%. These losses are dramatic and raise the possibility for ice free summers, if the weather conditions line up, during a period between now and 2030.

arctic-death-spiral-1979-201302

(Arctic death spiral showing sea ice volume measurements for all months from 1979 through early 2013. Image source: Skeptical Science. Data source: PIOMAS.)

Thin Ice Over Warming Water

As hinted at above, the Arctic has a number of unique characteristics that make it vulnerable to rapid warming in the context of a more slowly warming globe. And chief among these is geography — warmer continents surrounding a mostly frozen ocean.

A lion’s share of the northern polar ice cap area is composed of sea ice. By area, even after the stunning losses seen since 1979, the sea ice cap composes about 10.5 million square kilometers on average. Greenland, in contrast, only boasts an ice sheet of around 2 million square kilometers. This large layer of ice provides an amazing amount of cooling just due to its white, reflective properties. In the past, this albedo has helped to maintain a zone of very cold air centered almost directly over the pole.

But this Arctic system of cold amplification and northern refrigeration has a major Achilles heel. For the sea ice sits upon an ocean that is much closer to the melting point of water than any frozen land mass. Furthermore, all ocean systems are connected and, to one degree or another, readily transport heat.

Melting Arctic Sea Ice

(Melting Arctic sea ice during summer. Image source: NASA.)

In the context of human-caused warming, the majority of northern polar ice area is little more than a relatively thin layer sitting atop an ocean that is rapidly collecting atmospheric heat. A context that can result in rather dramatic consequences. In short, what this means is that northern polar ice sheet inertia isn’t quite so strong as was previously hoped.

A warming ocean eats away at the bottom ice. And as the thin, frozen ice layer of white, reflective ice is, at first gradually, and then more rapidly, replaced by dark, absorptive ocean the Arctic refrigerator breaks down and, increasingly, turns into a heat amplifier. A quickening pace of albedo loss means an even more rapid pace of warming for the ocean waters below. As warmth concentrates, more feedbacks come into play. Greenhouse gasses like methane and CO2 become liberated from the ice and also go to work in setting off warming. These feedbacks work in concert and, for a time, the Arctic heat rapidly amplifies.

Arctic heat amplification is now plainly visible in winter months when heat absorbed by a mostly ice-free Arctic Ocean during summer radiates up through thin and crack-riddled ice. In this way, heat bubbling up through the ice displaces cold, Arctic air southward, sparking off severe weather. An ongoing event that was particularly extreme during the winters of 2012-2013 and 2013-2014 when Arctic air first fled south over Europe and then the central and eastern United States (see polar vortex collapse).

An extended period of heat amplification has been the story of Arctic warming ever since the world began to heat up during the 1880s. A more moderate spurt of sea ice loss coincided with the growing Arctic warmth from the 1920s to the 1950s before stalling in the 60s and 70s, only to resume with a vengeance during the 1980s. Today, the extreme of Arctic heat amplification results in a number of rather severe knock-on effects that threatens everything from even larger Arctic greenhouse gas releases (methane, CO2) and severe changes to the Jet Stream that may well wreck the periods of relatively stable weather human beings in the north have been used to for 10,000 years running.

Antarctic — Vast Continental Ice Sheets Surrounded By Oceans

Moving southward into the still frozen austral regions, we find a geography and related pace of climate change that is markedly different. Here the vast glaciers pile atop a Continent that has now been buried and frozen for millions and millions of years. The cold is locked into ice sheets that reach thousands of feet in height, cover an area of nearly 14 million square kilometers, and plunge deep into the long-frozen Earth. If the ice in the Arctic is merely a thin facade covering warmer oceans, the Antarctic ice is a thick fortress atop adamant and frozen earth.

The degree of inertia this represents for human-caused climate change is, therefore, much greater than what we see up north. And though the Antarctic fortress is far from impenetrable to the radically strong assaults of human warming, it will resist their insults for longer, giving way its great piles of ice in a more ablative fashion with, likely, even more stark and shocking results.

This densely frozen geography coming into conflict with human-caused warming has resulted in far-reaching, though less visible, impacts. Overall, largely due to the heat-insulation effect of Antarctica, southern hemisphere warming has progressed far more slowly than warming in the north. Here the battle is one of inches in which regions closer to the equator, such as Australia and the equatorial oceans, show the highest rates of warming. Meanwhile, Antarctica has remained, for the most part, a bastion of cold with increasingly intense wind fields isolating it from the more rapidly warming regions. In this case, and in contrast to the Northern Hemisphere Jet Stream, the upper level winds surrounding the South Pole have strengthened even as they have slowly receded.

Antarctica summer storms

(Antarctica surrounded by storms on March 2 of 2014 as a combination of austral summer and human warming shove the Southern Hemisphere Jet Stream toward the pole. Image source: Lance-Modis.)

Such a recession resulted in very hot, dry weather for southern Australia as equatorial heat shoved the strong winds and related storms ever southward. Meanwhile, increased rates of evaporation held in check the benefits of equatorial rain expansion into northern regions. Only the occasional challenge to this new, retreating Jet Stream, breaks the pattern of expanding drought in the south with extraordinary precipitation and storm events. And so Australia has suffered a series of worst droughts and fires on record interrupted by brief but very intense rain events over the past decade.

While the vast ice sheets of Antarctica have, so far, served as a buttress against atmospheric warming even as the Jet Stream retreated southward, heat in the ocean again went to work. Though mostly protected by vast and frozen continental lands to the west, the more northerly segment of East Antarctica featured large sections of submerged continents upon which rested immense, sea terminating ice sheets. Some of these great ice sheets had sections submerged hundreds of feet below sea level. And though the surface waters only gradually warmed, deeper down, the story was much different.

The endless calving of Antarctica’s glaciers sends off thousands of ice bergs from the shores of Antarctica each year. This massive calving cools the surface waters near Antarctica through both the melting of these frozen hills and mountains as well as the chilling effect they have on nearby air currents. As such, cold waters continually flow out from Antarctica. But even these waters have been impacted by human caused climate change, grudgingly increasing in temperature over the decades.

Pine Island Glacier Calves into Amundsen Sea

(Pine Island Glacier calves into the Amundsen Sea. A recent study found this large ice sheet was in the first stages of irreversible collapse. Image source: iSTAR-NERC.)

If the cold surface waters surrounding Antarctica have warmed only slowly, the story of the depths is somewhat different. Down-welling warmer and saltier waters contacting the Antarctic Circumpolar Current create a growing pool of warmth extending to the Antarctic Continental Shelf boundary. There, water circulation dynamics cause the warm water in the abyss to up-well even as it contacts the ocean terminating polar ice sheets.

The warm water thus eats away at the undersides of these ice sheets, causing increasing instability in some of the most vulnerable regions of West Antarctica. This heat transfer from the ocean depths has set off a significant erosion in a number of very large ice sheets and is now spurring the massive Pine Island Glacier (PIG) into an unstoppable rush to the sea.

Models Show Antarctic Sea Ice to Rapidly Decline through Mid Century

If Antarctic warming has been more subtle than the explosive heat amplification of northern regions, it is no less ominous. At the very least, it resulted in locking in 1-2 meters of sea level rise through irreversible ice sheet collapse spurred by warm water upwelling and now puts at risk many more meters of eventual increases to follow.

But, at the surface of the waters, despite a period of slowly rising warmth, the buffer zone of Antarctic sea ice has remained somewhat stable since 1979, even showing periods of moderate increase in overall area and extent. As described above, this is in marked contrast to a stunning collapse of Northern Hemisphere sea ice. A contrast that has served as foil for much debate over the ongoing impacts of human warming even as it was exploited as fodder by climate change deniers, when they weren’t out chasing the most recent snowstorm.

seaice.anomaly.antarctic

(Antarctic sea ice area anomaly since 1979 shows a slight increase in overall coverage, primarily due to a counter-trend increase in Ross Sea ice coverage. New studies show Antarctic sea ice is now set to rapidly decline. Image source: Cryosphere Today.)

Looking more closely, though, one finds that the current expansion of Antarctic sea ice may well be very precarious. For of the three embayments containing Antarctic sea ice only one — the Ross Sea — has shown sea ice growth in recent years. The other two have either remained stable or shown slow recession.

Polar researchers had attributed the moderate net expansion of southern sea ice to a combination of increasingly strong winds spreading out Ross ice flows during winter, a freshening of surface waters through the ongoing melt of Antarctica’s ice sheets that increases the melt temperature of ice and thus encourages its formation, and to changes to ocean currents and rates of precipitation. Now, a new study conducted by researchers at the Virginia Institute of Marine Science has found that this relative period of Ross sea ice stability and growth is about to end.

Warmth About to Crash Through Antarctica’s Gates

The various fragile conditions that have conspired to expand Ross Sea ice are now about to collapse under an onrush of increasing temperatures. For according to a new study entitled The Effects of Changing Winds and Temperatures on the Oceanography of the Ross Sea During the 21rst Century high resolution climate models show both increasing temperatures and rapidly melting ice in this critical and climatologically sensitive region under a regime of business as usual fossil fuel emissions.

According to the study’s authors:

We examined the effects of projected changes in atmospheric temperatures and winds on aspects of the ocean circulation likely important to primary production using a high-resolution sea ice–ocean–ice shelf model of the Ross Sea. The modeled summer sea ice concentrations decreased by 56% by 2050 and 78% by 2100.

In short, the bounding Jet Stream, the insulating continental Antarctic ice, and the cold surface waters surrounding the continent can’t keep out an ever increasing level of human-caused warming indefinitely. Over the coming decades this warmth will pulse higher in the region surrounding Antarctica with profound impacts to sea ice, resulting in a more than 50% reduction by 2050 and a 78% reduction by 2100.

The study also found that:

The ice-free season also grew much longer, with the mean day of retreat in 2100 occurring 11 days earlier and the advance occurring 16 days later than now.

In essence, the spring and summer melt season throughout the Antarctic region was shown to extend nearly one month longer than today’s period of melt and warmth. Such an expansion of heat intensity and duration will have profound impacts not only for sea ice, but for land ice and for life in the oceans as well.

Mixing Layers Reduced, Large Phytoplankton Blooms to Follow

Perhaps less visible but somewhat more ominous are ocean changes that are projected as Antarctic sea ice goes into rapid decline. Study authors found that ocean mixing over the region would fall by 12% by 2050 and a remarkable 44% by 2100. This dramatically increased stratification would, at first, result in very large blooms of phytoplankton as the surface waters see far more oxygen and the depths become ever-more deprived. This riot of microbial life may seem a positive development for the Ross Sea. But, if anything, it is a sign of oceanic productive zones moving southward to the polar region.

More ominous is the impact on krill and larger animals dependent on these small swimmers. Sea ice is critical to the survival of many krill species. And with its decline, these marine animals are likely to be negatively impacted.

According to lead author, Dr. Walker Smith:

our results suggest that phytoplankton production will increase and become more diatomaceous. Other components of the Ross Sea food web will likely be severely disrupted, creating significant but unpredictable impacts on the ocean’s most pristine ecosystem.

Links:

The Effects of Changing Winds and Temperatures on the Oceanography of the Ross Sea During the 21rst Century

The Storms of Arctic Warming

Arctic Sea Ice Melt, Methane Release Shows Amplifying Feedbacks to Human-Caused Climate Change

Arctic Heat Wave to Rip Polar Vortex in Half

Scientists: Ocean Warming, Upwelling to Make an End to Antarctica’s Vast Pine Island Glacier

NOAA ESRL

Lance-Modis

NASA

Cryosphere Today

Skeptical Science

PIOMAS